
Abstract
BACKGROUND AND PURPOSE: Diffusion-weighted images (DWIs) have been used to study various diseases, particularly since echo-planar techniques shorten examination time. Our hypothesis was that DWIs and tumor apparent diffusion coefficients (ADCs) could provide additional useful information in the diagnosis of patients with brain tumors.
METHODS: Using a 1.5-T MR unit, we examined 56 patients with histologically verified or clinically diagnosed brain tumors (17 gliomas, 21 metastatic tumors, and 18 meningiomas). We determined ADC values and signal intensities on DWIs both in the solid portion of the tumor and in the peritumoral, hyperintense areas on T2-weighted images. We also evaluated the correlation between ADC values and tumor cellularity in both gliomas and meningiomas.
RESULTS: The ADCs of low-grade (grade II) astrocytomas were significantly higher (P = .0004) than those of other tumors. Among astrocytic tumors, ADCs were higher in grade II astrocytomas (1.14 ± 0.18) than in glioblastomas (0.82 ± 0.13). ADCs and DWIs were not useful in determining the presence of peritumoral neoplastic cell infiltration. The ADC values correlated with tumor cellularity for both astrocytic tumors (r = −.77) and meningiomas (r = −.67).
CONCLUSION: The ADC may predict the degree of malignancy of astrocytic tumors, although there is some overlap between ADCs of grade II astrocytomas and glioblastomas.
MR diffusion imaging has been used to study various diseases and the normal brain (1–10). The development of techniques capable of accurately depicting tumor grades in vivo is important for determination of the most appropriate treatment for glioma. An unfortunate choice of biopsy site or insufficiently large samples may result in an incorrect histologic diagnosis. In malignant gliomas, peritumoral edema, which can be depicted with either CT or MR imaging, often has been reported to have infiltrating neoplastic cells (11). Therefore, the tumor border is still inaccurately depicted even with imaging techniques. Because our initial observations of astrocytic tumors revealed a relatively good correlation between apparent diffusion coefficient (ADC) and tumor cellularity, we expanded our study to include brain tumors metastasized from elsewhere and meningiomas, both of which commonly have peritumoral edema. Our hypothesis was that diffusion-weighted images (DWIs) and tumor ADCs could provide additional useful information in the diagnosis of patients with brain tumors, such as tumor malignancy, peritumoral infiltration, and the type of meningioma.
Methods
We enrolled 56 patients with histologically verified or clinically diagnosed brain tumors. They ranged in age from 27 to 78 years (mean, 55.5 years). Seventeen gliomas (nine glioblastomas and eight grade II astrocytomas), 21 metastatic tumors, and 18 meningiomas were included. Four patients with glioblastoma underwent surgery, and two underwent biopsy. Two cases of glioblastoma were diagnosed on the basis of CT, MR imaging, and cerebral angiography, which showed abnormal neovascularity and early venous filling; these patients did not undergo surgery. One patient with recurrent low-grade astrocytoma also did not receive surgery. In one patient with glioblastoma and two patients with grade II astrocytoma, the tumors were recurrent. In patients with metastases to the brain, the primary tumors included 13 lung carcinomas, five gastrointestinal carcinomas, two renal cell carcinomas, and one breast cancer. Only three patients with metastatic tumors underwent surgery and histologic diagnosis; all other such patients were diagnosed clinically. There were eight meningothelial, eight fibrous, and two transitional meningiomas. The meningiomas did not show discernible calcification on CT scans (calcified meningiomas were excluded from this study). One meningioma was recurrent. Peritumoral edema (hyperintense area on T2-weighted images) was noted for eight of nine glioblastomas, four of eight grade II astrocytomas, 19 of 21 metastatic tumors, and 10 of 18 meningiomas.
Using a 1.5-T MR unit, we obtained axial T1-weighted images with imaging parameters of 500/14–15 (TR/TE), a slice thickness of 5 mm, an interslice gap of 1.5 mm, a field of view of 20 to 24 × 20 to 24, and a matrix of 256 × 192 to 256; T2-weighted spin-echo images with imaging parameters of 4000/102 to 105 (TR/TE), a slice thickness of 5 mm, an interslice gap of 1.5 mm, a field of view of 20 to 24 × 20 to 24, and a matrix of 256 × 224 to 256; and DWIs with imaging parameters of 5000/101 to 118 (TR/TE), a slice thickness of 5 mm, an interslice gap of 1.5 mm, a field of view of 20 to 24 × 20 to 24, a matrix of 128 × 128, bandwidth of 79 kHz, gradient strength of 22 mT, duration of diffusion gradients of 31 ms, and gradient separation of 42 ms, in three orthogonal directions. The DWIs were acquired (b values = 0, 600, 800, 1000) by using the echo-planar imaging (EPI) sequence that combined the motion-probing gradient (MPG) before and after the 180o pulse with EPI readout, and fat was suppressed by placing a frequency-selective RF pulse before the pulse sequence.
We then obtained contrast-enhanced, axial T1-weighted images from each patient. The ADC maps and values were calculated on a workstation. We recorded the ADC values from the solid portion of the tumor and from peritumoral, hyperintense areas on T2-weighted images. The ADC values in our study represent averaged ADCs of two to five regions of interest (ROIs); each ROI was about 10 to 20 mm2 (Figs 1–5). We also recorded signal intensities on DWIs of the tumor and of the peritumoral, hyperintense areas on T2-weighted images for possible contribution to tumor grading and quantification of neoplastic cell infiltration. Because subtle hyperintensity is a common, nonspecific finding, we classified these intensities into two grades: mild or moderate. In patients who had grade II astrocytoma with poor enhancement, ROIs were chosen after identifying the tumor area on T1- and T2-weighted images.

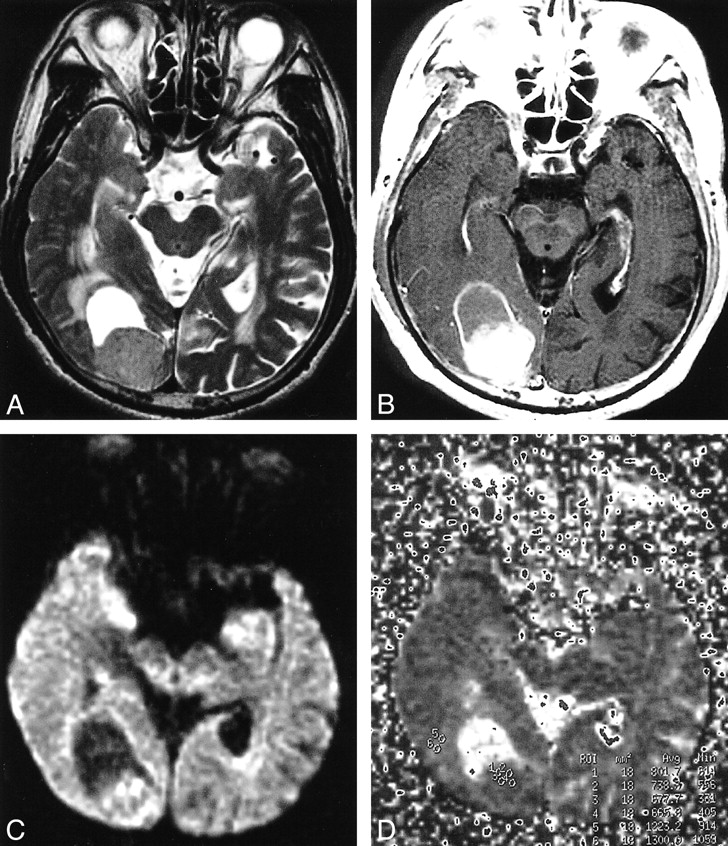
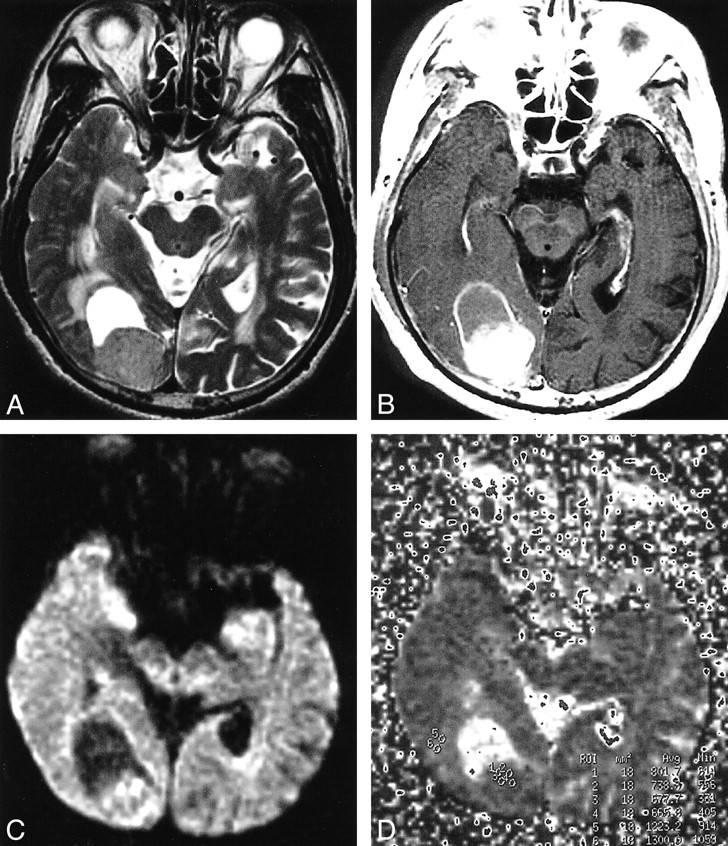
Glioblastoma in the right temporal lobe.
A, T2-weighted image showing tumor of mixed intensity (from low to high) with peritumoral edema.
B, The tumor shows heterogeneous enhancement after intravenous injection of contrast medium.
C, On DWI, a solid portion of the tumor is isointense to moderately high in intensity, and edema is isointense.
D, The ADC map calculated from DWI. Small circles from 1 to 12 in the right medial temporal lobe indicate the regions of interest (which are too small to be seen).
Surgical specimens were reviewed by a pathologist. In this article, we use the terms glioblastoma and malignant glioma interchangeably. Tumor specimens were graded according to criteria from the World Health Organization (12). Tumor cellularity was analyzed in four patients with glioblastoma and six patients with grade II astrocytoma (all six cases were grade II), eight patients with meningothelial meningiomas, and eight patients with fibrous meningiomas. Tumor cellularity could not be determined for five of nine patients with glioblastoma; two did not undergo surgery and three had histologic specimens insufficient for cell counting. Two of eight patients with grade II astrocytoma were not analyzed for tumor cellularity for similar reasons. Only three histologic specimens of metastatic tumor were obtained.
Tumor cellularity was calculated with a computer program that used the following algorithm. First, digitized sample images were cut out from original microscopic histologic images containing an ROI; these had a 512 × 512 display matrix and 8-bit gray level. We then derived binary image data from the sample images using a threshold value estimated from histogram analysis of the sample images. Finally, we calculated cellularity between the area of tumor cells separated by the binary procedure and the whole area of sample images. The accuracy of this application was confirmed by prestudy examination of simulated sample images for which cellularity was already known. Statistical analysis was performed with Student's t test.
Results
ADCs of Tumor and Peritumoral, Hyperintense Areas on T2-weighted Images
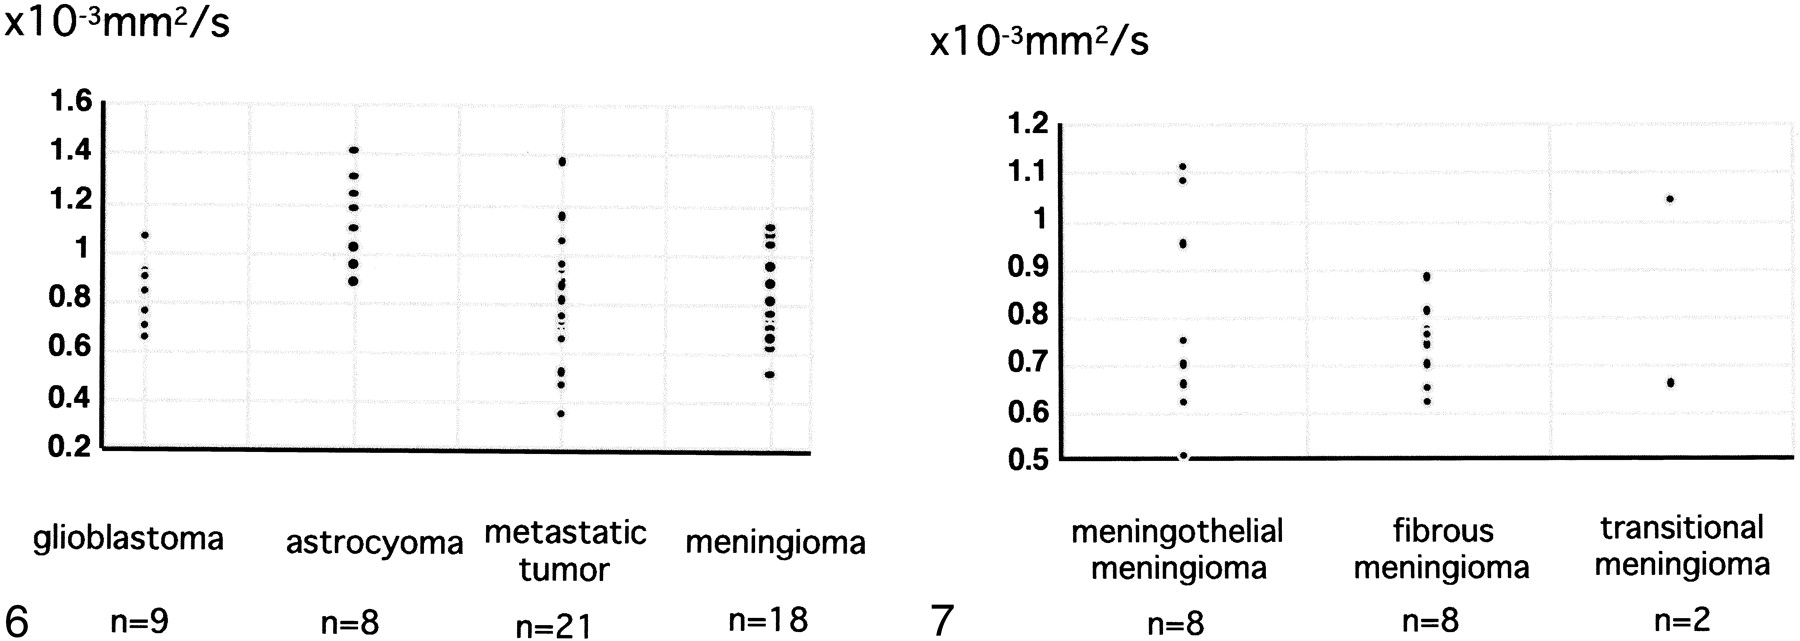
The ADCs of the tumors are shown in Figure 6. They ranged from 0.65 to 1.06 × 10⁻³ mm2/s (mean 0.82 ± 0.13 10−3 mm2/s) in nine patients with glioblastoma, from 0.88 to 1.41 × 10⁻³ mm2/s (1.14 ± 0.18 × 10⁻³ mm2/s) in eight patients with grade II astrocytoma, from 0.35 to 1.37 (0.79 ± 0.23 × 10⁻³ mm2/s) in 21 patients with metastatic tumor, and from 0.51 to 1.08 (0.78 ± 0.17 × 10⁻³ mm2/s) in 18 patients with meningioma. Among patients with astrocytic tumors, those with glioblastoma had lower ADC values than those with grade II astrocytoma (P = .0008). The ADC did not differ significantly between patients with glioblastomas versus metastatic tumors. Patients with meningiomas had a wide range of ADCs: from 0.51 to 1.11 × 10⁻³ mm2/s (0.80 ± 0.22 × 10⁻³ mm2/s) in eight patients with meningothelial meningioma, and 0.62 to 0.88 × 10⁻³ mm2/s (0.74 ± 0.08 × 10⁻³ mm2/s) in eight patients with fibrous meningioma, to 0.66 × 10⁻³ mm2/s and 1.04 × 10⁻³ mm2/s in 2 patients with transitional meningioma. For patients with meningioma, tumor histology (meningothelial meningioma, fibrous meningioma or transitional meningioma) did not correlate significantly with ADCs (Fig 7).
The ADCs in peritumoral, hyperintense areas on T2-weighted images ranged from 1.06 to 2.09 × 10⁻³ mm2/s (1.42 ± 0.32 × 10⁻³ mm2/s) in eight patients with glioblastoma, from 1.28 to 1.45 × 10⁻³ mm2/s (1.38 ± 0.07 × 10⁻³ mm2/s) in four patients with grade II astrocytoma, from 0.87 to 2.61 × 10⁻³ mm2/s (1.37 ± 0.41 × 10⁻³ mm2/s) in 19 patients with metastatic tumor, and from 1.05 to 1.88 × 10⁻³ mm2/s (1.36 ± 0.24) in 10 patients with meningioma. The ADC values for peritumoral edema did not differ significantly among patients with glioblastoma, grade II astrocytoma, metastatic tumor, or meningioma.
Signal Intensities of Tumor and Peritumoral Edema
Signal intensities on DWIs (b=1000) of tumor and peritumoral edema are shown in the Table. The signal intensities of tumor varied within each tumor group, and no significant difference was found in them among patients with glioblastoma (Fig 1), grade II astrocytoma (Fig 2), metastatic tumor (Fig 3), or meningioma (Figs 4 and 5). The signal intensity of peritumoral edema ranged from isointense to mildly or moderately hyperintense within each group, and no significant differences were noted among the groups.

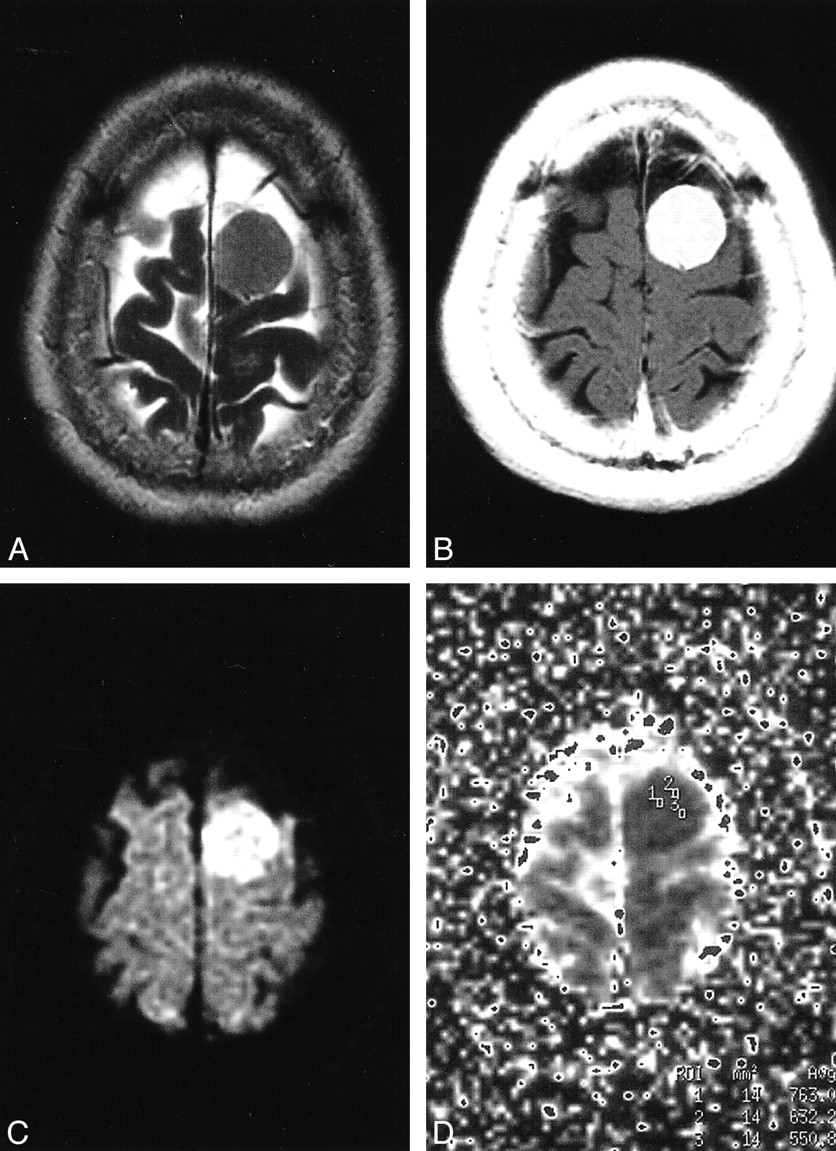
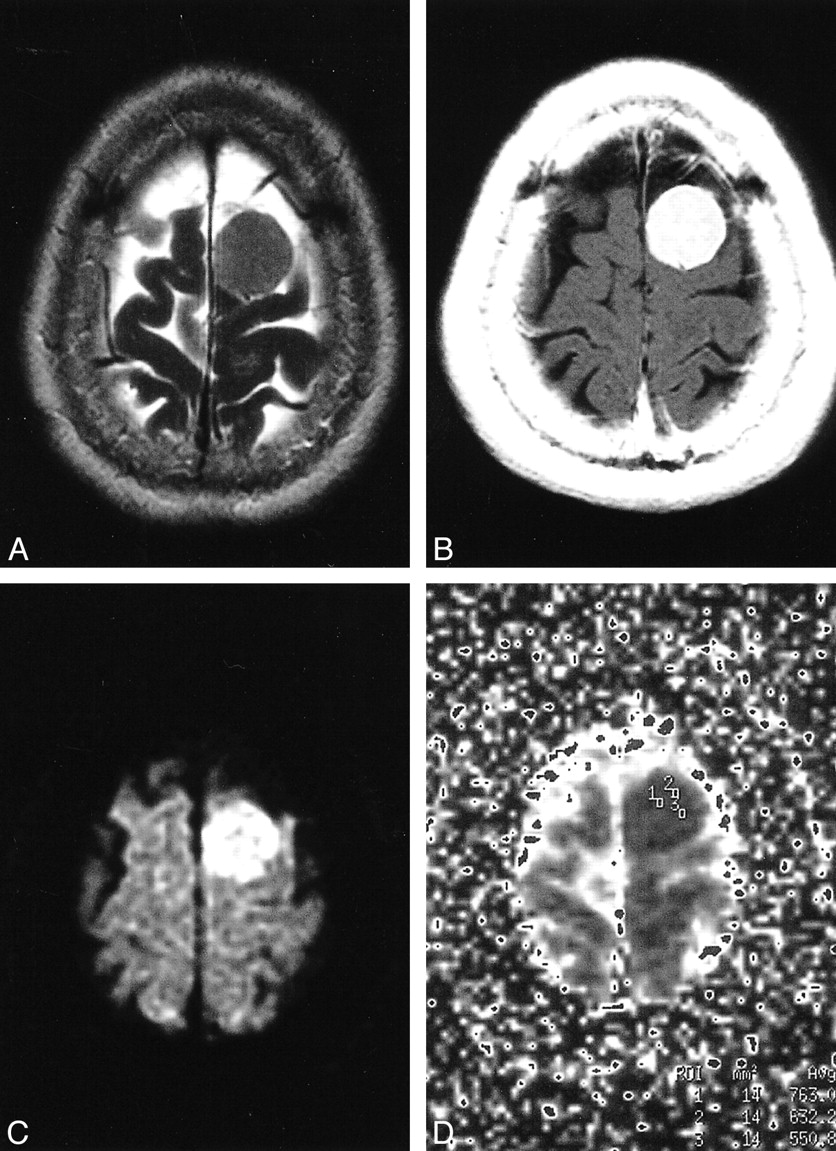
Grade II astrocytoma in the left insular portion.
A, Tumor shows high intensity on a T2-weighted image.
B, No enhancement is seen on a T2-weighted image.
C, On DWI, the tumor is isointense to mildly hyperintense.
D, On the ADC map, representative regions of interest are shown (small circles).
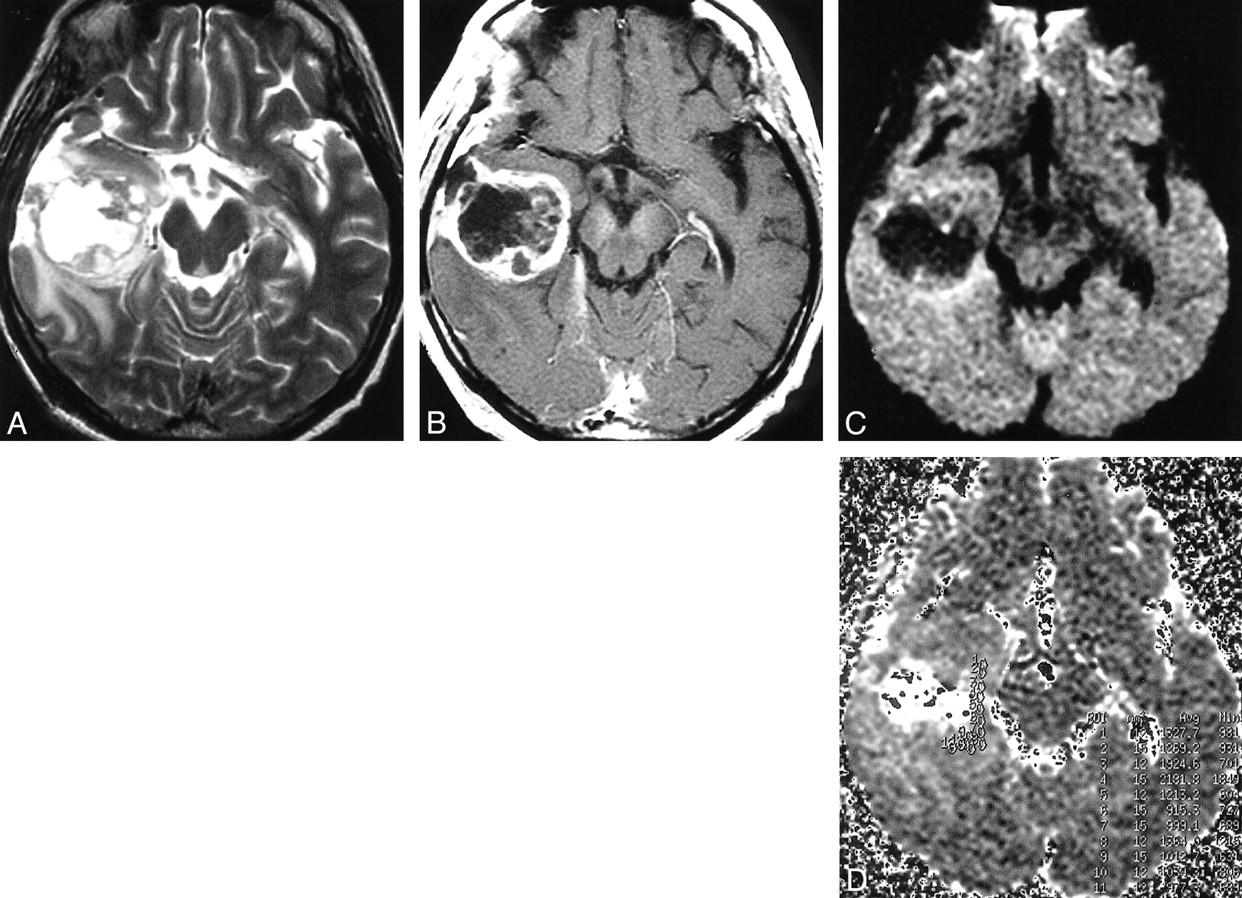
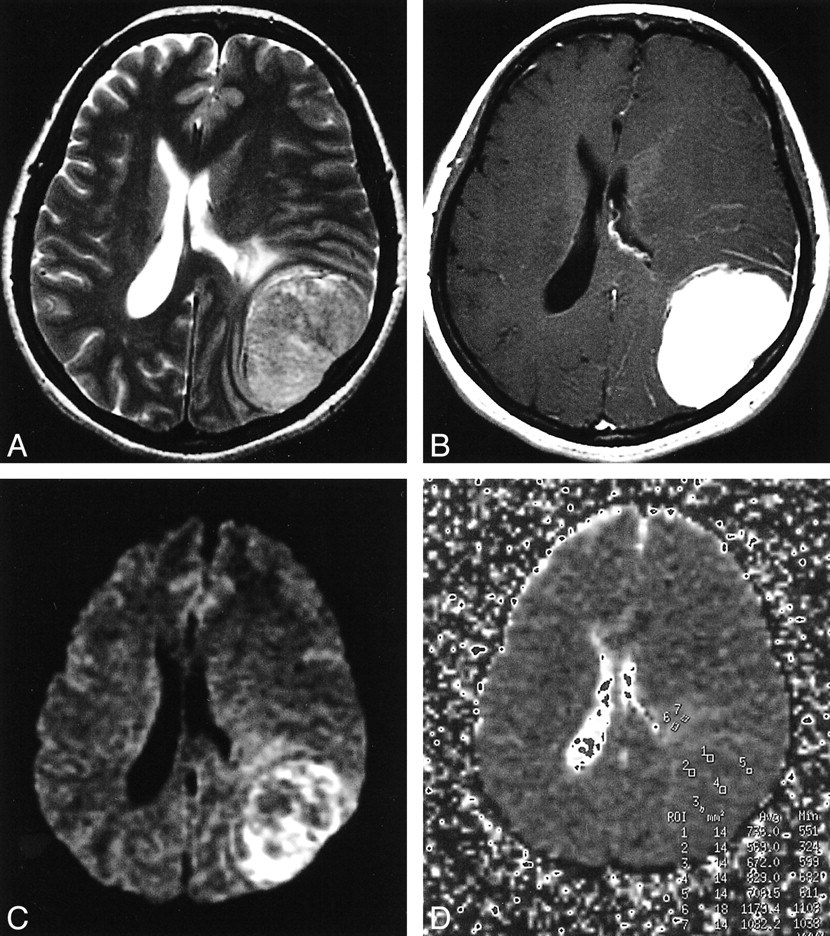
Tumor in the right occipital lobe, metastasized from the lung.
A, On a T2-weighted image, the solid portion of the tumor is mildly hyperintense, and peritumoral edema is present anterior to the tumor.
B, Tumor shows relatively homogeneous enhancement after injection of contrast medium.
C, On DWI, the solid portion of the tumor is isointense to mildly high in intensity.
D, Regions of interest are shown (small circles) on the ADC map. The ADC values are 0.80, 0.74, 0.68, and 0.67, and the averaged ADC value is 0.72. Apparent restricted diffusion (high signal) in the tumor periphery appears to reflect T2 shine-through effect, although peripheral high intensity is not seen on the T2-weighted image.
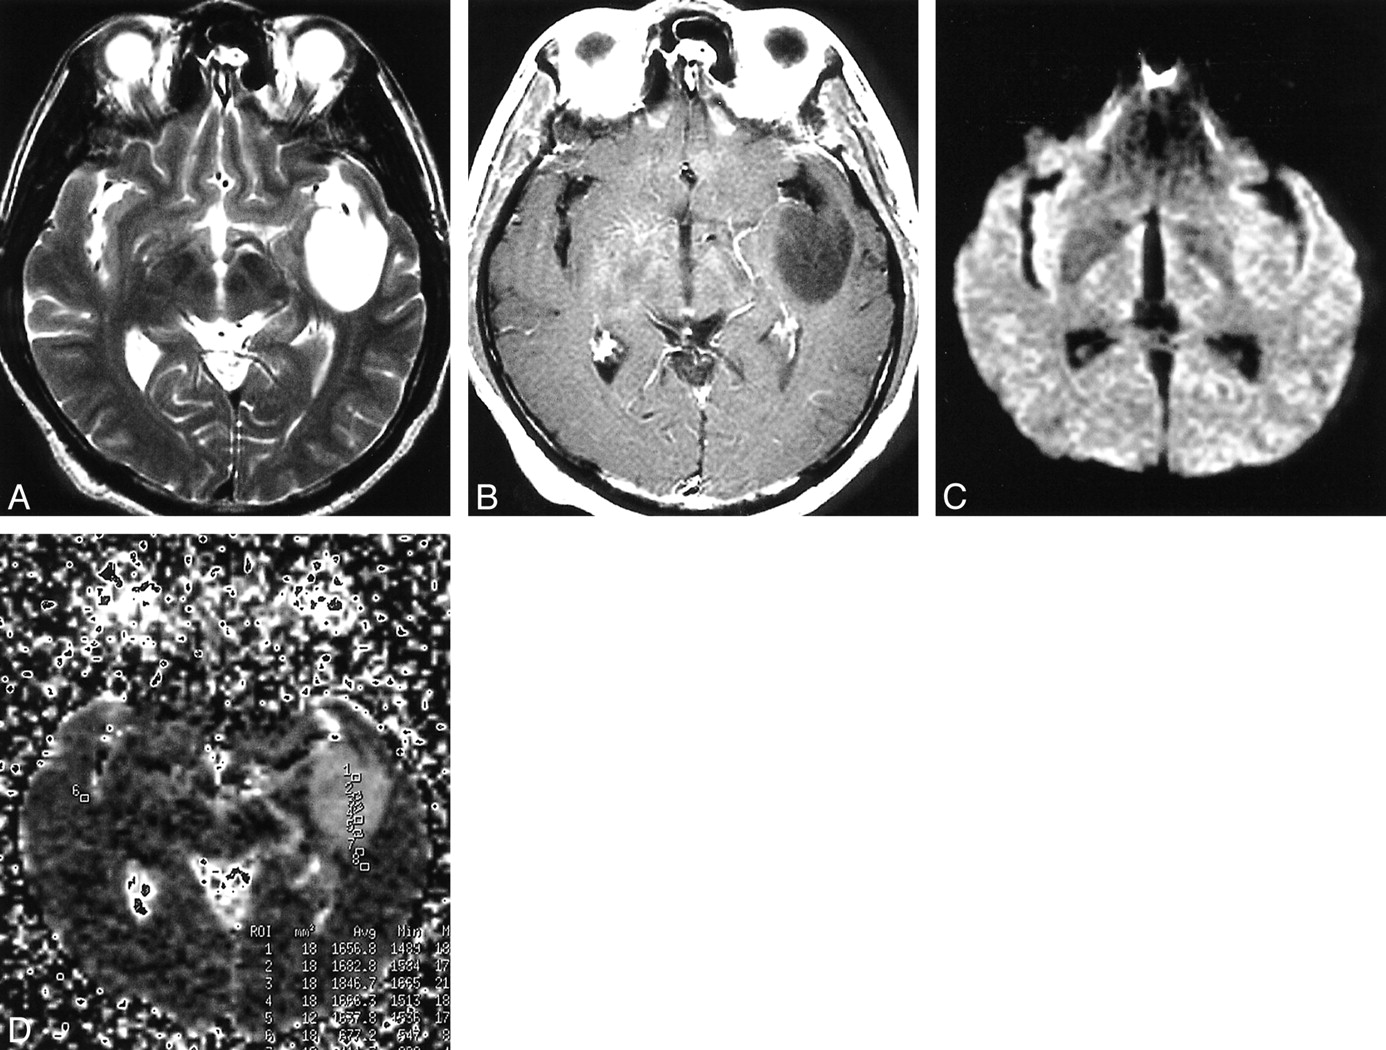
Meningothelial meningioma in the left high frontal convexity.
A, On a T2-weighted image, tumor is mildly high in intensity.
B, Tumor enhances homogeneously on a T2-weighted image.
C, The tumor is of high intensity on DWI.
D, Regions of interest are shown on the ADC map. The ADC values are 0.76, 0.63, and 0.55, and the averaged ADC value is 0.65. Restricted diffusion in the tumor probably is caused by high tumor cellularity.
Tumor Cellularity and Its Correlation with ADC
For astrocytic tumors, tumor cellularity ranged from 8.2–34.7% in patients with glioblastoma and was <15% in those with grade II astrocytoma. Tumor cellularity correlated relatively well with ADC for astrocytic tumors (r = –.77 [Fig 8]). Among patients with meningioma, tumor cellularity ranged from 2.3–25.9% in those with meningothelial meningioma and from 5.1–17.5% in those with fibrous meningioma and exhibited a relatively good correlation with ADC (r = –.67) (Fig 9), although not as good as for astrocytic tumor. Tumor cellularity of patients with metastases to the brain ranged from 15–27.1%. Because we had only three histologic specimens of metastases, insufficient for statistical analysis, we did not determine the correlation of ADC with tumor cellularity in these patients.

Fibrous meningioma in the left convexity.
A, On a T2-weighted image, tumor intensity is mildly high and edema is present anterior to the tumor.
B, The tumor enhances homogeneously.
C, On DWI, the peripheral portion of the tumor is moderately hyperintense and the central portion is isointense. Peritumoral edema is mildly high in intensity.
D, Regions of interest are shown on the ADC map. The ADC values are 0.83, 0.74, 0.71, 0.67, and 0.57, and the averaged ADC value is 0.70. Some areas of apparent restricted diffusion in the tumor probably reflect T2 shine-through effect, because ADC values in these areas are not low and the signals in those areas show high intensity on the T2-weighted image.

The ADCs of tumor for glioblastomas, grade II astrocytomas, metastatic tumors, and meningiomas. The ADCs of astrocytomas are higher than those of other tumors, while ADCs of glioblastomas are lower than those of grade II astrocytomas.fig 7. The ADCs of each histologic type of meningioma. No significant difference is present among histologic types

A correlation (r =−.77) is observed between tumor cellularity and ADC values of astrocytic tumors.fig 9. A correlation (r =−.67) is observed between tumor cellularity and ADC values of meningiomas
Discussion
MR diffusion imaging has been used to study water mobility in normal brain tissue (1, 2), cerebral infarction (2), multiple sclerosis (3), gliomas (4–8), and brain abscesses (8, 9) and to differentiate between arachnoid cysts and epidermoid cysts (10) and other diseases (7, 8, 13, 14). Gliomas are the most common brain tumors. On imaging studies, malignant gliomas usually are enhanced after intravenous contrast injection and show peritumoral edema, whereas, except for pilocytic astrocytoma and giant-cell astrocytoma, low-grade gliomas usually show little to no abnormal enhancement or peritumoral edema. Differentiation of these two types of tumors occasionally may be difficult, because low-grade astrocytomas also may show abnormal contrast enhancement and peritumoral edema. In fact, abnormal enhancement was noted in four of eight patients with grade II astrocytoma in our study, and peritumoral edema was found in four patients.
We found that ADC values cannot be used in individual cases to differentiate tumor types reliably. Although the ADCs of grade II astrocytoma and glioblastoma overlapped somewhat, the combination of routine image interpretation and ADC had a higher predictive value. Our results indicate that lower ADCs suggest malignant glioma, whereas higher ADCs suggest low-grade astrocytoma. These results agree with those of previous reports (8). Although no patients with anaplastic astrocytoma were included in our study, we expect that the ADCs of this type of tumor (a grade III astrocytoma) will be intermediate between those of glioblastoma and grade II astrocytoma. The ADC was not useful for differentiating one type of meningioma from another (Figs 4 and 5).
It would be of interest to determine which components of tumor histology contribute to the differences in ADCs, ie, tumor cellularity, tumor matrices, fibrous or gliotic tissues, or all of these. Among these, tumor cellularity is an important factor in determining tumor malignancy and can be analyzed objectively by specially designed software. The coefficient of correlation between tumor cellularity and ADC was −.77 for astrocytic tumors. Our observations are consistent with a previous study of tumor cellularity and grading of gliomas (5). In a similar manner, cellularity was analyzed in noncalcified meningiomas and exhibited a relatively good correlation with ADC, with a coefficient of −.67. We therefore believe that tumor cellularity is a major determinant of ADC values of brain tumors, although probably not the only one.
Malignant gliomas have neoplastic cells in the peritumoral edema (peritumoral, hyperintense areas on T2-weighted images; peritumoral, low-density areas on CT; or both). We hypothesized that DWIs or ADC values could delineate areas of neoplastic cell infiltration. Indeed, Tien et al (6) could distinguish areas of peritumoral, neoplastic cell infiltration from predominantly peritumoral edema when abnormalities were located in the white matter aligned in the direction of the diffusion-weighted gradient. Our findings do not support the hypothesis that peritumoral neoplastic cell infiltration can be depicted by ADCs or ADC maps, however. A drawback of our study is that biopsy of peritumoral edematous areas was not performed for histologic examination at surgery.
We also analyzed tumor cellularity, intensities on T2-weighted images, and ADCs of patients with meningioma. As noted above, tumor cellularity correlated relatively well with ADC, but no significant relationship was found between tumor ADC and histologic classification for meningioma.
Conclusion
In conclusion, ADC values cannot be used in individual cases to differentiate tumor types reliably. Although the ADCs of patients with grade II astrocytoma and glioblastoma overlapped somewhat, the combination of routine image interpretation and ADC had a higher predictive value. Our results do not support the hypothesis that DWIs or ADCs can distinguish neoplastic cell infiltration in peritumoral edema in patients with malignant glioma. The ADCs of glioma and meningioma are related to tumor cellularity. We believe that DWIs and ADCs can provide information useful to diagnose brain tumors that cannot be obtained with conventional MR imaging.
Acknowledgments
We acknowledge the support of Junji Shiraishi, Masako N. Hosono, Haruyuki Fukuda, and Naohiro Tsuyuguchi.
Footnotes
1 Address reprint requests to Kinuko Kono, MD, Department of Radiology, Izumi Osaka City University Medical School, 1-4-3 Asahicho Abeno-ku Osaka-shi 545-8585 Japan.
References
- Received July 11, 2000.
Signal intensities on DWI (b = 1000), by type of tumor
- Copyright © American Society of Neuroradiology
In this issue


Jump to section
Related Articles
Cited By...
- Enhanced computed tomography radiomics-based machine-learning methods for predicting the Fuhrman grades of renal clear cell carcinoma
- Dose-dependent degeneration of non-cancerous brain tissue in post-radiotherapy patients: A diffusion tensor imaging study
- Diffusion Basis Spectrum Imaging with Deep Neural Network Differentiates Distinct Histology in Pediatric Brain Tumors
- Non-Contrast-Enhancing Tumor: A New Frontier in Glioblastoma Research
- Whole-Tumor Histogram and Texture Analyses of DTI for Evaluation of IDH1-Mutation and 1p/19q-Codeletion Status in World Health Organization Grade II Gliomas
- A Multiparametric Model for Mapping Cellularity in Glioblastoma Using Radiographically Localized Biopsies
- Diagnostic Accuracy of T1-Weighted Dynamic Contrast-Enhanced-MRI and DWI-ADC for Differentiation of Glioblastoma and Primary CNS Lymphoma
- Improved Brain Tumor Classification by Sodium MR Imaging: Prediction of IDH Mutation Status and Tumor Progression
- MR Imaging-Based Analysis of Glioblastoma Multiforme: Estimation of IDH1 Mutation Status
- Multimodality Brain Tumor Imaging: MR Imaging, PET, and PET/MR Imaging
- Pretreatment Diagnosis of Suprasellar Papillary Craniopharyngioma and Germ Cell Tumors of Adult Patients
- A Prognostic Model Based on Preoperative MRI Predicts Overall Survival in Patients with Diffuse Gliomas
- Potential Role of Preoperative Conventional MRI Including Diffusion Measurements in Assessing Epidermal Growth Factor Receptor Gene Amplification Status in Patients with Glioblastoma
- "Dazed and diffused": making sense of diffusion abnormalities in neurologic pathologies
- Improved Conspicuity and Delineation of High-Grade Primary and Metastatic Brain Tumors Using "Restriction Spectrum Imaging": Quantitative Comparison with High B-Value DWI and ADC
- Imaging Characteristics of Oligodendrogliomas That Predict Grade
- The Added Value of Apparent Diffusion Coefficient to Cerebral Blood Volume in the Preoperative Grading of Diffuse Gliomas
- Methodology of diffusion-weighted, diffusion tensor and magnetisation transfer imaging
- Biology, genetics and imaging of glial cell tumours
- Apparent Diffusion and Fractional Anisotropy of Diffuse Intrinsic Brain Stem Gliomas
- Apparent Diffusion Coefficient of Glial Neoplasms: Correlation with Fluorodeoxyglucose-Positron-Emission Tomography and Gadolinium-Enhanced MR Imaging
- Distinguishing Recurrent Primary Brain Tumor from Radiation Injury: A Preliminary Study Using a Susceptibility-Weighted MR Imaging-Guided Apparent Diffusion Coefficient Analysis Strategy
- Candidate Biomarkers of Extravascular Extracellular Space: A Direct Comparison of Apparent Diffusion Coefficient and Dynamic Contrast-Enhanced MR Imaging--Derived Measurement of the Volume of the Extravascular Extracellular Space in Glioblastoma Multiforme
- MR Imaging of Orbital Inflammatory Syndrome, Orbital Cellulitis, and Orbital Lymphoid Lesions: The Role of Diffusion-Weighted Imaging
- Predicting response to breast cancer neoadjuvant chemotherapy using diffuse optical spectroscopy
- A review of structural magnetic resonance neuroimaging
- Effect of Region of Interest on Interobserver Variance in Apparent Diffusion Coefficient Measures