Fig 1.

Fig 1.
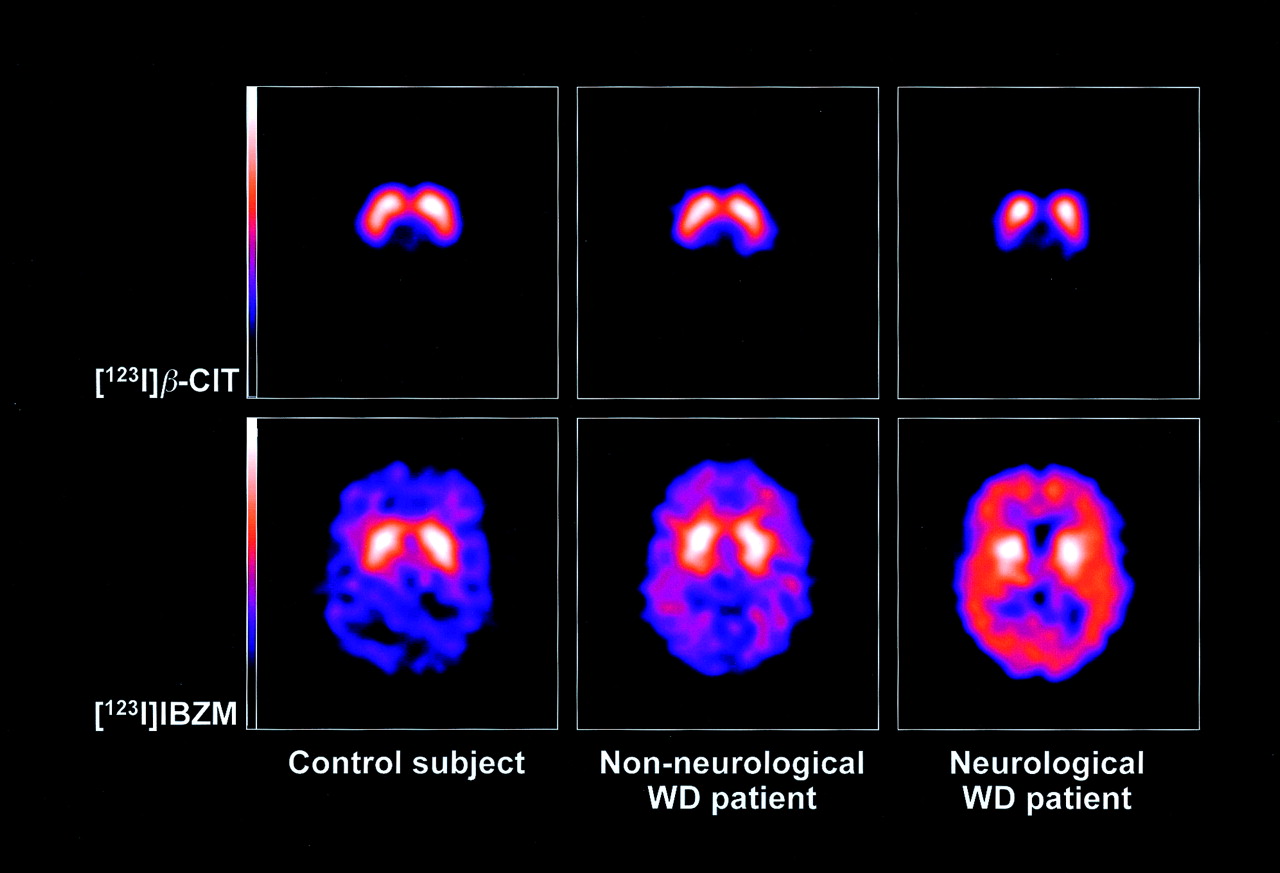
Typical examples of [123I]β-CIT (top row) and [123I]IBZM (bottom row) SPECT images in a subject from the control group (left), a non-neurologic WD patient (middle), and a neurologic WD patient (right). Transverse sections at the level of maximal diameter of the striatum are shown. No differences were noted between the control subject and the non-neurologic WD patient. In contrast, specific binding is reduced for both radiotracers in the striata of the neurologic WD patient.


