
Abstract
BACKGROUND AND PURPOSE: To our knowledge, inner structural alterations of the hippocampus have never been demonstrated because of the lack of contrast between the hippocampus proper and the superficial medullary lamina. We sought to demonstrate the anatomic details of the inner hippocampus and to elucidate its alterations in Alzheimer disease (AD) in vivo.
METHODS: We obtained multishot diffusion- and T2-weighted MR images in 14 healthy control subjects and 26 patients with mild or moderate AD (diagnosis based on Mini-Mental Status Examination scores). We measured the width of the subiculum, CA1 and CA3–4, and the height of CA3–4 on coronal images.
RESULTS: The subiculum and hippocampus proper were demonstrated as whirlpool-shaped hyperintense areas, and the superficial medullary lamina was visible as a hypointense structure along the inner margin of the hippocampus proper. Regarding the width of the subiculum and CA1, intergroup analysis revealed significant differences between the control and mild or moderate AD groups. In the width of CA3–4, we found no significant difference between the control and mild AD groups; however, differences between the control and moderate AD groups and between the mild and moderate AD groups were significant. In the height of CA3–4, we observed no significant differences between groups.
CONCLUSION: We clearly visualized the inner structure of the hippocampal formation by using multishot diffusion-weighted imaging. The subiculum and CA1 are the most vulnerable regions in AD, and atrophy of these structures was evident in both mild and moderate AD.
The diagnosis of mild Alzheimer disease (AD) is becoming increasingly important in aging societies, as therapies are now available to treat mild AD (1–3). In particular, the diagnosis of mild AD and indications for drug treatment have become important areas of investigation. Many studies of MR imaging have demonstrated that volumetric atrophy of the hippocampus is a sensitive indicator of AD (4–12). However, to our knowledge, the details of inner structural alterations of the hippocampal formation (the subiculum of the periallocortex, the hippocampus proper of the archicortex, and the superficial medullary lamina of the fiber bundles) have never been demonstrated because of the lack of contrast between the hippocampus proper (CA1–4 and dentate gyrus) and the superficial medullary lamina.
Recently, multishot diffusion-weighted imaging has become available for the precise depiction of nerve fibers (13–16). The aim of the present study was to demonstrate the anatomic details of the inner structures of the hippocampal formation and to elucidate the hippocampal alterations in vivo, particularly in mild AD, by using multishot diffusion-weighted imaging.
Methods
Subjects
This prospective study was approved by the ethics committee of our university. Before the MR examinations were performed, we excluded subjects younger than 50 years or older than 80 years. We confirmed that all healthy volunteers had no history of major psychiatric illness and that no volunteers or patients had the following: any episodes of head injury, dependency on illegal drugs, current alcohol abuse, cardiovascular risk factors, diabetes mellitus, or malignancy. Informed consent was obtained from each participant. Patients whose screening MR images revealed cerebral infarction, hydrocephalus, or overt brain atrophy due to Pick disease were excluded.
We examined 14 healthy volunteers as the control group (six men, eight women; age range, 54–74 years; mean age ± SD, 65.0 years ± 6.3) and 26 patients with AD. The patients had cognitive and memory impairments, and psychiatrists diagnosed their disease on the basis of the criteria established by the National Institute of Neurologic and Communicative Disorders and Stroke-Alzheimer Disease and Related Disorders Association (17). We assigned the patients with AD into mild AD and moderate AD groups. The mild AD group included 12 patients (four men, eight women; age range, 53–79 years; mean age, 67.9 years ± 7.1). Their Mini-Mental Status Examination (MMSE) scores, a practical method for grading the patient’s cognitive state (18), were 25 or more at the MR imaging examination. Their mean MMSE score was 25.8 ± 0.9 and ranged from 25 to 27. In this group, the mean duration of illness was 4.2 years ± 3.4, with a range of 1–10 years. The moderate AD group included 14 patients (three men, 11 women; age range, 55–78 years; mean age, 70.0 years ± 7.8). Their MMSE scores were less than 25 at the MR imaging examination, and they had a mean MMSE score of 16.5 ± 6.2, ranging from 6 to 23. Their mean duration of illness was 4.5 years ± 2.7, with a range of 2–11 years.
MR Imaging
MR studies were performed by using a 1.5-T superconducting system (Signa; GE Medical Systems, Milwaukee, WI). For evaluating the hippocampal formation, we obtained multishot diffusion- and T2-weighted images in coronal planes that were parallel to the floor of the fourth ventricle.
Multishot diffusion-weighted images were obtained by using spin-echo echo-planar imaging with a diffusion-sensitizing gradient in the anteroposterior direction. The images showed the superficial medullary lamina as a hypointense area and the hippocampus proper as a hyperintense area, because the superficial medullary lamina along the inner margin of the hippocampus proper included a lot of nerve fibers running in the anteroposterior direction (Fig 1)). The imaging parameters were as follows: TR/TE/NEX, 3000–4000/120/6; FOV, 18 × 18 cm; section thickness, 5 mm; section gap, 1 mm; matrix, 256 × 192; shots, 16; duration of the diffusion-sensitizing gradient pulses, 40 ms; diffusion-sensitizing gradient, 1.5 G/cm; gradient density factor, b = 825 s/mm2; and imaging time, 5–6 minutes by using a peripheral gate. Navigator echoes were not used. The b value of 825 s/mm2 used in this study was unusual. To obtain good contrast between the nerve fiber bundles and the surrounding brain tissues, we tried various b values ranging from 100 to 1500 s/mm2. We found that a b value at 825 s/mm2 provided the best contrast for visualizing the nerve fiber bundles (anterior commissure, corticospinal tract, and transverse pontine fibers).
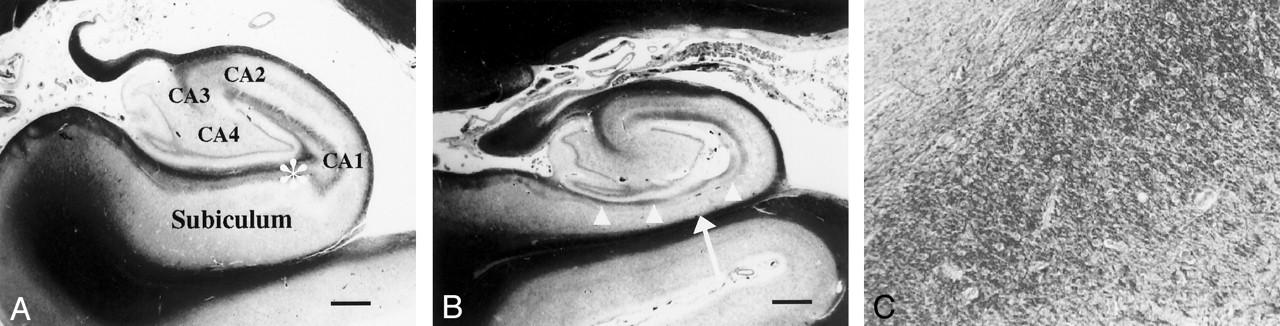
Coronal photomicrographs of normal and atrophic hippocampus (Klüver-Barrera stain).
A, Image in a 56-year-old man with dentatorubro-pallidoluysian atrophy shows no atrophy of the left subiculum or hippocampus proper. Image represents a normal hippocampus. The hippocampus proper consists of the CA1, CA2, CA3, and CA4 fields. Bar indicates 1 mm.
B, Image in a 78-year-old man with AD (duration of illness, 15 years) shows severe atrophy of the subiculum (arrow). The superficial medullary lamina (arrowheads) is thinner than that of a normal hippocampus. Bar indicates 1 mm.
C, Magnified (×200) view of the image in A shows numerous nerve fibers running in the anteroposterior direction in the superficial medullary lamina of the hippocampal formation.
T2-weighted images were obtained by using fast spin-echo imaging with the following parameters: TR/TE, 3540/105; FOV, 18 × 18 cm; section thickness, 5 mm; section gap, 1 mm; and matrix, 256 × 256.
Measurement of the Hippocampal Formation
Two radiologists (M.A., T.H.) who had no prior knowledge of the participants’ status as patients or control subjects independently measured the width of the subiculum of the periallocortex, the CA1 hippocampal field and CA3–4 field, and the height of the CA3–4 area of the hippocampal body (Fig 2). They respectively measured these areas two times by using a micrometer (minimum distance, 0.05 mm) on both multishot diffusion- and T2-weighted coronal images. These images were obtained 12 mm behind (second section from) the mammillary body and magnified to life size.

Schematic representation of the hippocampal formation shows the measurement points for the subiculum and the hippocampus proper. PHG indicates the parahippocampal gyrus.
The superficial medullary lamina was visualized as a hypointense area along the inner margin of the hippocampus proper on both multishot diffusion- and T2-weighted images acquired with a diffusion-sensitizing gradient in the anteroposterior direction. The width of the subiculum was determined as the width of the hyperintense band between the superficial medullary lamina and the white matter of the parahippocampal gyrus just below the midpoint of the width of CA3–4. The width of CA1 was determined as the width of the hippocampus proper with hyperintensity at the most lateral part. We then measured the width and height of the central high-intensity of the hippocampus proper as the width and height of CA3–4.
The readers could not always measure the dimensions of the inner structure on both sides. The coincident rates of the measurability between the two readers were calculated, after which, in respective parts of the hippocampal formation, we excluded data for statistical analyses unless both readers were able to measure both sides.
For each site, the averaged data on both sides were calculated for the first and second measurements of the two readers. Then, we calculated the mean dimensions between the first and second measurements, after which the averaged data of the two readers were used as the final data for statistical analyses.
Statistical Analysis
Before we compared the mean dimensions, the homogeneity of variance in patients’ ages was assessed by performing the Levene test. Parametric comparisons in age among groups in the measurement of various dimensions were performed by using a one-way analysis of variance (ANOVA).
To assess the intraobserver and interobserver variability error, the coefficient of variation CV% was calculated as follows: CV% = 100(SDdimension/Meandimension).
We also compared the dimensions of the inner hippocampal structure. For multiple group comparisons, homogeneity of variance was assessed by using the Levene test. We used one-way ANOVA to test for overall differences among groups, followed by the Tukey honestly significant difference adjustment to compare the separate group means. Statistical significance was established at the P < .05 level.
Results
Appearance of the Hippocampal Formation
For the visualization of the inner structure of the hippocampal formation, multishot diffusion-weighted imaging was superior to T2-weighted imaging. We found that multishot diffusion-weighted imaging offered good contrast between the hippocampus proper and the superficial medullary lamina. On multishot diffusion-weighted images, the subiculum and the hippocampus proper were demonstrated as hyperintense areas, and the superficial medullary lamina was seen as a hypointense area, resulting in a snail shell-like appearance of the hippocampal formation (Fig 3). However, the dentate gyrus could not be distinguished from CA4. CA2, the narrowest part of the hippocampus proper, was also difficult to visualize.
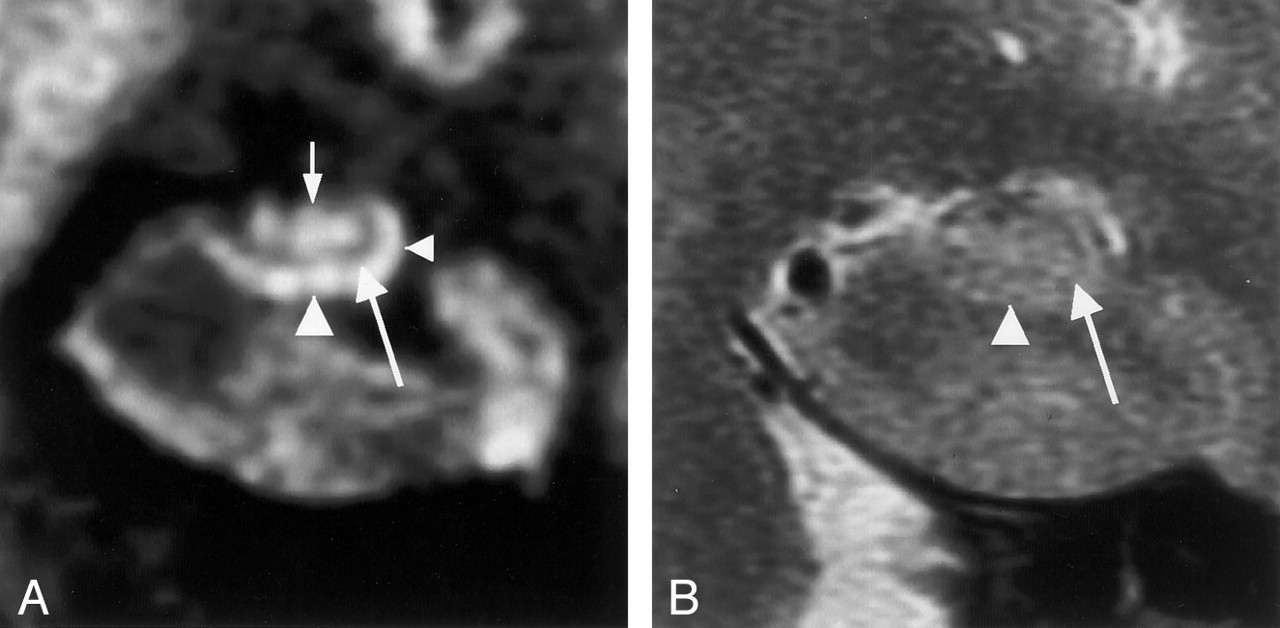
Coronal MR images in a 59-year-old man (control subject).
A, Multishot diffusion-weighted image clearly shows the inner structure of the left hippocampus. The subiculum (left arrowhead), CA1 of the hippocampus proper (right arrowhead), and CA3–4 (top arrow) are demonstrated as hyperintense areas, and the superficial medullary lamina (bottom arrow) is shown as a hypointense area.
B, T2-weighted image faintly shows the subiculum (arrowhead), the hippocampus proper, and the superficial medullary lamina (arrow).
Measurability of Dimensions
In the measurement of the various dimensions, no significant differences were observed in the mean age among the groups, as determined with one-wayANOVA. Measurability was remarkably higher with the multishot diffusion-weighted images than with the T2-weighted images. Table 1 shows the number of cases in which both readers could measure the dimensions of the bilateral hippocampal formation. According to the study design, only the data from these cases were analyzed. The dimensions of the subiculum and hippocampus proper were difficult to measure on T2-weighted images, whereas they were measurable on multishot diffusion-weighted images in all control subjects. In the patients with AD, the measurability decreased as their disease progressed. There were six patients—two with mild AD and four with moderate AD—in whom both readers could not measure at least one dimension in the bilateral hippocampal formation.
Number of Cases in Which Each Part of the Hippocampal Formation Was Measurable
The measurability of the two readers coincided well. With the multishot diffusion-weighted images in the control group, the coincident rates of the measurability between the two readers were 100% (28 of 28) in each part. In the mild AD group, these rates were 86% (21 of 24) for the width of the subiculum, 96% (23 of 24) for the width of CA1, 96% (23 of 24) for the width of CA3–4, and 92% (22 of 24) for the height of CA3–4. In the moderate AD group, these rates were 89% (25 of 28), 96% (27 of 28), 96% (27 of 28), and 93% (26 of 28), respectively.
Interobserver and Interobserver Variability
The coefficient of variation does not measure the correctness of measurements, only the change in the dimensions of objects in measurements of different readers. The mean intraobserver and interobserver variability for measurements is shown in Table 2. For both readers, the overall mean intraobserver variability for each measurement site was less than 10%. The mean interobserver variability was also less than 10% for each site.
Intraobserver and Interobserver Variability
Atrophy of the Inner Hippocampal Structure in AD
Visually, partial atrophy of the hippocampal formation was recognized with multishot diffusion-weighted images but not with T2-weighted images (Figs 4–7). The atrophy of the subiculum and CA1 was observed in both mild and moderate AD. With disease progression, the width of CA3–4 decreased (Figs 4–7).

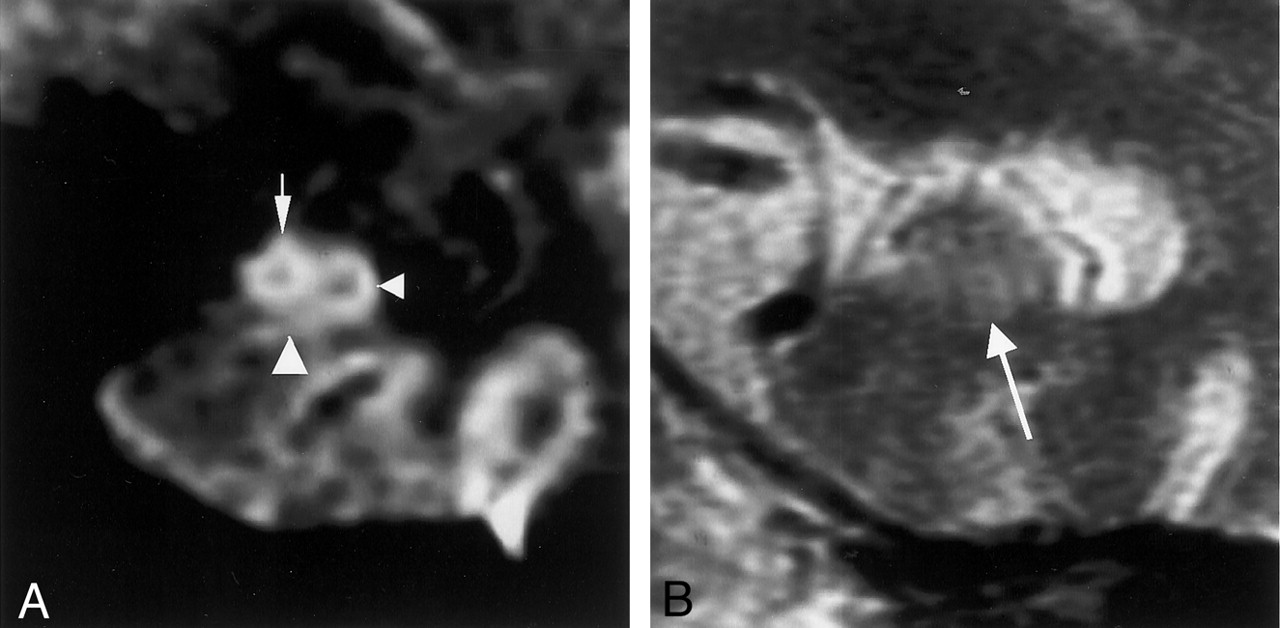
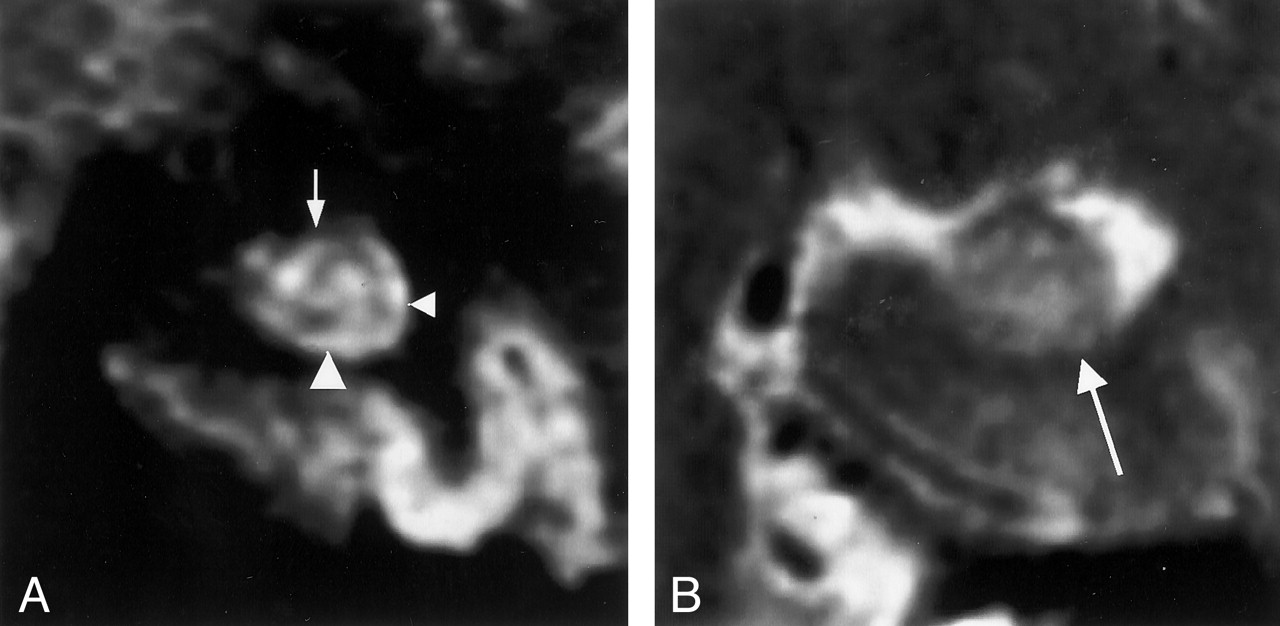
MR images in a 71-year-old woman with mild AD (MMSE score, 27; duration of illness, 2 years).
A, Multishot diffusion-weighted coronal image shows atrophic subiculum (left arrowhead) and CA1 (right arrowhead). However, the CA3–4 (arrow) is spared.
B, T2-weighted image scarcely demonstrates the inner structure of the left hippocampus (arrow).

MR images in a 68-year-old man with mild AD (MMSE score, 25; duration of illness, 3 years).
A, Multishot diffusion-weighted coronal image shows an atrophic subiculum (left arrowhead) and CA1 (right arrowhead). CA3–4 (arrow) is spared.
B, T2-weighted image scarcely demonstrates the inner structure of the left hippocampus (arrow).
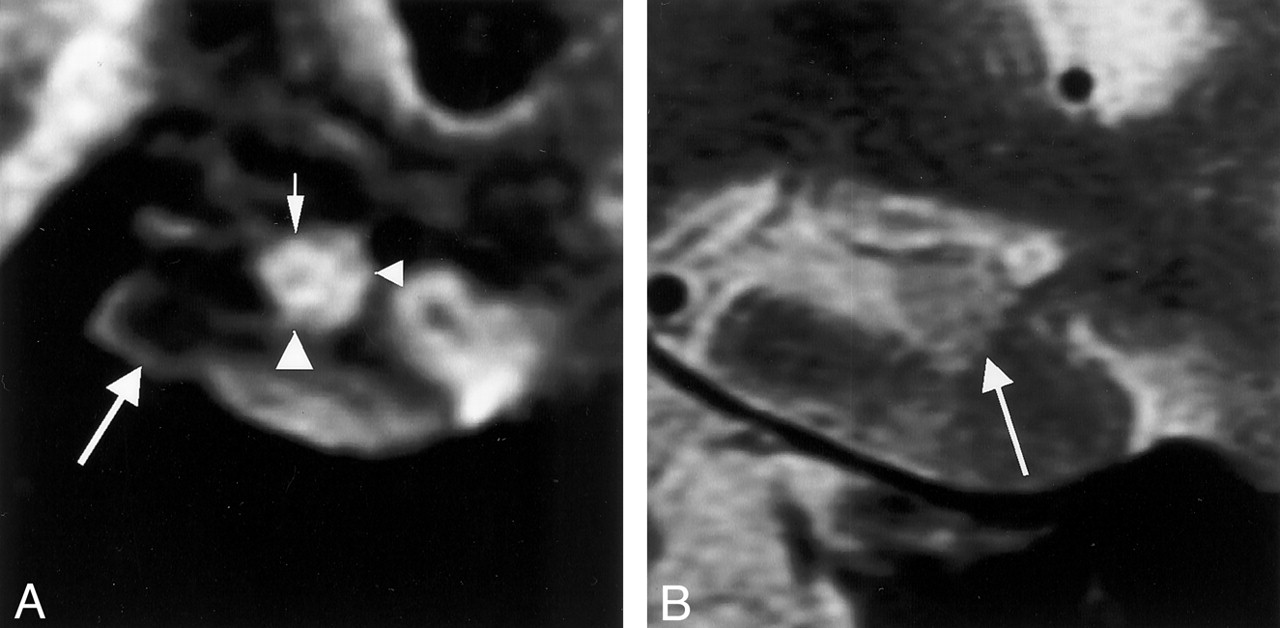
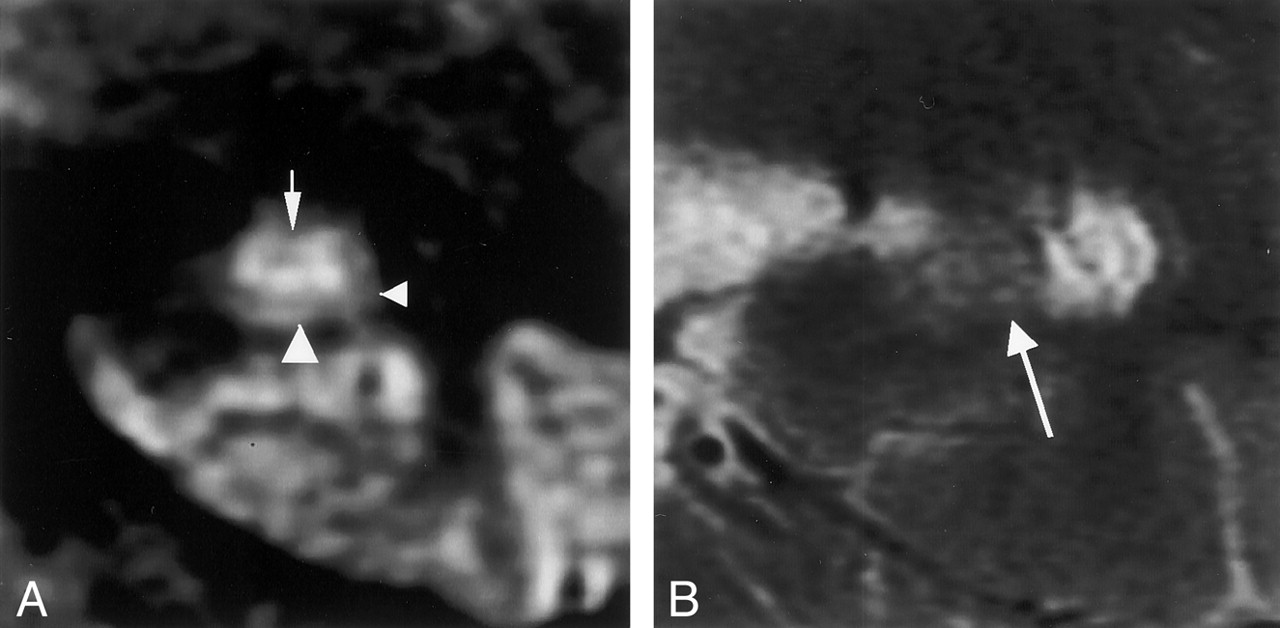
MR images in a 64-year-old woman with moderate AD (MMSE score, 8; duration of illness, 12 years).
A, Multishot diffusion-weighted coronal image shows an atrophic subiculum (left arrowhead). CA1 (right arrowhead) is comparatively spared; however, CA3–4 (arrow) is atrophic.
B, T2-weighted image scarcely demonstrates the inner structure of the left hippocampus (arrow).
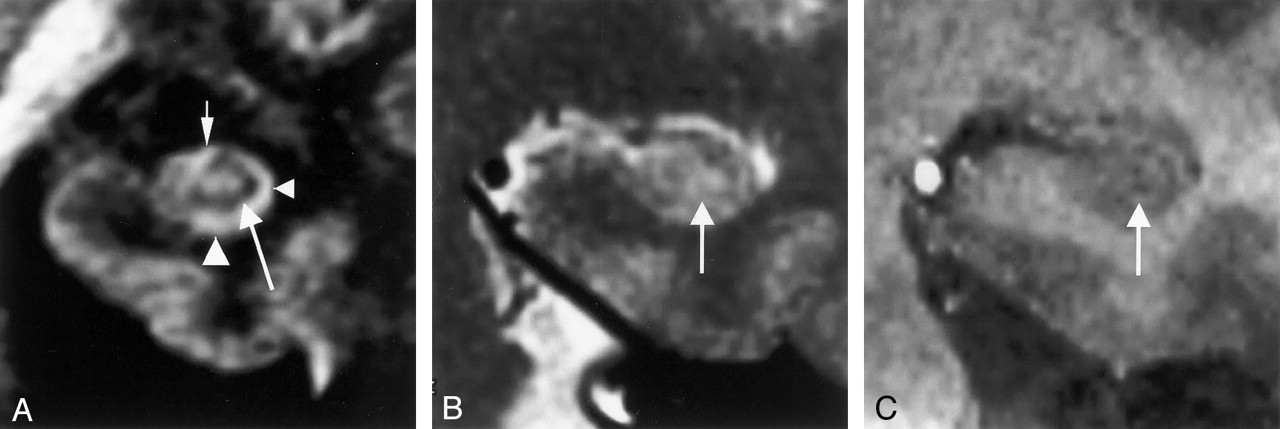
MR images in a 71-year-old woman with moderate AD (MMSE score, 6; duration of illness, 11 years).
A, Multishot diffusion-weighted coronal image shows severe atrophy of the subiculum (left arrowhead) and CA3–4 (small arrow). Atrophy of CA1 (right arrowhead) is mild. Image also shows atrophy of the parahippocampal gyrus (large arrow).
B, T2-weighted image barely shows the inner structure of the hippocampus (arrow).
The mean width of the subiculum, CA1 and CA3–4, and the height of CA3–4 on multishot diffusion-weighted images are shown in Table 3. The Levene test for assessing homogeneity of variance among the three groups revealed no significant differences in dimensions in any part of the hippocampal formation. One-way ANOVA revealed significant differences among the three groups in the dimensions of the width of the subiculum (P < .001), CA1 (P < .001), and CA3–4 (P < .001). However, we found no significant difference in the dimension of the height of CA3–4 (P = .915).
Mean Dimensions of Hippocampal Inner Structures in Each Group
The intergroup analysis performed with the Tukey honestly significant difference adjustment indicated significant differences in the width of the subiculum between the control group and the mild AD groups (P < .001) or between the control group and the moderate AD group (P < .001). In the width of CA1, the intergroup analysis also indicated significant differences between the control group and the mild AD groups (P < .001) and between the control group and the moderate AD groups (P < .001). In the width of CA3–4, the test showed no significant difference between the control and mild AD groups (P = .117); however, we observed significant differences between the control and moderate AD groups (P < .001) and between the mild AD and moderate AD groups (P = .025). In the height of CA3–4, differences between groups were not significant (Table 4).
Intergroup Analyses of the Mean Dimensions of the Inner Hippocampal Structures
Discussion
In this pilot study, we succeeded in determining the inner structure of the hippocampal formation in vivo by using multishot diffusion-weighted MR imaging. To our knowledge, no previous report has demonstrated alterations in the inner structure of the hippocampal formation in AD, although many groups have evaluated the volume of the hippocampal formation (4–12). Diffusion-weighted imaging was developed to measure water diffusion movement (19), and it is known to be suitable for depicting nerve fiber bundles (13–16). Photomicrographs showed that the superficial medullary lamina comprised numerous nerve fibers running in the anteroposterior direction (Fig 1). Using multishot diffusion-weighted imaging with a diffusion-sensitizing gradient in the anteroposterior direction, we succeeded in demonstrating the superficial medullary lamina as a hypointense area. Thus, the convoluted appearance of the hippocampal formation was clearly visible in all healthy control subjects, although we were unable to distinguish the dentate gyrus and CA4.
The measurability of the inner structure of the hippocampal formation was superior on multishot diffusion-weighted images compared with that on T2-weighted images. Even in patients with AD, the hippocampal formation was well depicted on multishot diffusion-weighted images. However, visualization of the superficial medullary lamina decreased somewhat in AD, especially in the moderate AD group. The pathologic findings in AD (20–23) suggest that poor visualization of the superficial medullary lamina consisting of the perforant pathway is due to severe degeneration, a characteristic feature in AD (Fig 1). Therefore, poor visualization of inner hippocampal inner structures itself might be a finding suggestive of AD. Indeed, all cases in which the inner hippocampal structures could not be measured in every part involved AD.
The measurements of the inner hippocampal structures demonstrated that atrophy of the subiculum and CA1 is a statistically significant finding in mild AD and in moderate AD; with disease progression, the width of CA3–4 decreased. Furthermore, shrinkage of the height of CA3–4 was not seen. This atrophic pattern of the hippocampal formation in patients with AD is compatible with the pathologic characteristics of the hippocampal formation in AD (20–26). The subiculum (prosubiculum) and CA1 might be the most vulnerable regions of the hippocampal formation in AD, and their atrophy might be explained by the secondary change after degeneration of the superficial medullary lamina occurs. Results of pathologic studies have already suggested these hypotheses (20–23).
Coronal T1-weighted 3D volumetric spoiled gradient-recalled acquisition (SPGR) sequences have been widely used for high-resolution anatomic delineation of the hippocampal complex (9–12). However, the atrophic process of the hippocampal inner structures in AD has not been previously documented. In our experience, SPGR coronal images can demonstrate the borders between the subiculum and the white matter of the parahippocampal gyrus and between the inferior horn of the lateral ventricle and the hippocampal formation (Fig 8). However, with an SPGR sequence, which does not provide sufficient contrast between the gray matter and the white matter, distinguishing the superficial medullary lamina from the subiculum and hippocampus proper in the hippocampal formation is difficult. A T2-weighted sequence might demonstrate this contrast better than an SPGR sequence (Fig 8). For this reason, we used a fast spin-echo T2-weighted sequence as a comparison for multishot diffusion-weighted imaging. Although many authors have found significant differences between control subjects and patients with mild AD when they assessed the volume of the hippocampal formation with SPGR or thin T1-weighted images (4–12), SPGR images may not be able to show partial atrophy in the hippocampal formation. In a recent article (27), investigators reported that a short-inversion time inversion-recovery (STIR) sequence offers good gray matter-white matter contrast. Although the authors used this sequence to demonstrate the substantia nigra in the midbrain of patients with Parkinson disease, this imaging method might also be useful for visualizing the inner structure of the hippocampal formation.

MR images in a 45-year-old man (control subject).
A, Multishot diffusion-weighted coronal image clearly shows the inner structure of the left hippocampus: the subiculum (left arrowhead), CA1 of the hippocampus proper (right arrowhead), CA3–4 (small arrow), and the superficial medullary lamina (large arrow).
B, T2-weighted coronal image faintly shows the superficial medullary lamina (arrow) as a hypointense area.
C, T1-weighted 3D volumetric SPGR image (26/4.3; FOV, 18 cm; matrix, 256 × 256; thickness, 0.8 mm; slab, 64 mm) shows the superficial medullary lamina (arrow) as a hyperintense area and depicts it more faintly than does the T2-weighted image.
To our knowledge, this is the first report presenting the atrophic process of the inner hippocampal structures in AD in an in vivo study. Multishot diffusion-weighted imaging can depict partial atrophy of the hippocampal formation in AD. We also confirmed the statistical differences between control subjects and patients with mild AD. This imaging method should provide further important clues for the diagnosis of mild AD, and it is potentially useful in screening during the prodromal stage of AD.
Conclusion
We clearly visualized the inner structure of the hippocampal formation by using multishot diffusion-weighted imaging. The subiculum and CA1 are the most vulnerable regions in AD, and multishot diffusion-weighted imaging showed atrophy in these regions in mild AD.
References
- Received December 23, 2002.
- Accepted after revision March 25, 2003.
- Copyright © American Society of Neuroradiology
In this issue


Jump to section
Related Articles
Cited By...
- A Large-scale Comparison of Cortical and Subcortical Structural Segmentation Methods in Alzheimers Disease: a Statistical Approach
- Human anterolateral entorhinal cortex volumes are associated with preclinical cognitive decline
- Hippocampal Subfield Volumetry and 3D Surface Mapping in Subjective Cognitive Decline
- Shared Vulnerability of Two Synaptically-Connected Medial Temporal Lobe Areas to Age and Cognitive Decline: A Seven Tesla Magnetic Resonance Imaging Study
- Hippocampal CA1 apical neuropil atrophy in mild Alzheimer disease visualized with 7-T MRI
- Diffusion Tensor Microscopy Indicates the Cytoarchitectural Basis for Diffusion Anisotropy in the Human Hippocampus