Fig 3.
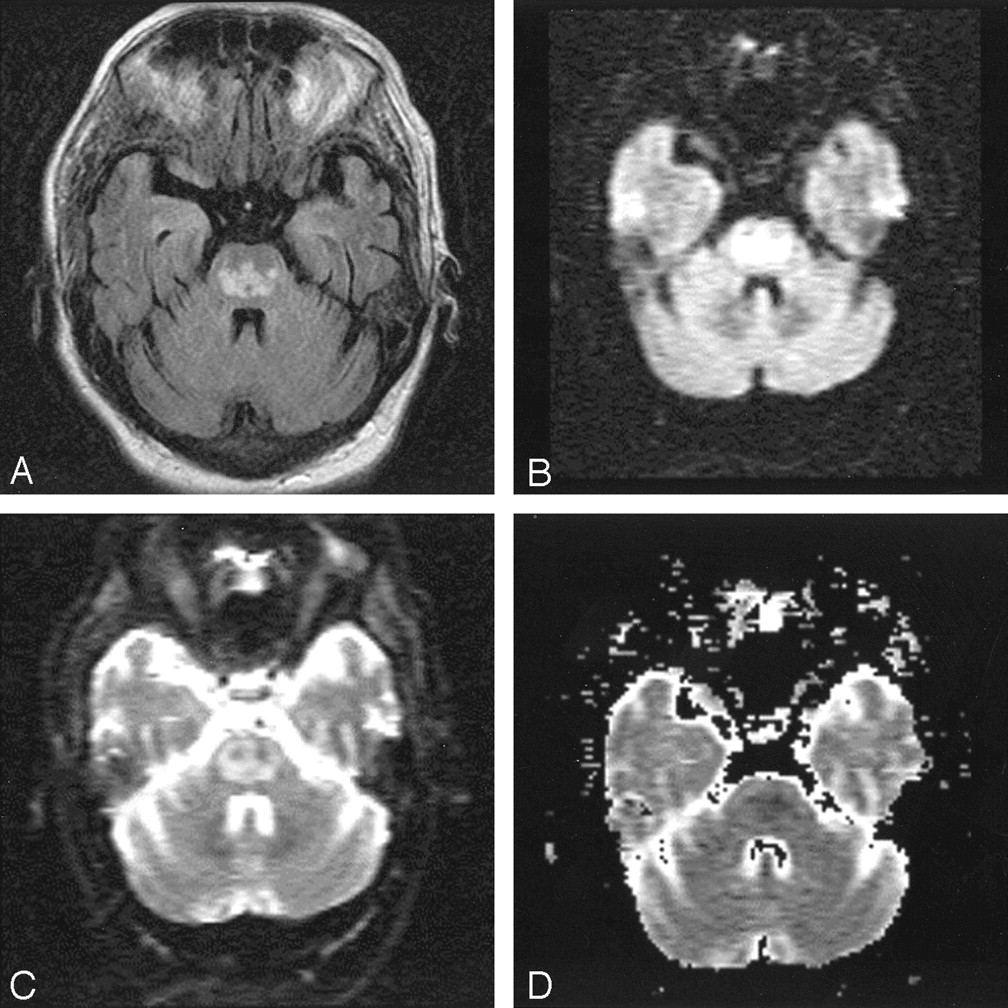
Fig 3.
MR images of the patient’s head, obtained on hospital day 17, 3 days after renormalization of overcorrected hypernatremia.
A, FLAIR image now demonstrates the classic trident-shaped pontine signal intensity abnormality.
B, The extent of DWI signal intensity abnormality in the pons has also become more extensive, assuming a trident-shape.
C, The b = 0 image has also become abnormal in the interim.
D, The ADC map again shows that the high DWI signal intensity corresponds to restricted diffusion (see Figure 1).


Related Articles
Cited By...
- Potentially Reversible and Recognizable Acute Encephalopathic Syndromes: Disease Categorization and MRI Appearances
- Treatment response in osmotic demyelination syndrome presenting as severe parkinsonism, ptosis and gaze palsy
- Response to IV immunoglobulin in a case of osmotic demyelination syndrome
- What to see when you are looking at confusion: a review of the neuroimaging of acute encephalopathy
- "Dazed and diffused": making sense of diffusion abnormalities in neurologic pathologies
- An unusual case of quadriparesis
- Isolated extra pontine myelinolysis presenting as acute onset parkinsonism
- Imaging evaluation of demyelinating processes of the central nervous system
- A trident in the brain, central pontine myelinolysis
- Central pontine myelinolysis in a case of cerebral malaria