Fig 2.

Fig 2.
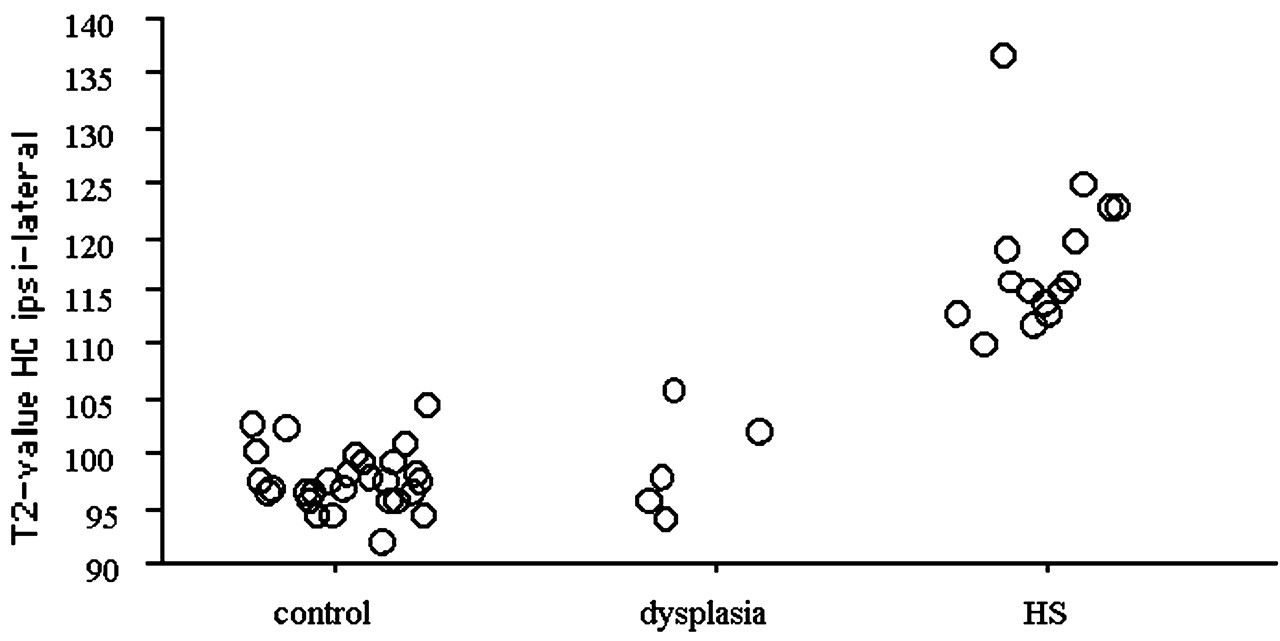
Distribution of the ipsilateral hippocampal T2 values for control volunteers, patients with focal cortical dysplasia, and patients with hippocampal sclerosis. Note the marked signal intensity increase for all patients with hippocampal sclerosis.


