Fig 5.
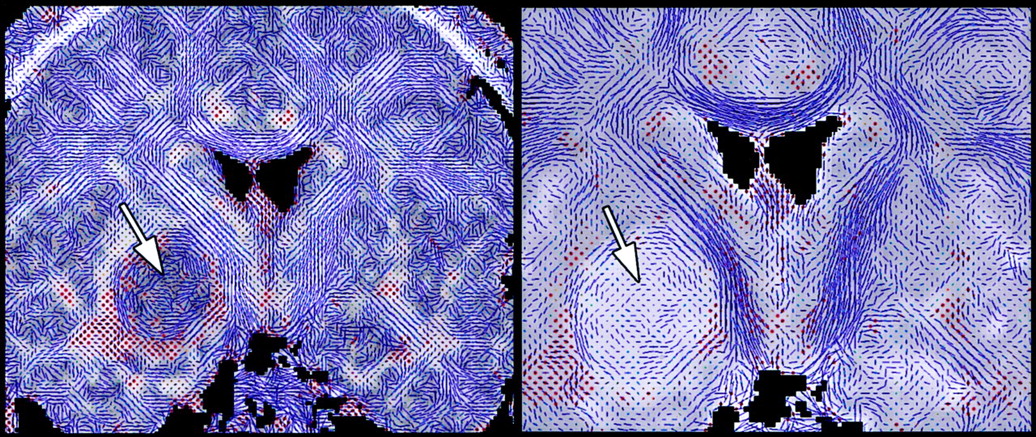
Fig 5.
Visualization of DT map of a brain tumor. Left panel shows whole brain DT imaging map overlaid on an FA map, and the right panel demonstrates the magnified DT map of the tumor with mean ADC map as background. Except for the medial tumor margin, the tumor area shows high diffusivity and low anisotropy.


Related Articles
Cited By...
- Monosynaptically-interconnected Network Module (MNM) Approach for High-Resolution Brain Sub-Network Analysis
- Reduced Structural Connectivity Between Left Auditory Thalamus and the Motion-Sensitive Planum Temporale in Developmental Dyslexia
- Structural and Functional Brain Networks: From Connections to Cognition