Fig 1.
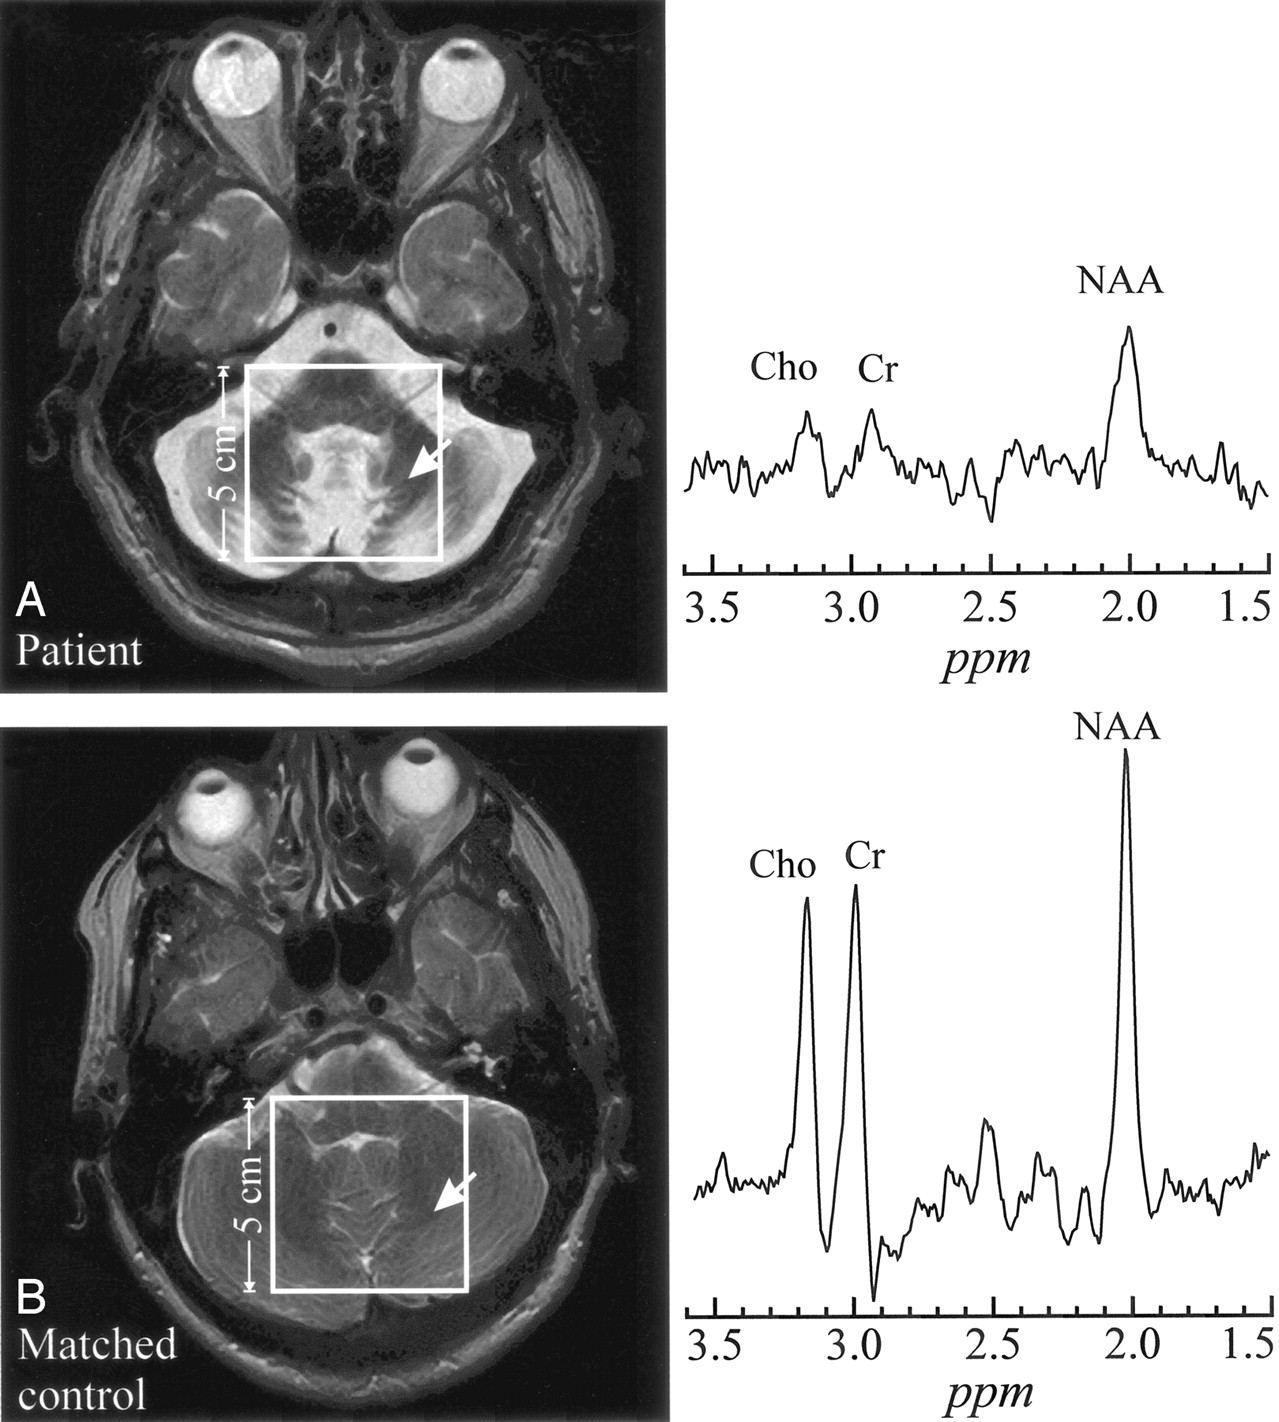
Fig 1.
A, top left, Axial T2-weighted image from a 54-year-old late-onset GM2G patient superimposed with the 5 × 5 cm2 VOI. Right, 1H spectrum from the cerebellum (arrow).
B, bottom left, Corresponding section from a 52-year-old healthy control superimposed with the 5 × 5 cm2 VOI. Right, Arrow indicates analogous region for metabolite comparison. Both spectra are on the same scale. Note the dramatic atrophy of the cerebellar folia and vermis in the patient and consequent lower metabolites levels reflecting larger partial CSF volume contamination.


