
Abstract
BACKGROUND AND PURPOSE: The purpose of this study was to evaluate the clinical usefulness of diffusion tensor MR imaging (DTI) for the assessment of chronic stroke with crossed cerebellar diaschisis (CCD).
METHODS: Twenty-two patients (15 men and 7 women; mean age, 60 years) with chronic stroke (13 ischemic and 9 hemorrhagic) were evaluated by diffusion-tensor MR imaging (DTI) and 18F-fluorodeoxyglucose (FDG)-positron-emission tomography (PET). Fractional anisotropy (FA) and color-coded vector maps were generated. To evaluate afferent fiber systems to the cerebellum, the FA of the bilateral middle cerebellar peduncle (MCP) was measured. Changes of FA values in the MCP were compared against PET results.
RESULTS: In patients with a chronic infarct involving more than one-third of the unilateral hemisphere, MCP of the contralesional side showed an FA value of 0.5226 ± 0.0174, which was significantly lower than that of the ipsilesional side MCP (0.5366 ± 0.0159) (one-tail paired t test, P = .0009). On FDG-PET scan, decreased glucose metabolism was observed in the affected cerebellum in 19 patients (86.4%).
CONCLUSION: DTI can visualize an altered corticocerebellar circuit in the case of chronic stroke with CCD, which is hardly demonstrated by conventional MR images.
Diaschisis is a functional impairment in an area remote from the site of a brain lesion, which is anatomically connected by fiber tracts (1, 2). Crossed cerebellar diaschisis (CCD) is a well-recognized phenomenon, and implies functional reduction of the cerebellar hemisphere following contralateral cerebral infarct. This phenomenon is often assessed in images obtained by single-photon emission CT (SPECT) and positron-emission tomography (PET), because the affected cerebellum shows decreased blood flow and metabolic activity (2–5).
The mechanism of CCD reportedly consists of an interruption of the cerebropontocerebellar pathway that causes deafferentation and transneural metabolic depression of the contralateral cerebellar hemisphere (1–3). Moreover, CCD is considered to lie between early, potentially reversible, functional hypometabolism and irreversible degeneration (2, 4, 5). For these reasons, the morphologic changes of the affected cerebellar hemisphere in patients with chronic stroke have also been studied (6–8). Nevertheless, the phenomenon is hardly demonstrated by conventional MR imaging in the early phase of CCD, regardless of a significant functional reduction in the affected cerebellum on the scintigraphic studies.
Recently introduced diffusion-tensor imaging (DTI) has a powerful ability to demonstrate altered white matter fiber integrity, and its clinical feasibility has been demonstrated in the evaluation of various brain pathologies such as stroke, tumor, congenital migration anomaly, diffuse axonal injury, and inherited/acquired white matter disease (9–19). In these studies, the basic hypothesis was that so-called normal-appearing white matter, which shows invisible abnormality on conventional MR imaging, gives low fractional anisotropy (FA) value in comparison to normal white matter. The aim of this study was to use DTI to demonstrate FA changes in the corticocerebellar circuit of patients with chronic stroke before structural alteration and evaluate the utility of applying DTI to the assessment of crossed cerebellar diaschisis.
Methods
Patient Selection
Twenty-two patients with chronic hemispheric strokes of different severity, leading to infarcts within the territories of the middle cerebral artery to a variable degree, were evaluated by DTI and 18F-fluorodeoxyglucose (FDG)-PET. Informed consent was received from all participants. The subjects consisted of 15 men and 7 women whose ages ranged from 17 to 83 years (mean age, 60 years). Patients were diagnosed with ischemic stroke (n = 13) or hemorrhagic stroke (n = 9), at least 2 months earlier (range, 2–14 months). None of the patients in this study had a discernible abnormality of the cerebellum or of the contralesional cerebral hemisphere on conventional T2-weighted MR imaging in the following pulse sequences: fast spin-echo, TR = 4000–4200 ms, TE = 100 ms, excitations = 2; field of view, 23 × 23 cm; and image matrix, 256 × 256. Twelve patients had suffered a stroke involving the left hemisphere, and the other 10 patients a stroke involving the right hemisphere.
We categorized patients into 2 groups according to the size of infarct, and each group was evaluated: group A consisted of 10 patients with an infarct involving more than one-third of the unilateral cerebral hemisphere, and group B consisted of the other 12 patients.
MR Data Acquisition
DTI was performed by using a 1.5T system (Intera; Philips Medical Systems, Best, the Netherlands) with a 6-channel sensitivity encoding (SENSE) head coil. Diffusion weighting was performed by using single-shot spin-echo echo-planar imaging and navigator echo phase correction. DTI parameters were as follows: a data matrix of 96 on a 22-cm field of view, zero-filled to 128 matrices, 2.3-mm section thickness without a gap, TE = 70 ms, TR = 6599–8280 ms, SENSE factor = 2; number of acquisitions = 2; b = 600 seconds/mm2 with 32 directions; and total imaging time <10 minutes.
Data Processing and Statistical Analysis
The data were processed on a PC equipped with PRIDE research software package (Philips Medical Systems, Best, Netherlands), based on the FACT method as described by Mori et al (20). Fiber tractography was obtained with threshold values of fiber tracking termination of FA = 0.2 and trajectory angle = 45°, and their configurations were investigated semiquantitatively and visually.
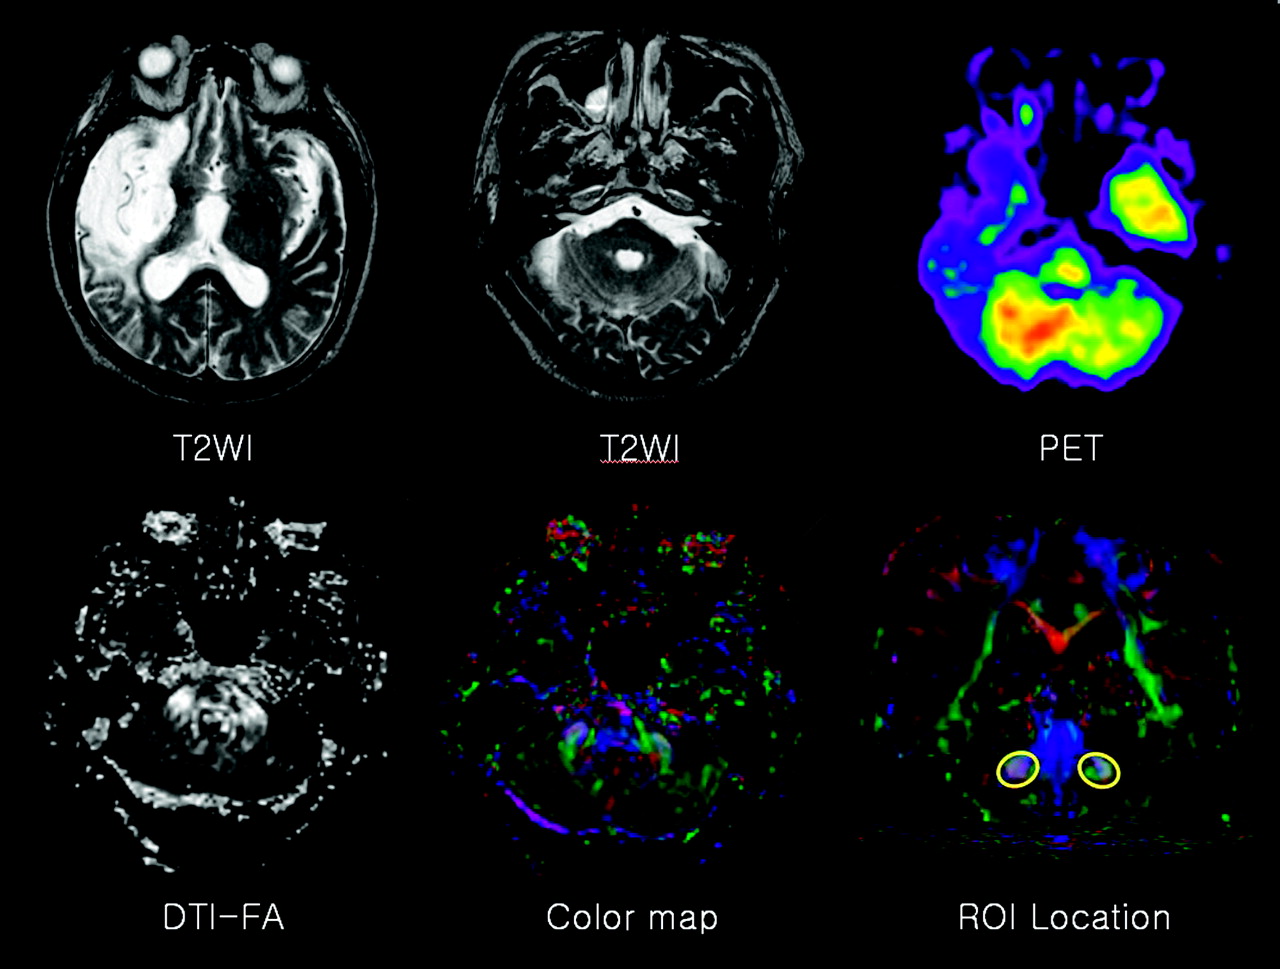
For the evaluation of pontocerebellar fibers, the FA of the bilateral middle cerebellar peduncle (MCP) was measured, and the same person (J.K.) drew the regions of interest, to minimize false region of interest registration, on the basis of the previously published fiber tract-based atlas of human white matter anatomy (21). The section level for MCP delineation was chosen one section posterior to the corticospinal tract in coronal section, and MCP was tracked by placing 2 regions of interest at the left and right of the lateral pontine tegmentum, which was clearly identified on the color map (Fig 1). Averaged FA values for ipsilesional and contralesional MCP were compared between the 2 groups and assessed by using the paired t test. A P value < .05 was considered statistically significant.

A 74-year-old man with left hemiparesis. The conventional T2-weighted image shows cerebromalacia in the territory of the right middle cerebral artery, without remarkable abnormality of the cerebellum and contralesional cerebral hemisphere. FDG-PET reveals decreased glucose metabolism in the left cerebellum (ie, CCD). No specific findings were found on FA or on color maps. To evaluate pontocerebellar fibers, FA was measured in a region of interest located on the bilateral MCPs in the coronal section.
PET
PET images were obtained in all patients by using FDG, and the mean time interval between DTI and FDG-PET was 13.5 days (range, 1–30 days). Patients were instructed to fast for at least 4 hours before the intravenous injection of 185 MBq of FDG. Scanning was initiated 40 minutes after tracer administration. Images were obtained on a PET scanner (GE Advance, Milwaukee, WI), which acquires data in 3D mode. The intrinsic spatial resolution of the system was approximately 5 mm (full-width at half-maximum) in the center of the field of view. Emission scans were acquired for 15 minutes, from the vertex to the neck. Transmission scans, by using germanium-68 point sources, were obtained after the end of the emission scan for 8 minutes to correct for nonuniform attenuation.
Analysis of PET data were performed, and the tomographic images of glucose use of the bilateral cerebral hemispheres and cerebellum were evaluated. The images were displayed on a monitor and regions of interest were drawn for the cerebellar cortex in the axial plane. Local tissue concentrations of radioactivity were calculated for each region, and the radioactivity concentration represented an average (weighted by area) of the values for each plane on which the cerebellar structures appeared. An index of cerebellar asymmetry was calculated for each brain region of interest as follows: Asymmetry index (%) = (C − I) × 200/(C + I), where C and I are the contralateral and ipsilateral cerebellar radioactivity concentrations, respectively. The presence of CCD was defined as asymmetry index >10% (22). Negative values of the asymmetry index indicate typical CCD, whereas positive values of the asymmetry index represent paradoxical cerebellar diaschisis. The results of FDG-PET in the affected cerebellum were compared with DTI findings.
Results
Clinical details and imaging findings are shown in the Table. Group A (ie, more than one-third of unilateral cerebral hemisphere involved) showed that the affected supratentorial lesion included at least one lobe of the cerebral hemisphere including the cortex on conventional MR imaging, and all patients in this group showed a decreased mean contralesional MCP FA value (Fig 1). Semiquantitative analysis of the contralesional MCP showed an averaged FA value of 0.5226 ± 0.0174, which was a statistically significant reduction versus the ipsilesional MCP (0.5366 ± 0.0159) (one-tail paired t test, P = .0009). On the other hand, in group B, in which the affected lesion was relatively confined to basal ganglia, thalamus, or deep white matter, the contralesional MCP showed an increased mean FA value in 10 patients and a decreased mean value in 2 patients; however, no statistically significant decrease in FA value between the peduncles was observed in the 2 group B patients who demonstrated decreased FA (one-tail paired t test, P = .2407). 3D fiber tractography was also obtained in 2 groups, but no significant differences were observed between them in terms of the fiber tract integrities of the ipsilateral and contralesional sides.
Clinical features and imaging findings
On FDG-PET scan, the presence of CCD, which was defined as asymmetry index of cerebellum >10%, was observed in all patients in group A and 9 of the 12 group B patients. The other 3 patients, without evidence of CCD on FDG-PET, had lacunar infarct on conventional MR imaging; all belonged to group B.
Discussion
CCD, first introduced by Baron et al (1), is a functional deactivation of the cerebellar hemisphere contralateral to supratentorial infarction and was regarded to be caused by a transneuronal metabolic depression of the cerebropontocerebellar pathway (1–3). The corticopontocerebellar tract, which is the largest afferent pathway derived from extensive areas of the cerebral cortex, projects to the ipsilateral pontine nuclei located ventral to the medial lemniscus via the ipsilateral cerebral peduncle. Pontine nuclei send axons to the contralateral cerebellar cortex, transversing the anterior pons as transverse pontine fibers. Most of these axons pass through the contralateral MCP and only a small number through the inferior cerebellar peduncle. This intimately connected pathway presumably sends somatosensory movement-related information to the cerebellum (6).
Morphologic changes have been reported in the affected cerebellar hemisphere of patients with chronic stroke, especially in children who have experienced an ischemic insult early in life, before 1 year of age (6, 7). Visual analysis of the cerebellum by imaging, however, is too subtle to be observed by conventional MR studies, and no detailed volumetric study has been reported to date (8). According to recently reported diffusion-weighted imaging of CCD, no difference in signal intensity between both MCPs in normal subjects was observed, whereas lower signal intensity was consistently noted in the contralateral MCP in patients with large supratentorial lesions (23). This study focused on demonstrating an acquired alteration of axonal fiber integrity by DTI, a powerful technique for probing white matter architecture. We hypothesized that CCD could be visualized by FA maps of the cortcopontocerebellar pathway at an earlier stage than can be achieved by conventional MR imaging.
CCD has long been thought to be a temporal continuum between early, potentially reversible functional hypometabolism and irreversible degeneration. Reversible functional hypometabolism might result from a loss of excitatory electrical stimuli, which originate in the contralateral cerebral cortex and relay in the pontine nuclei before reaching the cerebellar granule cells. The other pathophysiology of CCD might involve the transsynaptic degeneration of the corticopontocerebellar systems, which manifests later as cerebellar granule cell degeneration (2–5, 24). The results of the present study show CCD induced permanent morphologic changes of the neural pathway as well as functional and metabolic depression. Because FDG-PET detected more patients than DTI for the evaluation of CCD in chronic stroke, we thought that metabolic change should precede microscopic evidence of degeneration, but we did not know when such morphologic changes begin (23).
Previous studies have demonstrated that CCD is more frequent for large lesions, though recent studies have demonstrated that the anatomic location of the lesion rather than its extent and severity may be the more decisive factor in terms of the occurrence and magnitude of CCD in patients with cerebral infarction (1, 2, 4–8, 25–28). The present study shows a decreased FA value of the contralesional cerebellum in all patients with involvement of the cerebral cortices, which implies the interruption of many corticopontocerebellar fibers. Therefore, these findings are well correlated with previous studies, and FA value of the MCP may also be more influenced by the location of the cerebral lesion than its extent and severity, which should be investigated in the future with a large number of patients.
In group B subjects, most patients showed CCD on PET scan but did not show decreased FA value of the involved MCP. Moreover, there was little correlation between FA change and the age at infarct in our patient population. Because PET scan is a functional imaging study to detect minute changes of cellular metabolism, these changes may not be visualized on DTI. DTI, however, is more sensitive than conventional T2-weighted images in describing microstructural changes before gross morphologic alteration.
Some limitations still remain to be resolved. First of all, because of small sampling numbers, study based on a large population is necessary to validate our results in the future. In addition, no exact quantification method for DTI is available at this point, so further technical investigations such as voxel-based analysis and statistical assessment of FA values are needed to increase the utility of DTI in clinical field. We also expect that the relationships between the degree of FA decrease on DTI and the magnitudes of CCD on SPECT or PET in patients with chronic infarct will be further investigated.
Conclusion
DTI can visualize an altered corticocerebellar circuit in chronic stroke with CCD, which is hardly demonstrated by conventional MR imaging.
Footnotes
This study was supported by the Korean Radiological Society-Schering grant.
References
- Received January 7, 2005.
- Accepted after revision April 8, 2005.
- Copyright © American Society of Neuroradiology
In this issue


Jump to section
Related Articles
Cited By...
- White matter asymmetries in patients with cerebral small vessel disease
- Correlation of Asymmetry Indices Measured by Arterial Spin-Labeling MR Imaging and SPECT in Patients with Crossed Cerebellar Diaschisis
- A significant risk factor for poststroke depression: the depression-related subnetwork
- Acute Effects of Alcohol on the Human Brain: Diffusion Tensor Imaging Study
- Cortical and cerebellar hypometabolism after bilateral antero-inferior cerebellar artery infarct
- Advances in Imaging 2006