Fig 4.

Fig 4.
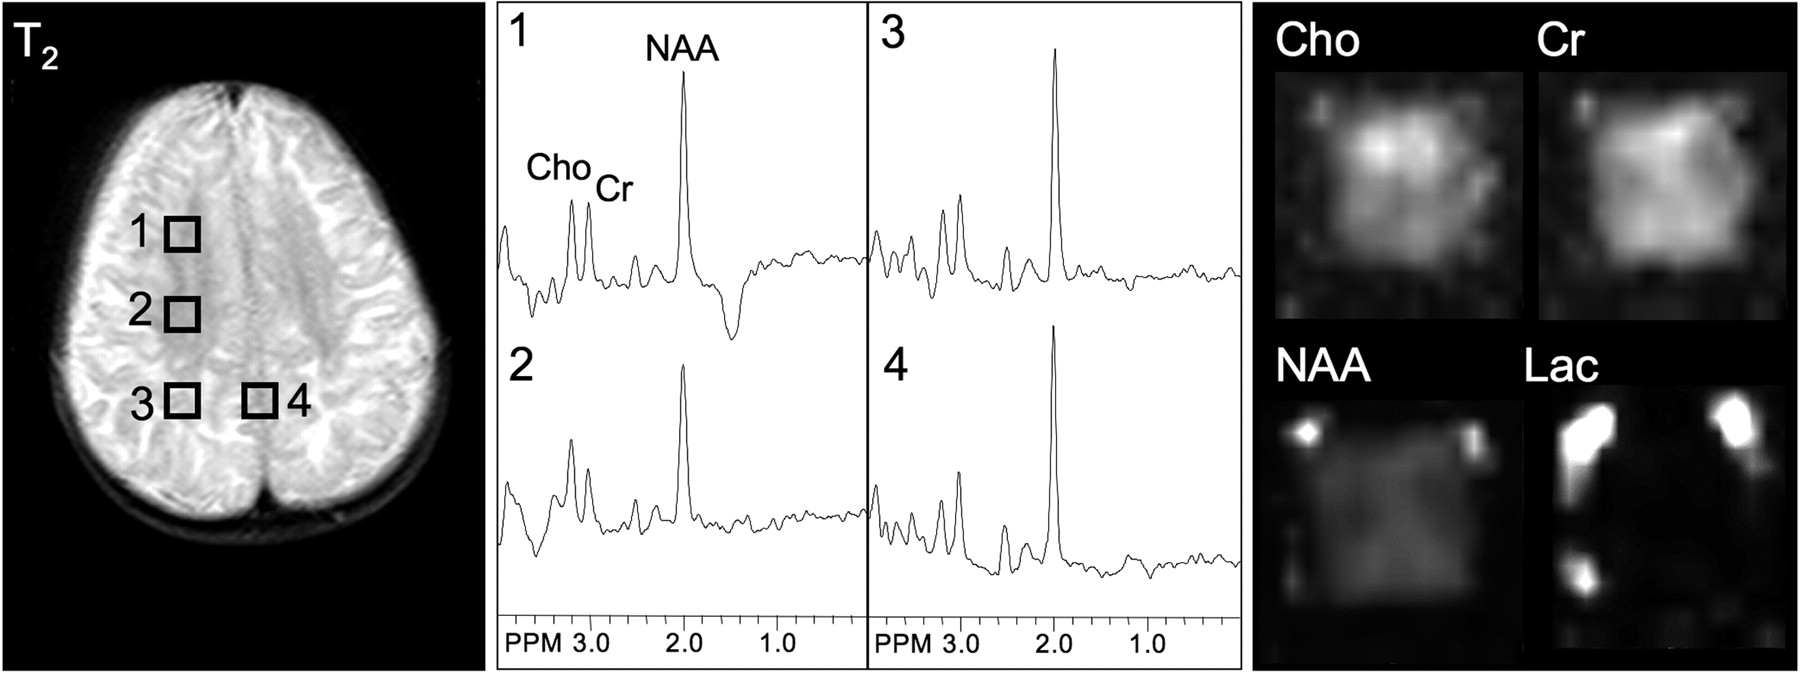
T2-weighted MR, selected spectra, and metabolic images of Cho, Cr, NAA, and lactate (Lac) in a typical patient with Canavan disease. NAA is higher than normal in both white and gray matter regions. Note lower (ie, more normal) NAA levels, as seen in voxel 2 and in the NAA metabolic image, in the deeper white matter where there is less signal-intensity abnormality on the T2-weighted MR image. PPM indicates parts per million.


Related Articles
Cited By...
- BRAIN MR SPECTROSCOPIC FINDINGS IN THREE CONSECUTIVE COVID-19 PATIENTS: PRELIMINARY OBSERVATIONS
- Brain MR Spectroscopic Findings in 3 Consecutive Patients with COVID-19: Preliminary Observations
- Quantitative MRI in hypomyelinating disorders: Correlation with motor handicap
- Neuroimaging In Cockayne Syndrome