
Abstract
BACKGROUND AND PURPOSE: Connectivity mapping based on resting-state fMRI is rapidly developing, and this methodology has great potential for clinical applications. However, before resting-state fMRI can be applied for diagnosis, prognosis, and monitoring treatment for an individual patient with neurologic or psychiatric diseases, it is essential to assess its long-term reproducibility and between-subject variations among healthy individuals. The purpose of the study was to quantify the long-term test-retest reproducibility of ICN measures derived from resting-state fMRI and to assess the between-subject variation of ICN measures across the whole brain.
MATERIALS AND METHODS: Longitudinal resting-state fMRI data of 6 healthy volunteers were acquired from 9 scan sessions during >1 year. The within-subject reproducibility and between-subject variation of ICN measures, across the whole brain and major nodes of the DMN, were quantified with the ICC and COV.
RESULTS: Our data show that the long-term test-retest reproducibility of ICN measures is outstanding, with >70% of the connectivity networks showing an ICC > 0.60. The COV across 6 healthy volunteers in this sample was >0.2, suggesting significant between-subject variation.
CONCLUSIONS: Our data indicate that resting-state ICN measures (eg, the correlation coefficients between fMRI signal-intensity profiles from 2 different brain regions) are potentially suitable as biomarkers for monitoring disease progression and treatment effects in clinical trials and individual patients. Because between-subject variation is significant, it may be difficult to use quantitative ICN measures in their current state as a diagnostic tool.
ABBREVIATIONS:
- COV
- coefficient of variance
- DMN
- default mode network
- ICC
- intraclass correlation coefficient
- ICN
- intrinsic connectivity network
- IPC
- inferior parietal cortex
- ITC
- inferior temporal cortex
- MPFC
- medial prefrontal cortex
- MTG
- middle temporal gyrus
- PCC
- posterior cingulate cortex
- PHC
- parahippocampal cortex
- SFC
- superior frontal cortex
- VACC
- ventral anterior cingulate cortex
In contrast to conventional fMRI, which maps brain activity associated with an experimental paradigm, resting-state fMRI can identify the intrinsic organization of the brain without requiring subjects to perform explicit tasks.1 In resting-state fMRI studies, the spontaneous low-frequency (<0.1 Hz) fluctuations in fMRI signals, which are temporally coherent among functionally connected brain regions,2 are characterized to map the ICNs of the brain. Researchers have identified ICNs associated with sensorimotor,2 auditory,3 visual,3,4 default mode,5,6 attention,7 and executive control8 functions among others.
Because a subject's active participation in performing specific tasks is not required, resting-state fMRI is well-suited for patient studies.9 Several recent studies have demonstrated that patterns of ICNs are significantly different between individuals with and without neuropathologic conditions.9 For example, mapping of ICNs at the group level has shown abnormal connectivity patterns related to dementia,10,11 epilepsy,12,13 autism,14,15 and schizophrenia.16,17 However, it remains unclear whether the ICN measures derived from an individual have practical clinical uses. It is essential to understand the long-term test-retest reproducibility of ICN measures for an individual person before the ICN mapping can be reliably used as a biomarker indicative of disease progression and treatment efficacy. It is also of great importance to understand the between-subject variation of ICN measures in healthy volunteers before considering whether resting-state fMRI can supplement the diagnosis in patients with neurologic or psychiatric diseases.
Although information regarding the reproducibility of resting-state-fMRI–based ICN measures during a short interval is available,18⇓⇓⇓⇓⇓–24 research on the long-term reproducibility—that is, time intervals matching those of a clinical trial—has been sparse.23 In addition, little is known about the between-subject variability of quantitative ICN measures in healthy controls. Finally, although most ICNs have been consistently identified across studies, the reproducibility in terms of the connectivity strength has rarely been quantified.23 In the present study, we aim to assess the long-term test-retest reproducibility of quantitative connectivity measures derived from resting-state fMRI for individual subjects and to assess the between-subject variation in healthy volunteers of functional connectivity strength between every pair of major network nodes in the brain (including those of the DMN).
Materials and Methods
Participants
This is a retrospective study of 8 right-handed subjects who participated in a longitudinal study on fMRI measurements. Data from 2 subjects were not included in this article because 1 of the subjects relocated after 5 scan sessions and was unable to complete the rest; and MR imaging data from another subject were corrupted due to computer failure. Data from the remaining 6 subjects (5 men and 1 woman), 21–46 years of age (mean, 30.33 ± 8.64) were used in our analysis to assess the resting-state fMRI reproducibility. The subjects had no neurologic, psychiatric, sensory, or motor illness by history. Participants gave written informed consent for a protocol approved by the institutional review board of Brigham and Women's Hospital.
Data Acquisition
All experiments were performed by using a 1.5T clinical MR imaging scanner (Signa CNV, GE Healthcare, Milwaukee, Wisconsin). The resting-state fMRI data were acquired while the subjects were instructed to keep their eyes closed, relax, and remain still. Each subject was scanned at 9 separate sessions (range, 21–133 days; mean intersession duration, 54.3 ± 24.1 days), spanning more than a 1-year period (range, 384–554 days; mean, 463 ± 58.4 days).
In resting-state fMRI scans, T2*-weighted gradient-echo EPI data covering the whole brain were acquired with the following imaging parameters: TR = 2.5 seconds, TE = 50 msec, flip angle = 90°, in-plane matrix size = 64 × 64, FOV = 24 × 24 cm, section thickness = 6 mm (no gap), and number of axial sections = 24. The duration of the resting-state fMRI scan was 4 minutes 30 seconds (excluding dummy scans), and 108 time points were acquired.
Data Preprocessing
The acquired fMRI data were processed by using tools provided by the fMRI of the Brain Software Library (http://www.fmrib.ox.ac.uk/fsl)25 and were customized using Matlab codes developed in-house (MathWorks, Natick, Massachusetts). The functional images from each participant were realigned with respect to the first set of images to minimize the effects of head movements during data acquisition. After realignment, a bandpass filter (between 0.001 and 0.1 Hz) was used to filter the fMRI data in the time dimension, a common practice in resting-state fMRI studies. The aligned and filtered images (without spatial smoothing) were then normalized to the Montreal Neurologic Institute 152 template by using a 12-df affine transformation.
DMN Connectivity Analysis
We first evaluated the reproducibility of the connectivity strengths among 16 major nodes of the DMN, an ICN that is highly active during the resting state6 and is involved in disorders such as epilepsy,12,13 dementia,11,26 and schizophrenia and affective disorders.27 As illustrated in Fig 1A, the selected DMN nodes included the left PCC, right PCC; left VACC, right VACC; left MPFC, right MPFC; left SFC, right SFC; left IPC, right IPC; left MTG, right MTG; left ITC, right ITC; and left PHC, right PHC. The coordinates of the chosen DMN nodes are shown in Fig 1A and were based on previously reported studies.5,28⇓⇓⇓⇓–33

A, Seed regions of the DMN. B, Interregional correlation coefficients and ICCs among the 16 regions of the DMN. In this 16 × 16 square matrix, the x- and y-axes represent the 16 regions of the DMN, and each matrix element indicates the functional connectivity strength between a pair of listed brain regions. Four different background colors are used to indicate different levels of reproducibility.
A cubic region of interest (1.2 × 1.2 × 1.2 cm, centered at the node coordinates) was constructed for each of the DMN nodes. fMRI signals from all voxels inside a region of interest were averaged to generate a region-of-interest-specific time course profile. The Pearson correlation coefficients were computed between each pair of the DMN nodes, yielding 16 × 16 correlation coefficients for each participant in each session. These coefficients were stored in a 16 × 16 matrix with only 120 [ie, (16 × 15)/2] unique elements, with each element reflecting the quantitative connectivity strength between 2 brain regions. For further statistical analysis, a Fisher r-to-z transformation [ie, z = 0.5 × log(1 + r/1 − r)] was performed to improve the normality of the correlation coefficients for parametric statistics to follow.
Evaluation of Within-Subject Reproducibility: DMN
The long-term test-retest reproducibility for each functional connectivity (ie, an element in the generated 16 × 16 connectivity matrix) and each subject across 9 sessions was estimated by the ICC, an ANOVA-based correlation measuring the relative homogeneity within groups in ratio to the total variation.34 The ICC (proportion of MSBS-MSwS to MSBS) for each functional connectivity element (ICCelement) was calculated with equation 1:
where MSBS is the between-subject mean square and MSWS is the within-subject mean square. MSBS is the between-subject sum of squares divided by its dfs, and MSWS is the within-subject sum of squares divided by its dfs. The ICC for each subject (ICCsubject) is calculated with equation 2:
where MSBE is the between-element mean square and MSWE is the within-element mean square. MSBE is the between-element sum of squares divided by its dfs, and MSWE is the within-element sum of squares divided by its dfs. There was 1 ICCsubject value for each subject, yielding 6 ICCsubject values across 120 connectivity elements and 9 sessions; there was 1 ICCelement value for each connectivity element between brain regions, yielding 120 ICCelement values across 6 subjects and 9 sessions. The ICC is bounded between −1 and 1. An ICC ≥ 0.80 indicates outstanding test-retest reproducibility; 0.60 to 0.79, substantial; 0.40–0.59, moderate; and 0–.39, poor.35
Evaluation of Between-Subject Reproducibility: DMN
The between-subject reproducibility was estimated by the COV, which is indicative of consistency of the data across participants. It is defined as the ratio of the SD (ς) of a set of scores to its mean (μ) and is given by equation 3:
The COV has been used to compare the relative dispersion in 1 set of data with the relative dispersion in another set of data. Previous literature did not provide clear-cut indications of what an acceptable COV would be. However, a COV < 0.05, 0.1, or 0.2 has been considered acceptable for reproducibility.36⇓–38 We, therefore, selected a more commonly used criterion of COV ≤ 0.2 in the present study. There was 1 COV value for each connectivity element between brain regions, yielding 120 COV values across 6 subjects and 9 sessions.
Whole-Brain Connectivity Analysis and Evaluation of Within- and Across-Subject Reproducibility
To evaluate the reproducibility of the ICNs for the whole brain, the preprocessed (ie, aligned, bandpass filtered, and normalized) data were segmented into 116 regions by using the automatic anatomic labeling template reported by Tzourio-Mazoyer et al.39 This parcellation divided the cerebrum into 90 regions (45 in each hemisphere) and the cerebellum into 26 regions (9 in each cerebellar hemisphere and 8 in the vermis), which are listed in On-line Table 1. Regional mean time series was estimated by averaging the fMRI time series of all voxels in each region. The Pearson correlation coefficients were computed between each pair of brain regions, yielding 116 × 116 correlation coefficients, for each participant in each session. These coefficients were stored in a 116 × 116 matrix with only 6670 [ie, (116 × 115)/2] unique elements, with each element representing the connectivity strength between 2 brain regions. A Fisher r-to-z transformation was then performed to improve the normality of the correlation coefficients. Similar to the reproducibility assessment for the DMN nodes, the ICC and COV were used to quantify the within- and between-subject reproducibility, respectively, of ICNs for the whole brain. There was 1 ICCsubject value for each subject, yielding 6 ICCsubject values across 6670 connectivity elements and 9 sessions; and there was 1 ICCelement value for each connectivity element between brain regions, yielding 6670 ICCelement values across 6 subjects and 9 sessions. For the between-subject reproducibility, there was 1 COV value for each connectivity element between brain regions, yielding 6670 COV values across 6 subjects and 9 sessions.
Results
DMN
The ICCsubject value for each subject was 0.83, 0.88, 0.79, 0.81, 0.64, and 0.85, respectively (mean, 0.80 ± 0.08). Among the 120 connectivity elements, 53 elements (44.17%) had outstanding long-term test-retest reproducibility (ie, ICCelement ≥ 0.8) across the 9 scan sessions: 34 (28.34%), substantial; 18 (15.01%), moderate; and 15 (12.49%), poor (Table 1). As shown in Table 1, for the 53 elements that have outstanding long-term reproducibility, the 95% confidence interval for the ICCelement in the whole population was 0.69–0.98. The mean correlation coefficient of each connectivity element (across subjects and sessions) with 4 different background colors denoting different levels of reproducibility is shown in Fig 1B. For the between-subject reproducibility, only 1 of 120 connectivity elements showed acceptable between-subject reproducibility (ie, COV < 0.2).
Statistics of reproducibility of functional connectivity in the DMN
Whole Brain
The ICCsubject value for each subject was 0.92, 0.97, 0.92, 0.89, 0.89, and 0.93, respectively (mean, 0.92 ± 0.03). Among the 6670 connectivity elements, 2864 elements (42.94%) had outstanding within-subject test-retest reproducibility (ie, ICCelement ≥ 0.8) across 9 sessions: 2400 (35.98%), substantial; 729 (10.93%), moderate; and 677 (10.15%), poor (Table 2). As can be seen in Table 2, for the 2864 elements that have outstanding long-term reproducibility, the 95% confidence interval for the ICC in the whole population was 0.69–0.98. For the between-subject reproducibility, 929 of 6670 (13.93%) connectivity elements showed acceptable between-subject reproducibility (ie, COV < 0.2). The ICCselement and COVs of each connectivity element across the whole brain are shown in Fig 2A, -B, respectively.
Statistics of reproducibility of functional connectivity for the whole brain
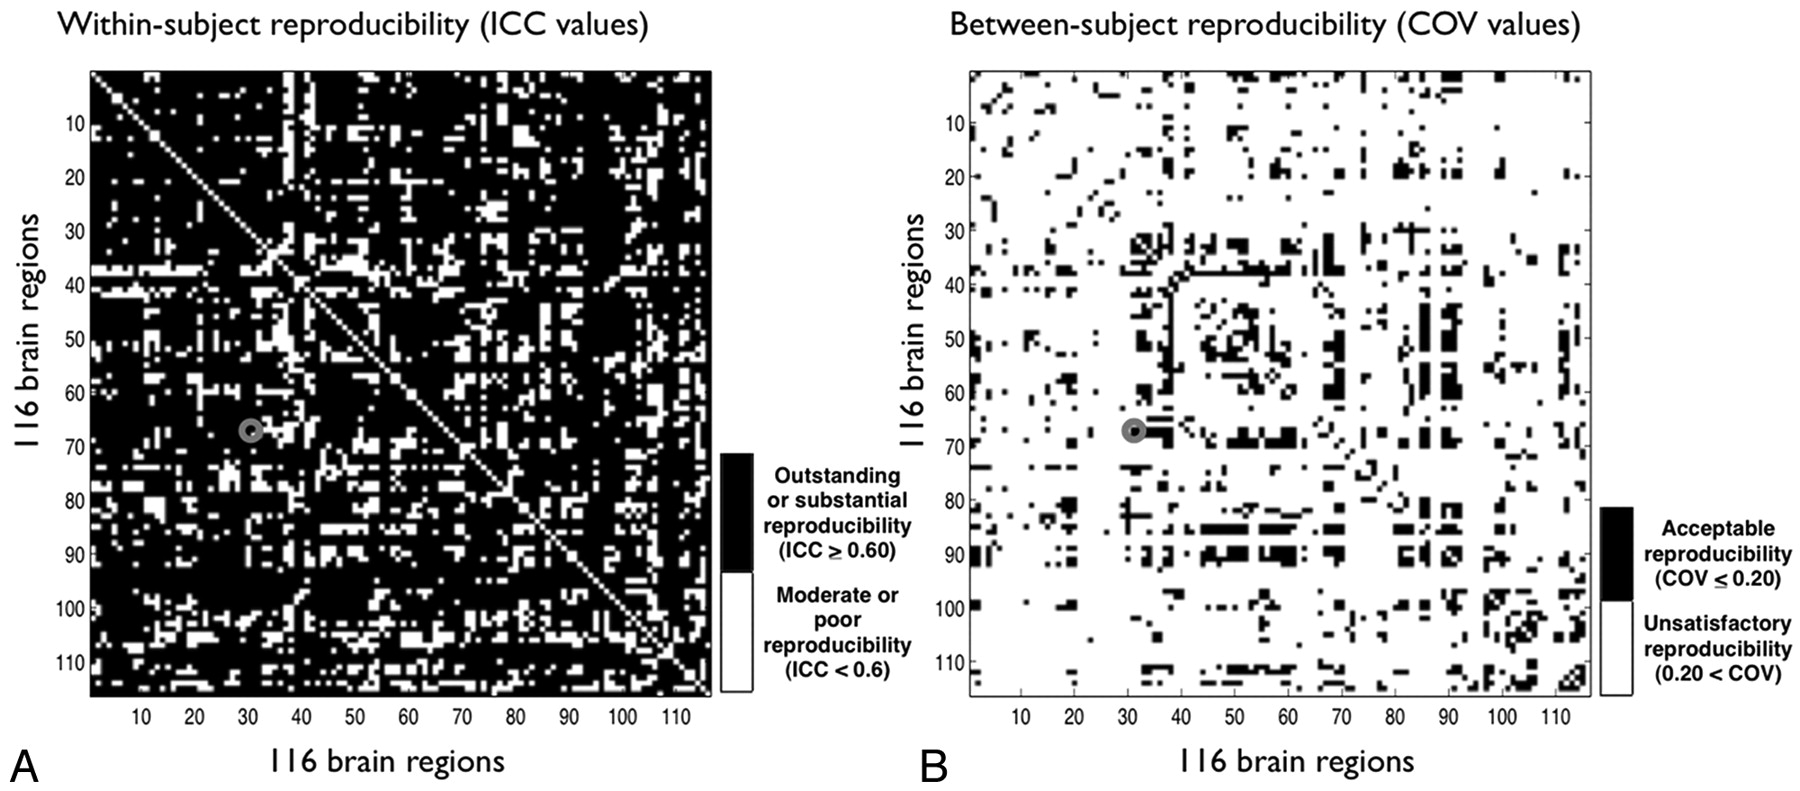
Within-subject test-retest reproducibility (A) and between-subject reproducibility (B) of the inter-regional correlation coefficients among the 116 regions of the whole brain. In this 116 × 116 square matrix, the x- and y-axes represent the 116 regions of the whole brain listed in On-line Table 1, and each matrix element indicates the link between a pair of listed brain regions. For example, the element marked by a red circle (ie, x = 31, y = 68) represents a link between the left anterior cingulate gyrus and the right precuneus. A, Each matrix element shows the level of within-subject reproducibility, measured by the ICC, of an inter-regional link. Note that >78% of the elements have outstanding or substantial within-subject test-retest reproducibility. B, Each element shows the level of between-subject reproducibility, measured by the COV. Less than 14% of the elements have acceptable between-subject reproducibility.
Discussion
A primary goal of this study was to investigate the long-term test-retest reproducibility of quantitative ICN measures in healthy volunteers across 9 sessions during >1 year. A second goal was to evaluate the variability of mapping of ICNs across healthy volunteers. We found that within-subject long-term reproducibility is high, and this finding can be applied to a true population at a 95% confidence level. We, therefore, conclude that ICN mapping based on resting-state fMRI has considerable potential for longitudinal monitoring, such as assessing disease progression and/or monitoring treatment effect with time for an individual patient.
In contrast to high within-subject reproducibility, our data show that there is significant between-subject variation based on both DMN node analysis and whole-brain analysis. This observation indicates that it will be challenging to use quantitative ICN measures (eg, the correlation coefficients between fMRI signal-intensity profiles from 2 different brain regions) as a diagnostic tool when only data from a single scan session are available. Other quantitative measures derived from graph-theory analysis40⇓⇓–43 or hierarchical analysis44,45 may result in different between-subject reproducibility. This could be examined in further studies.
In our study, the ages of the subjects ranged from 21 to 46 years. It is unclear whether reproducibility is a function of age and whether the between-subject variation might decrease in younger subjects. On one hand, large between-subject variations of quantitative ICN measures suggest ICN mapping might not be suitable for diagnostic classification. On the other hand, when one performs group-level analysis, the high between-subject variations may be useful for identifying the ICNs that are most relevant to different behavioral or phenotypic measures, provided the variance is due to such factors and not to unrelated physiologic and anatomic differences. For example, our group has recently designed a behavior-based connectivity analysis, in which the between-subject variations of quantitative ICN measures, corresponding to different elements of the connectivity matrix, are correlated with the between-subject variations of the behavioral measures (eg, reaction time in our study).46 With this approach, we have shown that multiple ICNs connected with the inferior frontal region are relevant to the reaction time in older adults, but less so in younger adults.
There are a few potential limitations in this study. First, the intersession durations were inconsistent within and across the participants in this retrospective study. To assess the impact of intersession duration inconsistency on the calculated fMRI reproducibility, we computed the Pearson correlation coefficients between the individual's test-retest reproducibility (measured by the ICC) and the individual's SDs of the intersession interval across all of the participants. We found that there was no significant correlation between the ICC and the SD of intersession duration for the DMN (r = 0.31, P = .54) and the whole brain (r = 0.18, P = .73), suggesting that the varied intersession duration was not a confounding factor to our assessment of fMRI reproducibility. Second, the subjects closed their eyes during the resting-state fMRI scan; thus, the inconsistency of an uncontrolled mental state among the participants may contribute to between-subject variation in the acquired ICN maps. It has been shown recently that if the subjects are engaged in a simple task (eg, looking at a cross-hair) during resting-state fMRI scans, variations in ICN measures may potentially be reduced.47
Third, fMRI data are degraded by various types of artifacts (including geometric distortions, susceptibility effect–induced signal-intensity loss, and regional pulsation artifacts) and the level of artifacts varies among subjects. Even after performing normalization, we cannot guarantee that every anatomic region of interest is equally well-aligned across subjects. As a result, some of the between-subject variation observed in our study may be related to the inconsistency of the residual artifacts across the participants. Fourth, we believe that the reproducibility may potentially be improved when a more consistent scan setting (eg, section location and shimming) is used in longitudinal fMRI scans. Fifth, there is evidence showing that sex and menstrual cycle may influence functional brain organizations48⇓–50 and, potentially, fMRI reproducibility. The effects of sex and menstrual cycle were not investigated because there was only 1 female subject in our study. Finally, the resting-state fMRI reproducibility may potentially be improved by newer reconstruction and statistical procedures that may be developed and available in the future.
Conclusions
We present a longitudinal resting-state fMRI study in healthy volunteers, in which we have evaluated the within- and across-subject long-term reproducibility during the approximate duration of a clinical trial. Our data show that quantitative ICN measures derived from resting-state fMRI have a high level of within-subject reproducibility, suggesting that ICN mapping may be an appropriate tool for longitudinal monitoring of disease progression or treatment effects. In contrast, considerable between-subject variation in these measures suggests that they may not be suited for clinical diagnosis/classification. The latter may reflect limitations of the current state of this technology or significant intrinsic physiologic variability of the resting-state itself between subjects. Further studies assessing the reproducibility of resting-state fMRI in patients with various disease states, as well as the effect size of disease progression, will be needed to determine whether the fMRI-based connectivity mapping can serve as a biomarker for therapeutic monitoring in clinical trials and individual patients.
Footnotes
-
This study was supported by NIH grant R01NS37992 awarded to Lawrence P. Panych, PhD; partial funding for Dr. Chou was provided by the National Institute on Aging (5T32 AG-000029-35).
-
Paper previously presented in part at: Annual Meeting of the International Society for Magnetic Resonance in Medicine, May 1–7, 2010; Stockholm, Sweden.
-
Disclosures: Jeffrey Petrella—UNRELATED: Board Membership: Janssen Pharmaceuticals (2010),* Comments: Alzheimer's Disease Neuroradiologist Advisory Board. Consultancy: Draftfcb Healthcare (2011);* Expert Testimony: Wilson & Elser (2010),* Comments: medicolegal consultation, Travel/Accommodations/Meeting Expenses Unrelated to Activities Listed: Portuguese Society of Neuroradiology (2011). Nan-kuei Chen—UNRELATED: Grants/Grants Pending: NIH. * Money paid to institution.
Indicates open access to non-subscribers at www.ajnr.org
References
- Received June 18, 2011.
- Accepted after revision August 28, 2011.
- © 2012 by American Journal of Neuroradiology
In this issue


Jump to section
Related Articles
Cited By...
- The Role of Visual Experience in Individual Differences of Brain Connectivity
- No impact of functional connectivity of the motor system on the resting motor threshold: A replication study
- Tracking ongoing cognition in individuals using brief, whole-brain functional connectivity patterns
- Resting-State fMRI: A Review of Methods and Clinical Applications
- From the bridges of Konigsberg to the fields of Alzheimer: Connecting the dots