
Abstract
BACKGROUND AND PURPOSE: The role of gray matter in multiple sclerosis is increasingly evident; however, conventional images demonstrate limitations in cortical lesion identification. Perfusion imaging appears sensitive to changes in tissue type and disease severity in MS. We sought to use bookend perfusion to quantify parameters in healthy controls and normal-appearing and lesional tissue at different relapsing-remitting MS stages.
MATERIALS AND METHODS: Thirty-nine patients with relapsing-remitting MS and 19 age-matched healthy controls were prospectively recruited. The Minimal Assessment of Cognitive Function in MS battery was used to assess cognitive performance. Perfusion parameters, including cerebral blood flow and volume and mean transit time, were compared for healthy controls and normal-appearing and lesional tissue for all study groups. Dispersion of perfusion measures for white matter lesions and cortical lesions was assessed.
RESULTS: Twenty of the 39 patients with relapsing-remitting MS were cognitively impaired. Significant differences were displayed between all relapsing-remitting MS subgroups and healthy controls in all comparisons except for normal-appearing gray matter CBV between healthy controls and unimpaired patients with relapsing-remitting MS and for all normal-appearing white matter perfusion parameters between healthy controls and unimpaired patients with relapsing-remitting MS. White matter lesion but not cortical lesion perfusion was significantly reduced in cognitively impaired patients with relapsing-remitting MS versus unimpaired patients with relapsing-remitting MS. Perfusion reduction with disease progression was greater in normal-appearing gray matter and normal-appearing white matter compared with cortical lesions and white matter lesions. Smaller dispersion was observed for cortical lesions compared with white matter lesions for each perfusion parameter.
CONCLUSIONS Quantitative GM and WM analysis demonstrated significant but disproportionate white matter lesion, cortical lesion, normal-appearing white matter, and normal-appearing gray matter changes present between healthy controls and patients with relapsing-remitting MS with and without cognitive impairment, necessitating absolute rather than relative lesion perfusion measurement.
ABBREVIATIONS:
- CL
- cortical lesion
- NAGM
- normal-appearing gray matter
- NAWM
- normal-appearing white matter
- RRMS
- relapsing-remitting MS
- RRMS-I
- impaired patients with relapsing-remitting MS
- RRMS-NI
- nonimpaired patients with relapsing-remitting MS
- WML
- white matter lesion
Multiple sclerosis is a chronic inflammatory demyelinating disease of the central nervous system,1 characterized by initial increased blood-brain barrier permeability and perivascular lymphocyte migration.2 Cognitive impairment is present in 40%–65% of patients with MS and correlates with cortical lesion volume.3,4 Clinical-pathologic correlation by using high-field ex vivo MR imaging has demonstrated limitations in prospective cortical lesion identification by using proteolipid protein staining as a reference standard,5 prompting the testing of surrogate techniques for in vivo assessment of cortical lesions.
Recently, studies demonstrated the potential for perfusion MR imaging to identify cortical abnormalities, even in the absence of structural differences, suggesting that perfusion is sensitive to changes not visible on routine structural imaging.2,6⇓⇓⇓–10 Perfusion changes appear sensitive to tissue type and disease activity and severity and are most commonly described in the context of white matter lesions. Reduced CBF, normal or reduced CBV, and increased or unchanged MTT have been previously demonstrated in white matter lesions (WMLs) compared with normal-appearing white matter (NAWM) in relapsing-remitting MS (RRMS).7 While a few studies have assessed cortical perfusion,9,10 scant data describe perfusion changes in cortical lesions.2 By virtue of the semiquantitative dynamic susceptibility contrast MR imaging perfusion technique, Peruzzo et al2 reported that cortical lesion perfusion changes as a percentage difference between cortical lesions and normal-appearing gray matter (NAGM), effectively normalizing perfusion results by NAGM. While this approach addresses potential issues of interscan variability, it assumes stability of NAGM perfusion, ignoring changes that occur with disease progression that would significantly alter the cortical lesion/NAGM ratio and result in erroneous measurements.6
DSC–MR imaging remains the most widely used method for MR imaging perfusion assessment and may be used to derive quantitative rather than semiquantitative perfusion measurements by calibrating T1 signal change before and after the DSC sequence. This bookend perfusion MR imaging technique11 generates reliable, reproducible, and validated quantitative perfusion measurements,12 precluding the need for normalization against a reference tissue type. The objective of this study was to use bookend perfusion MR imaging to quantify absolute perfusion changes within cortical lesions (CLs), WMLs, NAWM, and NAGM at different RRMS disease stages. We hypothesized that absolute lesion and NAGM/NAWM perfusion predictably changes with increased disease severity and progression.
Materials and Methods
Patients
Subjects with RRMS were prospectively recruited for this ethics board–approved study from tertiary referral MS clinics at Sunnybrook and St. Michael's hospitals during 1 year. MS diagnosis was established by using the revised McDonald criteria by a senior MS neurologist (20 years' experience). Participant clinical histories, including age, sex, education level, disease duration, medication, and relapses, were recorded. Exclusion criteria were drug/alcohol abuse, relapse or corticosteroid use within the past 3 months, premorbid psychiatric history, head injury (including loss of consciousness), and concurrent morbidity (cerebrovascular disease and MR imaging/gadolinium contraindications including impaired renal function). All participants were specifically recruited for this study as controls, age- and sex-matched to patients with RRMS. Written consent included a discussion of the small potential risks associated with gadolinium injection and was obtained from all participants after confirming gadolinium and MR imaging eligibility with glomerular filtration rate determination and a standardized MR imaging contraindication questionnaire. Thirty-nine patients and 19 age-matched healthy participants were recruited.
Neuropsychological Assessment
All participants with RRMS were assessed for cognitive impairment by using the Minimal Assessment of Cognitive Function in MS with the purpose of dichotomizing patients with RRMS into those who were cognitively intact and those who were impaired. The Minimal Assessment of Cognitive Function in MS was recommended by an expert panel for clinical monitoring and research and was performed within 1 week of MR imaging. This 90-minute cognitive battery covers 5 cognitive domains by performing 7 tests: learning and memory (California Verbal Leaning Test-II, Brief Visuospatial Test-revised); processing speed and working memory (Paced Auditory Serial Addition and Symbol Digit Modalities Test); executive function (Delis-Kaplan Executive Function System); verbal fluency (Controlled Oral Work Association Test); and visuospatial perception/spatial processing (Judgment of Line Orientation Test). Anxiety and depression were also assessed through administration of the Hospital Anxiety and Depression Scale. Age- and sex-adjusted normative data were used to convert raw test scores to z scores. Z scores less than −1.5 for a single test defined impairment, and patients impaired on ≥2 tests were considered impaired.
Image Acquisition
MR imaging was performed on a 3T MR imaging system (Achieva; Philips Healthcare, Best, the Netherlands) with an 8-channel phased array coil. The acquisitions included volumetric T1 (TR/TE/flip angle, 9.5/2.3 ms/12°; number of averages, 1; FOV, 24 cm; section thickness, 1.2 mm; matrix size, 256 ×219); proton density/T2 (TR/TE/flip angle, 2500/10.7 ms/90°; FOV, 23 cm; section thickness, 3 mm; matrix, 256 × 263); phase-sensitive inversion recovery (TR/TE, 3374/15 ms; FOV, 23 cm; section thickness, 3 mm; matrix, 400 × 255; in-plane voxel size, 0.43 × 0.43); and field-echo echo-planar imaging DSC (TR/TE/flip angle, 1633/30 ms/60°; FOV, 22 cm; section thickness, 4 mm; matrix, 96 × 93; in-plane voxel size, 2.3 × 2.4 mm; no gap; signal bandwidth, 1260 Hz/pixel; sections, 24). A 25-mL bolus of saline at a rate of 5 mL/s was applied after administering 10 mL of gadobutrol (Gadovist; Bayer Schering Pharma, Berlin, Germany) (1 mmol/mL) with a power injector at 5 mL/s. Sixty images were acquired at 1.6-second intervals with the injection occurring at the fifth volume. A segmented inversion recovery Look-Locker EPI sequence was performed immediately before and after the DSC sequence (TR/TE/flip angle, 29/14 ms/20°; TI, 15.8 ms; FOV, 22 cm; matrix, 128 × 126; 15 lines in k-space per acquisition; section thickness, 4 mm; 60 time points; scan time, 73 seconds). After the last imaging time, a 3000-ms delay was placed to ease longitudinal magnetization recovery.
Image Processing
Statistical Parametric Mapping (SPM8; http://www.fil.ion.ucl.ac.uk/spm/software/spm12) was used for coregistering structural T1- and proton density/T2-weighted images. Segmentation of intracranial tissue was automatically performed, by a validated technique using the structural T1 images, into GM, WM, and CSF.13 Cortical lesions, WM lesions, and T1 holes were manually traced by a clinician (10 years of experience) on phase-sensitive inversion recovery and T2 and T1 images, respectively, by using Analyze 8.0 (Mayo Clinic, Rochester, Minnesota). The fractional brain volume was calculated for the segmented tissues.
A series of registrations, including linear registration (FMRIB Linear Image Registration Tool, FLIRT; http://www.fmrib.ox.ac.uk/) followed by multiresolution nonlinear registration with 4 subsampling levels by using nonlinear intensity modulation (FMRIB Nonlinear Registration Tool; FNIRT; http://fsl.fmrib.ox.ac.uk/fsl/fslwiki/FNIRT), were performed to register structural T1- and proton density/T2-weighted images with the segmented ROIs to the corresponding precontrast EPI sequence. To better guide the alignment, we iteratively smoothed images by using a full width half maximum Gaussian kernel. The kernel sizes used at each resolution level were 6, 4, 2, 2 mm and 4, 2, 0, 0 mm for the moving images and perfusion images, respectively. Last, the MRIcro Brodmann template (Neuropsychology Laboratory, Columbia, South Carolina) and the ICBM lobar templates (Laboratory of Neuroimaging, Keck School of Medicine, University of Southern California, Los Angeles, California) were registered, by using the same registration regimen, to the transformed T1 images in EPI space. The templates were used to calculate the average GM and WM perfusion parameters for each participant.
An automated island labeling technique based on the 8 connected components criteria was applied to WML and CL segmentation masks to separately label individual lesions (Matlab; MathWorks, Natick, Massachusetts) for every patient (Figs 1 and 2).

Block diagram representation of the image acquisition and processing pipeline. PSIR indicates phase-sensitive inversion recovery; PD, proton density.

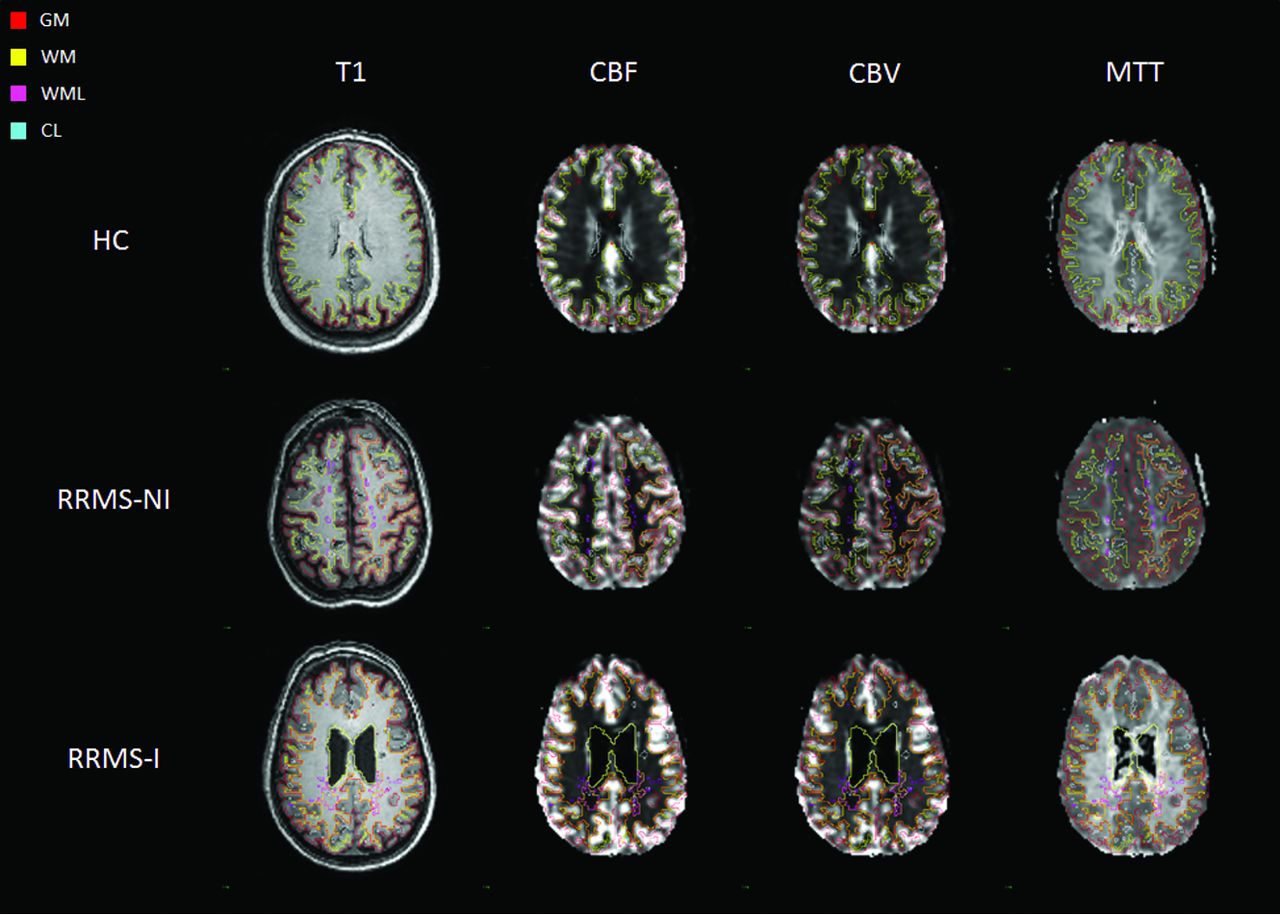
Representative section of T1 and perfusion images in perfusion space for the different study groups with overlays of the investigated ROIs.
Bookend Perfusion
The bookend technique was used to calculate quantitative perfusion parameters, including cerebral blood volume, flow, and mean transit time.11,14,15 Briefly, the bookend technique calibrates relative values to quantitative values on the basis of parenchymal T1 changes (in milliseconds) in response to the contrast agent injections (precontrast versus postcontrast) used as part of a DSC perfusion scan. Bookend perfusion scanning explicitly accounts for the intravascular-to-extravascular water exchange rates that can bias the quantitative values through careful modeling with a 2-compartment model included as a water correction factor. The T1 changes in normal-appearing white matter (WM T1) relative to the blood pool change measure during the distribution phase of the agent, qCBV in WM, independent of an arterial input function (Equation 1):
 where ρ represents average brain attenuation of 1.04 mL/g, and Kh = 0.74 is a constant used to correct for hematocrit between capillaries and arteries.16 WCF represents the water correction factor as defined in Equation 2 for WM in 1.5T field strength:
 where ΔR1 is the change in T1 of the blood because of gadolinium injection.
rCBF is computed by deconvolving tissue concentration–time curves and the arterial input function (AIF) by using singular value decomposition of the reformulation of Equation 3:
 where R(t) is the residue function17 and C(t) is tissue concentration at time t. rCBV is then obtained by calculating the ratio of the area under the curve of the tissue-concentration–time curve and the AIF. CBF values are then derived by using Equation 411,14,15:

Average perfusion values (CBF/CBV/MTT) were then calculated for every CL and WML by using the respective perfusion image. An empiric volume threshold of 3 voxels was chosen to eliminate small islands resulting from the automated lesion labeling algorithm and to account for the partial volume effect.2
Statistical Analysis
Univariate general linear and logistic regressions were performed to compare demographic, clinical, and volume data among 3 groups on all continuous outcomes and categoric variables, respectively. P < .017 (ie, .05/3) was considered significant to account for multiple comparisons.
The Lilliefors test confirmed the absence of normality of distribution of perfusion data. Median and interquartile range were calculated for the segmented tissues. The Wilcoxon rank sum test (Matlab) was used to compare NAGM and NAWM tissues across cognitively unimpaired and impaired patients with RRMS and the healthy GM and WM of controls, with corrected P < .017 identified as significantly different. Independent assessments were also performed by using the Wilcoxon rank sum test to compare lesion perfusion across disease groups and with the corresponding normal-appearing tissue within each patient group, with P < .05 as significantly different.
A dispersion metric for each lesion type was calculated after removal of outliers defined as 1.5× away from the first and third quartiles to quantify the degree of heterogeneity, calculated as the number of SDs encompassing the distribution of the corresponding perfusion parameter (Equation 5):
 where L corresponds to the lesion vector of interest and σ represents the SD of L.
Results
Of 39 patients with RRMS enrolled in the study, 20 (51.3%) met the criteria for cognitive impairment. The participant demographic and fractional brain volumes are listed in Table 1. WML, CL, NAWM, and NAGM perfusion values for each patient group and healthy controls are summarized in Table 2. Significant CBF and CBV reduction was observed in NAGM and NAWM in patients with impairment with relapsing-remitting MS (RRMS-I) compared with other groups. No MTT differences were observed between RRMS groups for NAWM, though NAGM was modestly prolonged in RRMS-I compared with patients without impairment with relapsing-remitting MS (RRMS-NI). NAGM CBF and CBV were significantly reduced and MTT was prolonged compared with healthy control GM for all comparisons except between healthy controls and RRMS-NI for CBV. NAWM CBF and CBV were significantly lower and MTT was prolonged between healthy controls and RRMS-I but not RRMS-NI. WMLs demonstrated significant CBF and CBV reduction compared with NAWM in patients with RRMS-NI (33% and 31%) and those with RRMS-I (26% and 23%), respectively. WMLs also demonstrated mild but significant MTT prolongation compared with NAWM in patients with RRMS-NI and RRMS-I. WML CBF and CBV in RRMS-I were significantly lower compared with RRMS-NI (Table 2). No absolute CL perfusion difference was present between RRMS-I and RRMS-NI, though both CBF and CBV were modestly elevated and MTT was prolonged in RRMS-I. CLs showed significant CBF and CBV reduction compared with NAGM for RRMS-NI (48% and 44%) and RRMS-I (27% and 19%), respectively. Significant MTT prolongation was present in CLs compared with NAGM for RRMS-I (15%).
Participant demographic data, neurocognitive scores, and fractional brain volumea
Comparison of perfusion parameters between study groupsa
Scatterplots of the average CBF and CBV for CL and WML are illustrated in Figs 3 and 4, respectively. Four classifiers are highlighted in each figure, including standard lesions (neither CBF nor CBV outliers), CBF outliers, CBV outliers, and CBV × CBF outliers. As expected, standard CLs and WMLs present similar CBF and CBV compared with the whole CL and WML analysis, respectively, for both RRMS groups (On-line Table 1). However, CBF outliers and CBV outliers showed higher median values. MTT outliers (not shown) demonstrated reduced WML perfusion for each group. No MTT outliers were present within RRMS-I. On-line Table 2 illustrates the dispersion of the perfusion values for each lesion for both RRMS groups, demonstrating smaller dispersion values for CLs compared with WMLs for each perfusion parameter.

Distribution of the absolute perfusion cortical lesion results in the construction of 4 different populations: Standard CL (neither CBF nor CBV outliers), CBF outliers, CBV outliers, and CBV-CBF outliers (CBV outliers that are also CBF outliers). Absolute values of cerebral blood flow and cerebral blood volume are reported on the x-axis and y-axis, respectively. Each RRMS-NI lesion (A) is represented by a circle, and RRMS-I lesion (B) is represented by a triangle.

Distribution of the absolute perfusion white matter lesion results in the construction of 4 different populations by using the interquartile range method: Standard WML (neither CBF nor CBV outliers), CBF outliers, CBV outliers, and CBV-CBF outliers (CBV outliers that are also CBF outliers). Absolute values of cerebral blood flow and cerebral blood volume are reported on the x-axis and y-axis, respectively. Each RRMS-NI lesion (A) is represented by circle, and RRMS-I lesion (B) is represented by a triangle.
Discussion
Progressive NAGM and NAWM CBF and CBV reduction was demonstrated with cognitive impairment. Significant differences were seen between both RRMS subgroups and healthy controls in all comparisons except for NAGM CBV between healthy controls and RRMS-NI and for all NAWM perfusion parameters between healthy controls and RRMS-NI. CL perfusion was not significantly different between RRMS subgroups. However, the CL/NAGM ratio was fallaciously lower in RRMS-I compared with RRMS-NI due to a greater NAGM than CL perfusion reduction, minimizing the difference between CL and NAGM perfusion. Similarly, despite significant WML/NAWM perfusion reduction between RRMS-NI and RRMS-I, the WML/NAWM ratios were also reduced with cognitive impairment. These findings underscore the limitations of using either NAWM or NAGM regions to normalize cortical lesion or white matter lesion perfusion values and emphasize the need for absolute perfusion measurement.2
Consistently larger reductions were measured within the NAWM and NAGM with cognitive impairment compared with WMLs and CLs, respectively. This finding highlights the importance of considering these apparently normal regions in addition to conventional structural and lesional parameters during the assessment of cognitive impairment in patients with MS.1,18,19 Our results are supported by previous studies demonstrating NAGM and NAWM perfusion abnormalities with MS disease progression and in cognitively impaired patients with RRMS.6,9,20 They also highlight the increasingly recognized role of perfusion as a surrogate of cognitive impairment.6 We demonstrate greater sensitivity of NAGM to cognitive impairment than NAWM with differences demonstrated between healthy control GM/WM and RRMS-NI only for NAGM. Indeed, a recent study using pseudocontinuous arterial spin-labeled/labeling perfusion found significant GM perfusion differences between healthy controls and patients with very early RRMS, independent of structural differences.9
The absence of CL CBF or CBV differences compared with WMLs between the RRMS subgroups is supported by histopathologic studies showing that unlike WMLs, there is little inflammatory infiltration, activation, or evidence for plasma protein extravasation in CLs.21⇓–23 This also explains the greater difficulty in prospective clinical identification of CLs on imaging such as double inversion recovery or FLAIR, because the more tightly packed cortical structures prevent fulminant inflammation and edema formation, which characterizes and assists in the visualization of WMLs.24⇓⇓–27 In support of this assertion, CLs were associated with less dispersion and fewer perfusion outliers than WMLs. The greater outliers in WMLs imply increased lesion perfusion heterogeneity and confirm different pathophysiologic mechanisms for CL and WML formation.3,28⇓⇓–31
CLs were identified by using phase-sensitive inversion recovery. Existing clinical and high-field-strength research imaging sequences detect a fraction of histopathologically identified lesions.30,31 Therefore, we cannot entirely exclude the presence of CLs within the so-called NAGM ROI. It could be argued that these lesions may account for the strength of NAGM differences presented. However, considering the voxelwise analytic approach, the total number of voxels constituting CLs is expected to be fractional compared with the total number of true NAGM voxels; therefore, we believe this contribution to be trivial. Only imaging-pathologic correlation studies could truly resolve this question. Another limitation of this work is the relatively low resolution of perfusion images in comparison with structural T1- and T2-weighted images, resulting in partial volume effects during structural-to-perfusion image registration, whereby CL and WML ROIs may be eliminated or altered in size. To address this issue, we applied volume thresholding of the registered segmentations; however, complete elimination of these artifacts is not possible. Future studies could use differences in perfusion characteristics between CLs and WMLs to prospectively identify and segment lesions on the native perfusion images.
GM abnormalities in MS could occur due to 2 underlying pathogenic mechanisms (primary GM damage and GM damage secondary to WM damage), which cumulatively contribute to degeneration of axons and GM demyelination.28 Primary GM abnormality may result from meningeal inflammation caused by soluble cytotoxic/myelinotoxic factors as demonstrated by Magliozzi et al,32 who depicted a spatial relation between ectopic meningeal B-cell follicles and a superficial-to-deep gradient of cortical pathology. GM neuroaxonal degeneration secondary to WM damage has been associated with a state of “virtual hypoxia” due to high adenosine triphosphate production caused by abnormal distribution of sodium channels in active white matter lesions, which are protein-positive for amyloid precursor.33,34 Excitotoxicity and axonal damage due to glutamate imbalance, discriminatory reaction to acetylcholinesterase inhibitor rivastigmine, and variation in firing patterns among different sodium channels have, furthermore, been thought to be involved in GM damage secondary to WM abnormality.35⇓–37 Perfusion abnormalities in the absence of structural anomalies have been previously observed in patients with RRMS without and with cognitive impairment.9,38 In a preceding study using the same patient cohort, we further demonstrated cortical perfusion reduction to be independent of white matter volume.38 These observations collectively suggest a primary vascular or mitochondrial disturbance as the most probable mechanism of GM abnormality in our patient cohort.
There remains a need for tools and techniques to assess the integrity of the cortex and to detect cortical lesions. Techniques that enable CL detection with high sensitivity and specificity could aid in better quantifying the relationship between CL and clinical outcomes such as physical/cognitive impairment and treatment effect. While only imaging-pathologic correlation studies could truly validate CL detection, the magnitude of 30%–50% perfusion differences between NAGM and CLs is very encouraging and provides ample signal for discrimination, unlike attempts in structural MR imaging. Future work includes the use of image-processing techniques such as texture analysis to enable better detection of CLs by exploiting the large NAGM/CL perfusion differences seen.39,40
Conclusions
Significant WML, CL, NAWM, and NAGM changes are present between healthy controls and cognitively impaired patients with RRMS. The greatest changes are present within NAGM and NAWM, necessitating absolute rather than relative lesion perfusion measurement.
Footnotes
Disclosures: Charlres G. Cantrell—RELATED: Grant: American Heart Association (14PRE20380810).* Anthony Feinstein—RELATED: Grant: MS Society of Canada*; UNRELATED: Payment for Lectures (including service on Speakers Bureaus): Merck Serono, Teva Neurosicences, Biogen, Novartis, Comments: Speaker's honoraria. Liesly Lee—UNRELATED: Consultancy: Novartis Canada, Biogen Canada, Genzyme, Serono, Canada, Teva Neurosciences, Comments: have served and given lectures for named companies associated with therapeutics in multiple sclerosis; Grants/Grants Pending: Site Principal Investigator for clinical trials with the following companies: Biogen Canada, Genzyme, Serono Canada, Teva Neurosciences, Novartis Canada; Payment for Development of Educational Presentations: Biogen Canada, Serono Canada, Novartis Canada, Comments: chairing educational venues in multiple sclerosis. *Money paid to the institution.
This study was supported by the Canadian Institute of Health Research operating grant 130366, the National Institutes of Health grant EB017928, the American Heart Association grants 20380798 and 14PRE20380810, and a Biogen fellowship funding award.
Indicates open access to non-subscribers at www.ajnr.org
References
- Received November 3, 2015.
- Accepted after revision January 12, 2016.
- © 2016 by American Journal of Neuroradiology


Jump to section
Related Articles
Cited By...
- No citing articles found.