
Abstract
BACKGROUND AND PURPOSE: There is an emerging need for biomarkers to better categorize clinical phenotypes and predict progression in amyotrophic lateral sclerosis. This study aimed to quantify cervical spinal gray matter atrophy in amyotrophic lateral sclerosis and investigate its association with clinical disability at baseline and after 1 year.
MATERIALS AND METHODS: Twenty-nine patients with amyotrophic lateral sclerosis and 22 healthy controls were scanned with 3T MR imaging. Standard functional scale was recorded at the time of MR imaging and after 1 year. MR imaging data were processed automatically to measure the spinal cord, gray matter, and white matter cross-sectional areas. A statistical analysis assessed the difference in cross-sectional areas between patients with amyotrophic lateral sclerosis and controls, correlations between spinal cord and gray matter atrophy to clinical disability at baseline and at 1 year, and prediction of clinical disability at 1 year.
RESULTS: Gray matter atrophy was more sensitive to discriminate patients with amyotrophic lateral sclerosis from controls (P = .004) compared with spinal cord atrophy (P = .02). Gray matter and spinal cord cross-sectional areas showed good correlations with clinical scores at baseline (R = 0.56 for gray matter and R = 0.55 for spinal cord; P < .01). Prediction at 1 year with clinical scores (R2 = 0.54) was improved when including a combination of gray matter and white matter cross-sectional areas (R2 = 0.74).
CONCLUSIONS: Although improvements over spinal cord cross-sectional areas were modest, this study suggests the potential use of gray matter cross-sectional areas as an MR imaging structural biomarker to monitor the evolution of amyotrophic lateral sclerosis.
ABBREVIATIONS:
- ALS
- amyotrophic lateral sclerosis
- ALSFRS-R
- arm-revised ALS Functional Rating Scale
- CSA
- cross-sectional area
- GMCSA
- gray matter cross-sectional area
- SC
- spinal cord
- SCCSA
- spinal cord cross-sectional area
Although amyotrophic lateral sclerosis (ALS) remains a relatively rare disease (median incidence rate was 2.08 per 100,000 in Europe for 2010,1 the loss of autonomy, short survival rate (median survival from onset, 23–52 months),1,2 and lack of proper treatment motivate the development of robust biomarkers to better categorize clinical phenotype and improve prognosis.3,4 Common clinical manifestations include muscle weakness or clumsiness, atrophy, cramps, fasciculations, dysphagia, dysarthria, and respiratory symptoms such as dyspnea, orthopnea, and respiratory failure.2 Because the clinical presentation and progression rate are highly heterogeneous,5 it remains challenging to identify the true biologic effects of drug testing in clinical trials. Exploring new processing methods and hypotheses would promote a greater understanding of the physiopathologic processes.6 In particular, imaging biomarkers of the spinal cord (SC) can potentially provide a relevant measure of the degeneration of lower motor neurons.3,4
A recent study showed that spinal cord cross-sectional area (SCCSA) measured with MR imaging improves prediction of the arm-revised ALS Functional Rating Scale (ALSFRS-R) subscore at 1 year.3 Another study7 established a strong link between SCCSA and the degeneration of lower motor neurons. The main limitation of these studies is that they looked at cord atrophy, hindering the separation of the specific contribution of GM and WM atrophy. Recent advances in analysis tools for segmenting the SC GM8 now permit such exploration.
The objective of the present study was to quantify spinal GM atrophy in ALS and to investigate its association with clinical disability at baseline and after 1 year.
Materials and Methods
Patients
Twenty-nine patients with ALS and 22 age-matched controls were recruited at the ALS Center of the Pitié-Salpêtrière Hospital in Paris, France. Patients with ALS were diagnosed with probable (n = 20), laboratory probable or definite (n = 9) ALS according to the El Escorial criteria.9 Exclusion criteria included important acute and chronic medical conditions interfering with the clinical evaluation, significant psychiatric or neurologic history (other than ALS for patients), and standard contraindications to MR imaging. Controls had no known neurologic disorder and no family history of neurologic diseases, and they were recruited to identify MR imaging markers in the SC that distinguish them from patients with ALS. The study was reviewed by the local ethics committee board, and written informed consent was obtained from each participant.
The following clinical assessments were conducted on patients with ALS: ALSFRS-R (total score and arm subscore [arm subscore included evaluation of handwriting, cutting food, and handling kitchen utensils]),10 manual muscle testing (7 proximal and distal muscles of the arm were tested) by using the Medical Research Council score. The progression rate at baseline of the ALSFRS-R score was defined as Δ by the following equation:
 where ALSFRSMax = 48, corresponding to the maximum ALSFRS-R score (ie, that of a healthy control); ALSFRSMRI is the ALSFRS-R score at the time of MR imaging; and τ is the delay (in months) between the first symptoms and the time of MR imaging. The progression rate Δ thus corresponds to the “speed” of the progression of the disease at the time of MR imaging (ie, baseline).
ALSFRS-R and manual muscle testing were performed on the same day as the MR imaging acquisition. Clinical evaluation was performed by an experienced neurologist specialized in ALS (P.-F.P., 15 years' experience).
One patient with ALS was excluded from the study because the MR imaging acquisition was interrupted for medical reasons, and 3 patients were excluded because of excessive motion during acquisition. The total number of patients used in this study was 25. Table 1 lists demographic data, Table 2 lists clinical data commonly used for prognosis, and Table 3 lists clinical scores at baseline and 1 year after.
Demographic data for the 25 patients with ALS and the 22 healthy controls
Clinical data commonly used as prognostic factors for the 25 patients with ALS
Clinical scoresa
MR Imaging Acquisition
Data were acquired on a 3T MR imaging system (Tim Trio; Siemens, Erlangen, Germany) by using the product 12-channel head, 4-channel neck, and the 3 most rostral elements of a spine coil for signal reception.
A 3D T2-weighted fast spin-echo sequence (sampling perfection with application-optimized contrasts by using different flip angle evolution, or SPACE) was acquired as an anatomic image for subsequent registration to a common template (see “Data Processing” section). Parameters were: TR, 1500 ms; TE, 120 ms; 52 sections; field of view, 280 × 280 mm2; voxel size, 0.9 × 0.9 × 0.9 mm3; acceleration factor, R = 2; and acquisition time, 3 minutes.
An axial 2D T2*-weighted multiecho gradient-echo sequence (multiecho data image combination, or MEDIC; Siemens proprietary sequence) was acquired for GM cross-sectional area (GMCSA) measurements thanks to the good white-to-gray matter contrast available in this type of sequence. Parameters were: TR, 470 ms; average TE, 17 ms; 23 sections; field of view, 180 × 180 mm2; voxel size, 0.7 × 0.7 × 3 mm3; acceleration factor, R = 2; acquisition time, 3 minutes; and intersection gap, 1.5 mm.
Acquisition parameters and .edx protocols can be downloaded from the Open Science Framework public repository (https://osf.io/9xkxx/).
Data Processing
All data were processed by using the open-source software Spinal Cord Toolbox v3.0.11 All processing commands are available at the Open Science Framework public repository. In brief, T2-weighted and T2*-weighted images were automatically registered to a common template image, which was generated in a previous study by averaging spinal cord MRIs from 50 adult subjects.12,13 The T2-weighted image was used to precisely identify vertebral levels, and the T2*-weighted image was used to automatically measure the GMCSA thanks to its good white-to-gray matter contrast. Figure 1 illustrates the processing pipeline, which can be broken down into 7 steps:
The spinal cord was automatically segmented by using “PropSeg”14 on T2-weighted and T2*-weighted images. Note that the segmentation was slightly manually corrected when needed.
The PAM50 template15 was registered to the T2-weighted anatomic data by using 3 consecutive steps: i) a section-wise rigid transformation (translation and rotation) based on the center of mass of the segmentations; ii) a nonrigid regularized registration by using the BSplineSyn algorithm16 based on cord segmentations; and iii) a nonrigid registration by using the SyN algorithm17 on the images (as implemented in Advanced Normalization Tools18).
The T2-weighted template registered into the T2-weighted anatomic space was then registered on the T2*-weighted image by using 3 consecutive steps: i) a section-wise regularized rigid registration19 based on cord segmentations; ii) a nonrigid regularized registration by using the BSplineSyn algorithm on cord segmentations; and iii) a nonrigid registration by using the SyN algorithm on the images.
Both registrations (template to T2-weighted and T2-weighted space to T2*-weighted) output forward- and backward-warping fields. Concatenating the 2 forward-warping fields allows for warping the template (and all its elements) into the T2*-weighted space (WARP[template to T2*]), and concatenating all the backwards-warping fields allows for warping the T2*-weighted image into the template space (WARP[T2* to template]). Here, we took advantage of the second concatenation (WARP[T2* to template]) to warp the T2*-weighted image and the automatic SC segmentation into the template space.
The GM was automatically segmented on the T2*-weighted image in the template space. The GM segmentation was performed by using the multiatlas-based segmentation method included in the Spinal Cord Toolbox.8 The automatic GM segmentation was visually assessed for all patients. A more thorough quantitative validation has been conducted in a previous study.8
The GM segmentation was warped back into the T2*-weighted space by using the forward-warping field (WARP[template to T2*]).
The SCCSA and GMCSA were computed in the T2*-weighted space. The area computed for each section was corrected for the curvature of the spine by using the angle of the section with the SC centerline. Note that the cross-sectional area (CSA) was not normalized across subjects, as further discussed in the “Methodologic Considerations” section.

Processing pipeline for the GM segmentation and computation of the GMCSA.
Statistical Analysis
Differences between Patients and Controls.
All statistical analyses were performed with Python 2.7. A 1-sample Kolmogorov-Smirnov test was used to confirm that SCCSA and GMCSA followed a Gaussian distribution within the patients and controls groups. Consequently, a 2-sample Student t test assessed potential CSA differences between the 2 groups.
Correlation between GM Atrophy and Clinical Disability at MR Imaging (Baseline) and at 1 Year After.
The association between spinal cord atrophy and clinical disability at baseline and at 1 year was investigated. The hypothesis was that atrophy of the cervical GM measured in MR imaging is associated with clinical outcome. At baseline, Pearson correlation coefficients between CSA of GM and SC and ALSFRS-R/manual muscle testing scores were computed. Similarly, Pearson correlation coefficients were computed between GMCSA and ALSFRS-R score and between SCCSA and ALSFRS-R score at 1 year after baseline with the 19 patients with ALS who were available to follow-up (referred to as the 1-year cohort). GMCSA and SCCSA values were averaged across the C4–C6 vertebral levels to be more specific with the arm subscore, which is associated with shoulder abduction (myotome C5), elbow flexion (myotome C6), and wrist extension (myotome C7).
Prediction of Clinical Disability at 1 Year After Baseline.
The prediction of clinical disability was performed on the 1-year cohort. Regression trees20 were used to evaluate the potential of MR imaging biomarkers to predict the total ALSFRS-R score at 1 year after MR imaging. Regression trees as used here are a supervised learning method aimed at predicting the ALSFRS-R score at 1 year by learning simple decision rules inferred from clinical predictors (sex, age, body mass index, site of onset, delay between first symptom and diagnosis, ALSFRS progression rate at baseline [see equation 1], and ALSFRS-R at baseline) and MR imaging measures. Several models were tested with 1) clinical predictors only; 2) clinical predictors and SCCSA; and 3) clinical predictors, GMCSA, and the ratio of WM CSA to GMCSA. MR imaging biomarkers were progressively added to the clinical predictors to test the impact of each MR imaging measure. The hypothesis was that at 1 year, the prediction score of disability would be higher when adding MR imaging measures at baseline to clinical predictors. Here, WM CSA was used instead of SCCSA to avoid colinearity between predictors (because SCCSA = WM CSA + GMCSA). As in the previous subsection, GMCSA and WM CSA values were averaged across the C4–C6 vertebral levels.
A leave-one-out cross-validation was performed to evaluate how each prediction model will generalize to a new dataset. A patient was randomly discarded from the list of patients, and a new prediction model was created from the remaining (n − 1) patients. From this model, we computed the prediction error, which is defined as the difference between the true and the predicted value of the ALSFRS-R score. This procedure was run 25 times, and the distribution of error was reported.
Results
Data Processing
The proposed processing pipeline was fully automatic. The results have been visually inspected by an experimented rater, and a manual correction was only needed for the SC segmentation of 8 patients with ALS out of the 47 processed subjects (22 controls and 25 patients). The correction took approximately 1 minute per subject and consisted of a slight manual adjustment of the SC segmentation on T2*-weighted images. The accuracy of the GM automatic segmentation has been validated in 5 randomly selected patients with ALS, with a Dice coefficient of 0.708. Figure 2 shows a visual illustration of the GM segmentation.
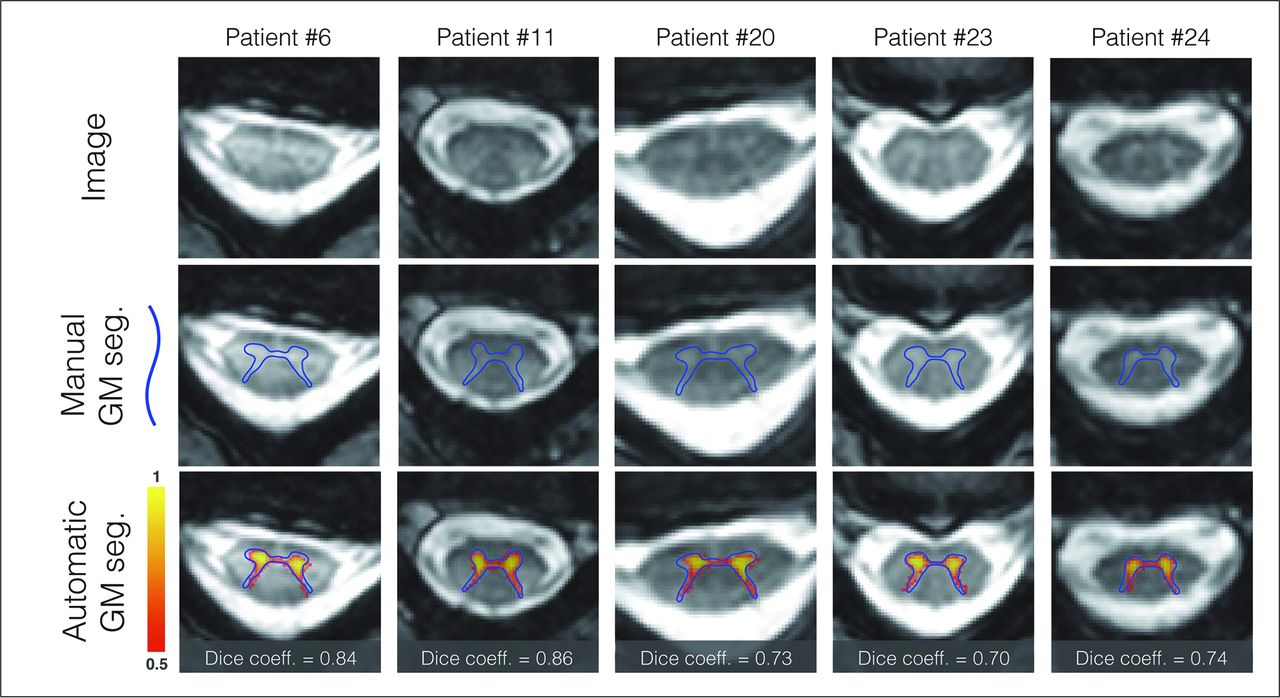
GM automatic segmentation and manual delineation patients with ALS. Manual delineation of the GM is displayed with the blue line, automatic probabilistic segmentation is shown in red-to-yellow. Dice coefficient comparing the automatic and manual segmentation is shown on the bottom line.
Differences between Patients and Controls
Figure 3 shows the average (± SD) of GMCSA (Fig 3A) and SCCSA (Fig 3B) in controls (blue) and patients with ALS (orange) across the SC cervical axis. Qualitatively, a larger difference between patients and controls is observed for GMCSA compared with SCCSA (7.2% difference for GMCSA versus 3.6% difference for SCCSA averaged between the C4–C6 vertebral levels, t test P values for each vertebral level are shown in Fig 3). Figure 4 shows a boxplot distribution of GMCSA and SCCSA averaged between the C4–C6 vertebral levels.

GMCSA and SCCSA measured on controls and patients with ALS between the C6–C3 vertebral levels. GMCSA (A) and SCCSA (B) averaged within group and plot against the cervical SC axis. Overall, a stronger intergroup difference can be observed for GMCSA. Asterisk (P ≤ .05) and double asterisk (P ≤ .01) at specific vertebral levels indicate significant differences between patients with ALS and controls according to Student t test P values representing control-to-patient differences in GMCSA and SCCSA for each cervical level between C6 and C3 and across levels.

Boxplot distribution of GMCSA (A) and SCCSA (B) averaged between the C4–C6 vertebral levels. Each dark point represents an individual value. The median is represented as a thick horizontal line and the interquartile range as a light rectangle. The horizontal bar at both extremities of the whiskers represent the 5th and 95th percentiles. The 2 patients presenting the SOD1 gene are identified in the plot.
Correlation between GM Atrophy and Clinical Disability at MR Imaging (Baseline) and at 1 Year After
A correlation study was performed between clinical disability (at baseline, then at 1 year after MR imaging) and MR imaging biomarkers of grouped vertebral levels (C4–C6) (Table 4). GMCSA and SCCSA measures revealed significant correlations with the ALSFRS-R subscore at baseline and at 1 year after, suggesting an association between cervical GM atrophy and clinical disability of the upper limbs at baseline as well as after 1 year. For the manual muscle testing arm subscore at baseline, significant correlations were only found for GMCSA, although P values between GMCSA and SCCSA were very close (.049 versus .054 [Table 4]).
Correlation coefficients between CSA (GM and SC) and clinical scores at baseline and at 1 yeara
Prediction of Clinical Disability at 1 Year After Baseline
The purpose of this analysis was to investigate the benefits of adding MR imaging biomarkers to clinical predictors in a generalizable model of clinical disability prediction.
Table 5 shows the results of regression trees between total ALSFRS-R score at 1 year after baseline and several predictors frequently used in practice, with or without MR imaging biomarkers. Figure 5 shows the distribution of the prediction error for the 3 prediction models based on a leave-one-out cross-validation, suggesting that the prediction model including MR imaging biomarkers results in a more accurate score prediction. The model including all the proposed MR imaging biomarkers predicted the ALSFRS-R score with an average error of 1.63 ± 8.42 versus 2.05 ± 12.97 with clinical predictors only.
Results of regression tree predictions to make prediction of total ALSFRS-R score at 1 year after MRI with several clinical and MRI predictorsa

Prediction error on the ALSFRS-R at 1 year, from a leave-one-out cross-validation with regression trees. Results are compared between the regression model including clinical predictors (left distribution plot), clinical predictors + SCCSA (middle distribution plot), and clinical predictors + GMCSA + WM/GMCSA (right distribution plot), where each point represents 1 iteration of the leave-one-out cross-validation. The best value is at 0.
Discussion
This study focused on using the CSA of the cervical SC GM in patients with ALS for 1) discriminating between patients with ALS and controls; 2) correlating CSA with clinical scores (ALSFRS-R and manual muscle testing); and 3) predicting clinical score (ALSFRS-R) at 1-year follow-up. The following subsections will compare our results with the previous literature and discuss their limitations and relevance for clinical implications.
GM Atrophy Detected in Patients with ALS
SCCSA exhibited significant differences between patients with ALS and healthy controls, confirming the results obtained by another study.3 More interestingly, GMCSA showed larger differences between the 2 groups (P = .004 for GMCSA versus .02 for SCCSA at the C4–C6 vertebral levels), suggesting that GMCSA is a more sensitive marker of atrophy in ALS and that cord atrophy in ALS is predominantly driven by lower motor neuron degeneration. Although WM is expected to degenerate as a secondary effect of upper motor neuron degeneration, gliosis and myelin debris forming in the SC WM might somewhat lower the sensitivity of global cord atrophy.21,22
In addition, the control-to-patient difference was larger at the C4–C6 vertebral level region (Fig 3), which is the site of large pools of motor neurons. Larger GM atrophy at the C4–C6 vertebral levels could be explained by a larger absolute number of atrophied motor neurons at this level and/or by a higher sensitivity of the MR imaging–based GMCSA measure at this level because of the increased size of the structure that facilitates delineation of the GM interface. Further studies covering a larger portion of the spinal cord would shed light on these possible explanations.
From a clinical perspective, having SCCSA and GMCSA highly correlated raises the question of the relevance of measuring GMCSA in patients with ALS as a diagnostic measure, especially given that it is more difficult to reliably measure GMCSA from standard clinical scans because of the need for high axial resolution and sufficient GM/WM contrast-to-noise. Nevertheless, having access to a more specific assessment of GM atrophy still has potential for monitoring the efficiency of new drugs, though this has not been tested here.
GM Atrophy Correlates with Clinical Disability at MR Imaging and 1 Year After
As shown in Table 4, GMCSA seems to be a relevant biomarker of clinical disability at vertebral levels C4–C6 (ALSFRS-R and manual muscle testing arm at baseline, P = .004 and P = .05, respectively; ALSFRS-R at 1 year, P = .03). SCCSA also reflected clinical disability as previously shown,3 though with lower sensitivity than GMCSA. A previous study7 established a strong link between SCCSA and lower motor neuron degeneration by relating motor-evoked potential amplitude of the adductor digiti minimi and deltoid, respectively, with cord atrophy at spinal levels C8 and C5 (here, it was not possible to study the C8 spinal level; see “Limitations” section). However, combining advanced image processing and better MR imaging pulse sequences is promising to investigate the effect of GM atrophy on muscle-specific deficits in the low thoracic and lumbar cord.23 The ability to isolate lower motor neuron from upper motor neuron contribution in ALS might provide additional information for understanding the pathogenesis of the disease.
Prediction of Clinical Disability at 1 Year After Baseline
A significant association was found between GMCSA (measured at baseline) and the ALSFRS-R score at 1 year after MR imaging acquisition (P = .03). However, it was not possible to perfectly fit a regression model to predict clinical disability at 1 year by using clinical biomarkers and MR imaging measures (CSA), which is challenging regarding the heterogeneity of the present ALS cohort in terms of clinical score and site of onset. The best prediction score was obtained by combining MR imaging measures (GM, WM, and ratio of WM CSA to GMCSA). Therefore, this suggests that the association of MR imaging measures could be helpful to predict the evolution of clinical disability for patients with ALS (R2 = 0.54 without versus R2 = 0.74 with MR imaging measures). Evaluated with a leave-one-out cross-validation, prediction accuracy and generalization were improved by including MR imaging biomarkers in the prediction model (error = 1.63 ± 8.42 with versus 2.05 ± 12.97 without MR imaging measures). More complex models such as deep learning would be a potential alternative to achieve a more specific prediction.24
Methodologic Considerations
Classical Bias in ALS Studies.
Because patients with ALS with heavy respiratory symptoms could not be recruited for the study, a lack of external validity needs to be pointed out. By recruiting subjects in a less drastic state (from a medical standpoint), a certain selection bias takes place that limits generalization to the whole ALS population and affects the power of the study. Moreover, the recruited population included mostly probable patients with ALS (n = 18) and only a few definite patients with ALS (n = 7), which may have introduced heterogeneity in the tested ALS population and thus impacted the statistical analyses. However, further analysis performed with the 18 probable patients with ALS led to a correlation between GMCSA and ALSFRS-R of R = 0.61 and P = .006 (versus R = 0.56 and P = .004 when including all patients with ALS).
Vertebral Levels.
Establishing a vertebral region that maximizes atrophy across patients with ALS was not feasible here because of the large interpatient variability. Consequently, statistical analyses were conducted for each vertebral level between C3–C6. The average CSAs across the C4–C6 vertebral levels was also studied to maximize the sensitivity to clinical markers of the brachial plexus.
In comparison with previous works,3 which included levels C2–T6, the present study only focused on the cervical region from C3–C6 because of the poor quality of the T2*-weighted images below C6 caused by respiratory-related dynamic B0 field variations.25 Thus, the exclusion of the C7 vertebral level slightly restricted the study of the hand muscle deficit.7 Moreover, the exclusion of the lumbar and thoracic regions (unavailable in the T2*-weighted images) precluded studying the correlation between GMCSA and the total ALSFRS-R score, which includes a clinical evaluation of the lower limbs. Optimized MR imaging sequences now provide the possibility to image the thoracic and lumbar GM with satisfactory quality23 and should be investigated in future studies.
Measuring CSA with MR Imaging.
Being able to measure spinal GM atrophy has potential applications in other diseases, such as spinal muscular atrophy.26 Furthermore, an original aspect of the present study is the fully automatic segmentation of the cord and its GM, providing minimum user bias and facilitating the reproducibility of the current technique to other centers (software and processing scripts were made freely available). Previous studies have validated the accuracy of these segmentation methods for the SC14,27 and the GM,8,28 including in patients with multiple sclerosis and degenerative cervical myelopathy.28 In particular, the GM segmentation used in this study resorts to nonlinear deformations to match the shape of atrophic cord exhibited by patients with ALS. The accuracy has been further validated in the present study in 5 randomly selected patients with ALS and showed satisfactory results (Dice coefficient in the GM = 0.708) in comparison with healthy controls from a previous study8 (Dice coefficient in the GM = 0.711).
Whereas previous studies have reported that the CSA of the SC is associated with morphologic features such as brain volume29 and total intracranial volume,30 the correlations were mild, and there is no clear consensus as to what is the best normalization method to use31; several published studies have not performed CSA normalization,3,26,31⇓–33 and neither did we in the present study. Future work could further investigate methods for normalization, and specifically for the GMCSA.
As investigated in a previous study,30 age and sex could affect both SC and GMCSA. In the present study, the controls and patients were age-matched but not sex-matched (number of women, 6 with ALS versus 11 controls). However, the larger proportion of women in the control group would in fact decrease the sensitivity to detect a CSA difference between controls and patients, given that both SC and GM are smaller in women compared with men.30
Although it would have been relevant to measure CSA in the lateral and anterior funiculi, the current MR imaging protocol, which is based on T2*-weighted contrast, made it impossible to distinguish the anterior and lateral fasciculus from the rest of the WM tissue. Therefore, it was not feasible to measure specific CSAs of these tracts from our data. Recent work combining multiparametric MR imaging at an ultra-high field showed promising results for isolating specific SC tracts, opening the door to such evaluation.34
Conclusions
Gray matter atrophy as measured noninvasively with MR imaging correlates with clinical disability in ALS at baseline and at 1-year follow-up. Although efforts toward the development of sensitive and reliable biomarkers for ALS need to be pursued and confirmed in larger cohorts, the present study offers an encouraging incentive about the relevance of spinal cord gray matter cross-sectional area. This article includes a downloadable link to the MR imaging acquisition and processing protocol to enable other researchers to reproduce the entirety of the analysis performed here. We believe these efforts are critical not only for transparency, but also for standardizing spinal cord imaging biomarkers to help assess their reliability and make them more amenable to clinicians.
Acknowledgments
We would like to acknowledge all members of the NeuroPoly Lab, especially Benjamin De Leener and Gabriel Mangeat for the useful discussions, and Dominique Eden for the English review. This study was supported by the Association Française contre les Myopathies-Téléthon (AFM-Téléthon) and the Institut pour la Recherche sur la Moelle épinière et l'Encéphale (IRME). The research leading to these results has also received funding from the program “Investissements d'Avenir” ANR-10-IAIHU-06. We thank the neurologists of the Paris ALS center who participated in the recruitment of the patients in the study: Drs. Nadine Le Forestier, Vincent Meininger, Gaelle Bruneteau; François Salachas, Maria del Mar Amador, and Rabab Debs. We thank Sophie Blancho (IRME) for her help in the management and coordination of the study. We deeply thank the subjects who participated in this research.
Footnotes
Disclosures: Marie-Êve Paquin—RELATED: Grant: Canada Research Chair in Quantitative Magnetic Resonance Imaging (JCA), Canadian Institute of Health Research (CIHR FDN-143263), Canada Foundation for Innovation (32454), Fonds de Recherche du Québec – Santé (28826), Fonds de Recherche du Québec – Nature et Technologies (2015-PR-182754), Natural Sciences and Engineering Research Council of Canada (435897-2013), Quebec BioImaging Network*. Mohamed M. El Mendili—RELATED: Grant: Association Française contre les Myopathies-Téléthon (AFM-Téléthon), Institut pour la Recherche sur la Moelle épinière et l'Encéphale (IRME), program “Investissements d'Avenir” ANR-10-IAIHU-06, Comments: The funders had no role in study design, data collection and analysis, decision to publish, or preparation of the manuscript*. Charley Gros—RELATED: Grant: Canada Research Chair in Quantitative Magnetic Resonance Imaging (JCA), Canadian Institute of Health Research (CIHR FDN-143263), Canada Foundation for Innovation (32454), Fonds de Recherche du Québec – Santé (28826), Fonds de Recherche du Québec – Nature et Technologies (2015-PR-182754), Natural Sciences and Engineering Research Council of Canada (435897-2013), Quebec BioImaging Network*. Sara Dupont—RELATED: Grant: Canada Research Chair in Quantitative Magnetic Resonance Imaging (JCA), Canadian Institute of Health Research, (CIHR FDN-143263), Canada Foundation for Innovation (32454), Fonds de Recherche du Québec – Santé (28826), Fonds de Recherche du Québec – Nature et Technologies (2015-PR-182754), Natural Sciences and Engineering Research Council of Canada (435897-2013), Quebec BioImaging Network*. Julien Cohen-Adad—RELATED: Grant: Canadian Institutes of Health Research*. *Money paid to the institution.
This work was supported by the Canada Research Chair in Quantitative Magnetic Resonance Imaging (J.C.-A.), the Canadian Institute of Health Research (CIHR FDN-143263), the Canada Foundation for Innovation (32454), the Fonds de Recherche du Québec - Santé (28826), the Fonds de Recherche du Québec – Nature et Technologies (2015-PR-182754), the Natural Sciences and Engineering Research Council of Canada (435897-2013), the Quebec BioImaging Network and the Association Française contre les Myopathies, the Institut pour la Recherche sur la Moelle épinière et l'Encéphale, and the “Investissements d'avenir” (ANR-10-IAIHU-06).
Indicates open access to non-subscribers at www.ajnr.org
References
- Received March 30, 2017.
- Accepted after revision August 17, 2017.
- © 2018 by American Journal of Neuroradiology


Jump to section
Related Articles
Cited By...
- Improved Inter-Subject Alignment of the Lumbosacral Cord for Group-Level In Vivo Gray and White Matter Assessments: A Scan-Rescan MRI Study at 3T
- Reduced Spinal Cord Gray Matter in Patients with Fibromyalgia Using Opioids Long-term
- DeepRetroMoCo: Deep neural network-based Retrospective Motion Correction Algorithm for Spinal Cord functional MRI
- Spinal Cord Gray and White Matter Damage in Different Hereditary Spastic Paraplegia Subtypes
- What are the gray and white matter volumes of the human spinal cord?
- Automatic Spinal Cord Gray Matter Quantification: A Novel Approach