
Article Figures & Data
Figures
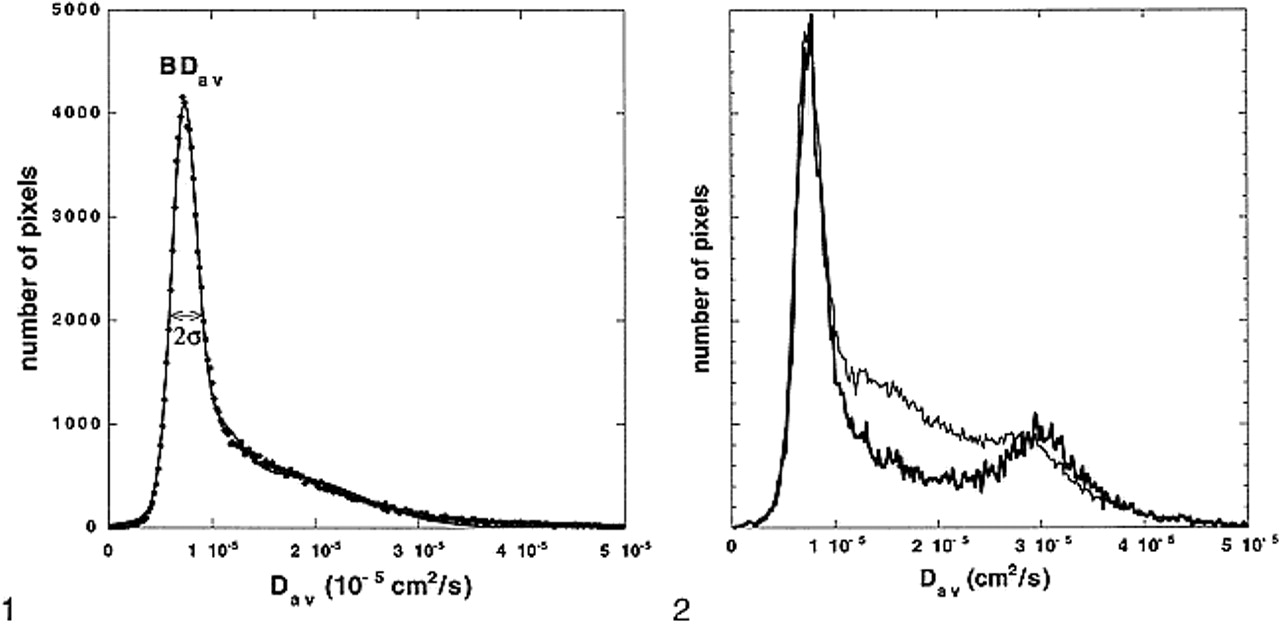
- fig 1.
Whole-brain–diffusion-constant distribution map (diffusion histogram) from a healthy volunteer. The data (dots) are fitted with a triple gaussian function to accommodate the two-compartment nature of the data and the mixing between two compartments (solid curve). The brain tissue compartment has a narrow distribution of values around its mean. The second and third compartments have broader distributions. The mean of the brain tissue pixel distribution (also mode of the entire distribution) is recognized as a mean diffusion constant for the entire brain (BDav). The distribution width (σ) of the brain tissue compartment is also recorded. fig 2. BDav histograms from an 86-year-old subject with age-appropriate atrophy. The thicker curve is the Dav histogram from three slices through the lateral ventricles. The tissue peak (around 0.75 × 10⁻⁵ cm2/s) and the CSF peak (around 3.2 × 10⁻⁵ cm2/s) are well separated. The thinner curve is the whole-brain Dav histogram. The location of the tissue peaks in both histograms did not change, demonstrating that the tissue peak is truly free of CSF contamination. The histograms are scaled so that the tissue peaks are the same height
- fig 3.
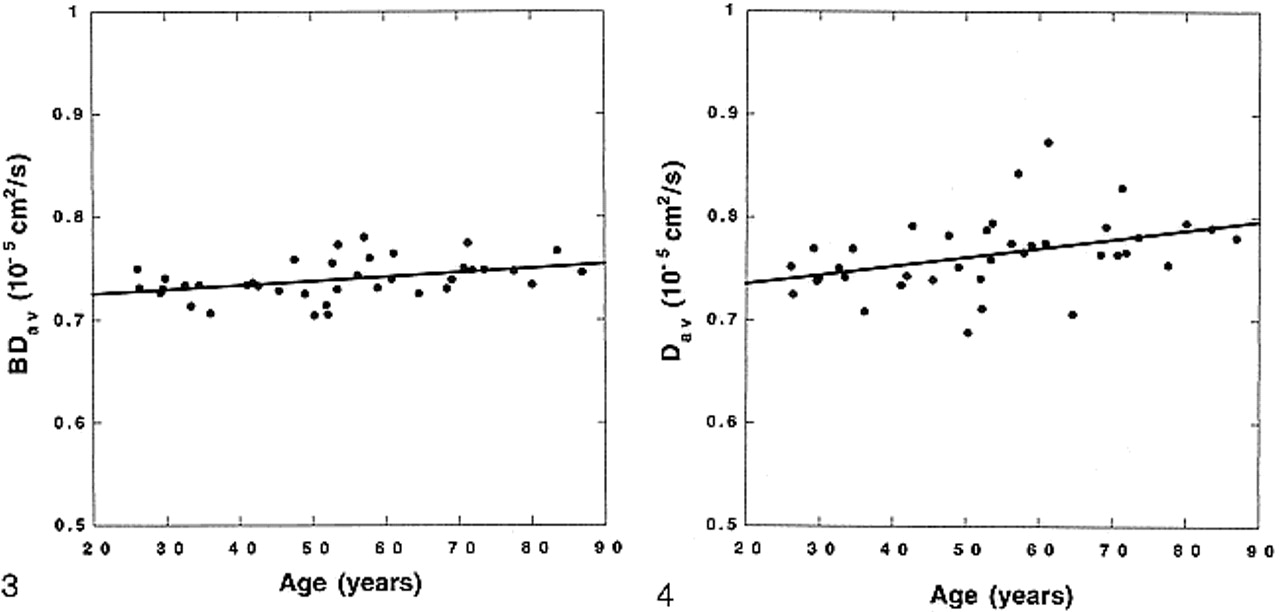
The brain diffusion constants (circles) measured from distribution maps are plotted against age of the subjects. A linear fit to the data (solid line) is also shown (BDav = 0.717 + 0.000421 × Age, r = 0.383, P < .05). Age dependency of the data is minimal. fig 4. The diffusion constants determined from ROI measurements of the periventricular white matter (circles) are plotted against age of the subjects. There is a significant increase with respect to age. A linear fit to the data (solid line) is also shown (Dav = 0.718 + 0.000876 × Age, r = 0.406, P < .015)
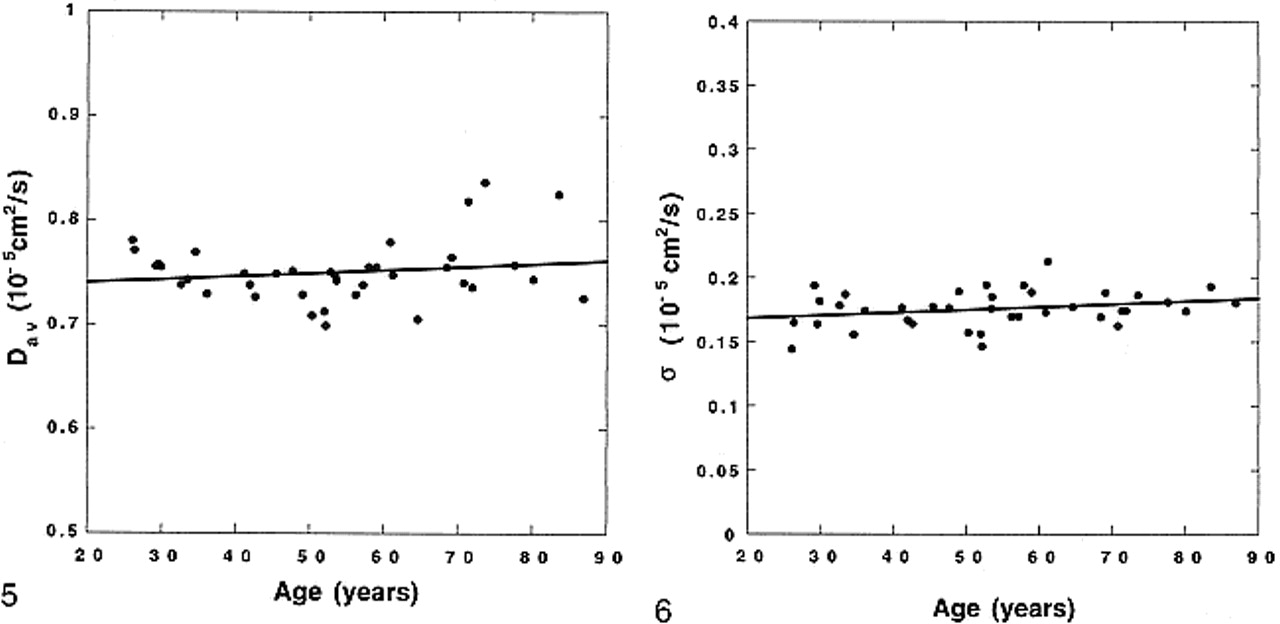
- fig 5.
The diffusion constants measured from the thalamus (circles) by using ROIs are plotted against age of the subjects. Data do not show age dependency. A linear fit to data (solid line) is also shown (Dav = 0.734 + 0.000301 × Age, r = 0.174, P > .29). fig 6. The distribution width (σ) of the brain diffusion constants measured from distribution maps (circles) are plotted against age of the subjects. Data do not show age dependency. A linear fit to the data (solid line) is also shown (σ = 0.163 + 0.000227 × Age, r = 0.274, P > .10).

Tables
 TABLE 1:
Average diffusion measurements for the study population (n = 38) (age range 26–86 years, mean 53.4 ± 17.0 years)
- TABLE 2:
Average diffusion measurements between subjects 60+ years and subjects younger than 60 years
In this issue


Jump to section
Related Articles
Cited By...
- Differential Diagnosis of Normal Pressure Hydrocephalus by MRI Mean Diffusivity Histogram Analysis
- The Effect of Age and Cerebral Ischemia on Diffusion-Weighted Proton MR Spectroscopy of the Human Brain
- Neuroradiological characterization of normal adult ageing
- Effect of Region of Interest on Interobserver Variance in Apparent Diffusion Coefficient Measures
- Diffusion Imaging in Obstructive Hydrocephalus
- Diffusion-weighted imaging discriminates progressive supranuclear palsy from PD, but not from the parkinson variant of multiple system atrophy