
Abstract
BACKGROUND AND PURPOSE: Movements of the participant during blood oxygen level–dependent (BOLD) functional MR imaging cerebral activation studies are known to produce occasionally regions of false activation, especially when these movements are relatively large (>3 mm) and highly correlated with the stimulus. We investigated whether minimal (<1 mm), weakly correlated movements in a controlled functional MR imaging model could produce false activation artifacts that could potentially mimic regions of true activation in size, location, and statistical significance.
METHODS: A life-size brain phantom was constructed by embedding vials of a dilute carboxylic acid solution within a gadolinium-doped gelatin mold. Imaging was performed at 1.5 T using a 2D spiral sequence (3000/5 [TR/TE]; flip angle, 88°; matrix, 64 × 64; field of view, 24 cm; section thickness, 5 mm). Controlled, in-plane, submillimeter movements of the phantom were generated using a pneumatic system and were made to correlate with a hypothetical “boxcar” stimulus over the range 0.31 < r < 0.96. Regions of false activation were sought using standard statistical methods (SPM96) that excluded phantom edges and accounted for spatial extent (regions tested at P < .05, corrected for multiple comparisons). A similar experiment was performed on a resting volunteer.
RESULTS: The pneumatic system provided motion control with average in-plane displacements and rotations of 0.74 mm and 0.47°, respectively, in the 18 data sets analyzed. No areas of false activation in the phantom were identified for poorly correlated motions (r < 0.52). Above this level, false activations occurred with increasing frequency, scaling in size and number with the degree of motion correlation. For motions with r > 0.67, areas of false activation were seen in every experiment. For a statistical threshold of P = .001, the median number of falsely activated regions was 3.5, with a mean size of 71.7 voxels (approximately 5 cc). Areas of possibly false activation of average size 72.5 voxels resulting from passive motion of the resting human participant were observed in two of four experiments.
CONCLUSION: Participant movements of 1 mm or less that are only modestly correlated with a blocked stimulus paradigm can produce appreciable false activation artifacts on BOLD functional MR imaging studies, even when strict image realignment methods are used to prevent them.
Functional MR imaging of brain activation using blood oxygen level-dependent (BOLD) contrast is now widely used for a variety of clinical and research purposes. Although functional MR imaging techniques vary somewhat from center to center, they generally share the following features: a task or stimulus paradigm, typically in block design with alternating “off” and “on” cycles; data acquisition using echo-planar imaging; an image realignment procedure to compensate for interimage head motion (1, 2); and correlation or regression analysis (3, 4) to identify voxels where the functional MR imaging signal is influenced by the stimulus.
Several investigators have recognized that stimulus- or task-correlated motions of a participant can produce artifacts on functional MR imaging activation maps that may simulate cerebral activation (5–8). Typically, areas of false activation occur with relatively large movements (>3 mm) that are highly correlated with the stimulus. Obvious, large-amplitude, stimulus-correlated motions in functional MR imaging experiments can generally be prevented or their effects minimized through various image realignment procedures; however, these methods are not perfect, and many technical and theoretical questions remain. Are very-low-amplitude movements (eg, <1 mm) capable of producing false activation? How strongly correlated with the stimulus must participant motion be before such false activation will occur? Can false activation mimic genuine cerebral activation in terms of location and spatial extent?
Although these important questions are highly relevant to the interpretation of functional MR imaging studies in human participants, they are extremely difficult to answer through in vivo experiments. Specifically, functional MR imaging experiments with living participants might generate coexisting areas of true and false activation that would be impossible to differentiate from one another. We therefore set out to investigate the nature of stimulus-correlated motion artifacts using a specially constructed brain phantom moved in a controlled fashion by a pneumatic system during conventional functional MR imaging. Specifically, our experiments were designed to test whether very low-amplitude, in-plane displacements (<1 mm of translation or 1 degree of rotation) could produce areas of spurious activation in the phantom that could potentially mimic genuine cerebral activation in size and location. Furthermore, we sought to determine how correlated these motions needed to be to produce areas of false activation that would survive conventional realignment and statistical parametric mapping analyses.
Methods
Phantom Construction
A brain phantom (Fig 1) was constructed by using a life-size (19 × 16 × 10 cm), brain-shaped, plastic mold (SKS Sibley Co., El Segundo, CA). The mold was filled with a dilute aqueous solution of ox gelatin (7 g of Knox Gelatin [Nabisco, Inc., East Hanover, NJ] in 1 cup of water), which was heated to 65°C for 10 min and allowed to cool to room temperature (9). To shorten T1 values to the range of normal brain (ie, 800–900 ms), gadopentetate dimeglumine was added at a concentration of 0.1 mM. Formaldehyde (2 cc) was also added to inhibit the growth of bacteria. Embedded within the gelatin core were seven thin-walled plastic tubes (outer diameter, 3.2 cm; length, 5 cm), each containing approximately 35 cc of Liqui-gel (Ivory, Procter and Gamble, Cincinnati, OH). Liqui-gel is a dilute aqueous solution of carboxylic acid salts (principally sodium laureth and lauryl sulfates), chosen because of its subtle contrast with the gadolinium-doped gelatin background on functional MR images (Fig 2).

Gel-filled brain phantom. A, Anterior view and B, posterior view

T1-weighted (top) and functional MR (bottom) images of the brain phantom
Imaging Protocol
Experiments were performed on a 1.5-T GE Echo-speed Horizon LX imager with a bird-cage head coil (GE Medical Systems, Milwaukee, WI). After positioning the phantom in the imager, a T1-weighted spin-echo sequence (500/20 [TR/TE]; matrix, 256 × 192; field of view, 24 cm; section thickness,6 mm; section gap, 3 mm; number of sections, 11) was obtained in the sagittal plane for section localization. Functional imaging consisted of the rapid, sequential collection of multiple sections using a 2D spiral sequence (10). The sequence uses a double-lobe sinc RF excitation pulse that generates a sharp section profile with a 4.8-mm full-width half-maximum section thickness when 5-mm sections are prescribed (11). The overlap ratio of each section with its two adjacent sections was approximately 14%, minimal for imaging contiguous sections with no gap. The readout trajectory was a single-shot spiral that was designed to use peak gradient amplitude and slew rate for maximum efficiency. Twenty-eight sections were obtained within a TR of 3000. The functional MR imaging parameters were as follows: 3000/5; flip angle, 88°; matrix, 64 × 64; field of view, 24 cm; section thickness, 5 mm; with no gap between sections.
After two dummy shots to achieve steady-state magnetization were obtained, a total of 61 frames were acquired in 183 s, under the movement protocol described below. Data were transferred to a remote workstation (SPARCserver 1000E; Sun Microsystems, Inc., Mountain View, CA) for off-line image reconstruction. The spiral data were first gridded onto Cartesian coordinates, and then a 2D Fourier transform was applied to the gridded data to reconstruct images. Images of the first time frame were reconstructed but excluded from functional MR imaging data analysis because they were acquired at a slightly shifted TE for phase calculation in the spiral data reconstruction to correct for Bo-field inhomogeneity.
Experimental Design
A pneumatic system for generating controlled, very low-amplitude, positional displacements of the brain phantom within the imager was developed as follows. The inflatable rubber liner was removed from a conventional blood-pressure cuff (Sunbeam Home Comfort, Schaumburg, IL) and fitted with extension tubing and a three-way stopcock. The liner was positioned along the posterolateral surface of the phantom (with respect to the usual position of a patient in the imager), such that inflation and deflation would impart in-plane translations and rotations to the phantom. Together they were anchored at the approximate isocenter of the head coil by foam padding, which was positioned to prevent significant through-plane movement while allowing very limited in-plane movements. Phantom displacements were generated by manually inflating and deflating the system with approximately 16 to 20 cc of air. After some practice, we were able to produce controlled, in-plane translations and rotations of approximately 1 mm and 1° or less, with a desired time course.
We subjected the phantom to a series of functional MR imaging experiments designed around a standard, blocked paradigm of six alternating off and on epochs of 30 s each, for a total of 3 min per experiment. The TR of 3000 resulted in 10 image volumes per epoch. In lieu of an actual stimulus, we applied in-plane positional displacements of approximately 1 mm, with a time course designed to have a predetermined level of correlation (coefficients ranging from 0.3 to 1.0) with the boxcar reference waveform. Thirty experiments were performed, including six control experiments in which no movement was applied. Of these, six experiments were discarded because of phantom displacements that were poorly controlled (in-plane motion >1.5 mm; through-plane motion >0.2 mm or more correlated than in-plane motion with boxcar reference). The data from a total of 24 experiments were analyzed.
Using the same experimental protocol as that described for the phantom, a series of four experiments was performed on a 36-year-old, healthy volunteer under a protocol approved by our Institutional Review Board. The participant was instructed to relax and to try to avoid any motor or cognitive functioning while in the imager. No stimulus was applied other than passive movement of the participant's head. Moderate levels of stimulus-motion correlation (0.60 < r < 0.75) were used for these experiments.
Statistical Analysis
The functional MR imaging data were processed with SPM96 analysis software (Wellcome Department of Cognitive Neurology, Institute of Neurology, Queen Square, London, England), running under MATLAB version 4.2c (The MathWorks, Inc., Natick, MA). The rationale for the statistical methods used by SPM96 are detailed in several articles (2, 4, 12) and a textbook (13).
Sixty image volumes were processed per imaging sequence. Each was smoothed by convolving with a gaussian kernel of twice the voxel size to increase the image signal-to-noise ratio and condition the data for making inferences from statistical parametric maps. Phantom displacements were determined by a least-squares analysis of each imaging time series, resulting in six motion parameters (three translations and three rotations). The correlation between each of these parameters and the boxcar reference waveform was calculated. A 3D, rigid-body transformation was then applied along with sinc interpolation to reorient and resample the image volumes within each image, using the first image volume as the reference. The signal time series at each voxel was then temporally smoothed using a 2.8-s gaussian kernel to increase the signal-to-noise ratio and condition the autocorrelations in the data, thereby allowing a statistically valid regression analysis in the presence of serially correlated data.
Focal regions of motion-induced, false activation were sought using linear regression on a voxel-by-voxel basis. The boxcar reference waveform, lagged by 6 s and temporally smoothed to approximate the hemodynamic response of a human participant, served as the predictor variable. To minimize the effects of signal drifts and aliased physiological noise, three low-frequency cosine functions were included as covariates in the regression, effectively high-pass filtering the data at a cut-off frequency of one half that of the hypothetical stimulus waveform (0.008 Hz). Statistical parametric maps were constructed from t statistics on the regression coefficients, after converting to standard normal Z scores.
Determining the number and extent of activated regions in the phantom was performed in a fashion identical to that typically used in experiments with humans, a two-step procedure available in the SPM96 analysis package based on gaussian random field theory (summarized in the Appendix). An arbitrary threshold is first applied to the map; clusters of contiguous voxels where the Z scores exceed this threshold are then tested for significance by calculating the chance probability of obtaining a cluster that exceeds the chosen threshold and is as large or larger than the cluster in question. This probability is corrected for the multiple, non-independent comparisons implicit in the analysis and then checked against the level of statistical significance chosen for the study.
Two different Z thresholds were applied to obtain clusters from each map; each cluster was then tested for significance at the P < .05 level. The lower Z threshold corresponded to a P value of .005 (Z = 2.56) and the higher Z threshold to a P value of .001 (Z = 3.09). The use of both high and low Z thresholds was intended to maximize statistical power for detecting sharp and broad peaks, respectively, in the Z maps (12). The number and spatial extent of significant clusters were recorded separately for the two different Z thresholds. A cluster was excluded if it was considered unlikely to mimic true activation because of its size (<10 or >300 voxels) or location (maximum Z value located within two voxels of the air-phantom boundary).
Results
The phantom-pneumatic system provided motion control with average in-plane translations (mean ± SD) of 0.74 ± 0.36 mm, through-plane translations of 0.01 ± 0.08 mm, and rotations around the x (pitch), y (roll), and z (yaw) axes of 0.24 ± 0.05°, 0.02 ± 0.06°, and 0.47 ± 0.42°, respectively. For all experiments, in-plane translation and yaw were the dominant movements as intended, showing higher amplitudes and levels of correlation with the boxcar reference than the through-plane parameters. There was generally close agreement between the intended and observed levels of stimulus-motion correlation, with coefficients (r) ranging from 0.31 to 0.96. Control experiments showed negligible displacements that tended to drift linearly with maximum amplitudes near the lower limit detectable by the realignment algorithm (2) (approximately 0.01 mm). Example phantom movements are shown in Figure 3.
Example of six motion parameters (three translation and three rotation) as determined by the realignment algorithm in response to a step-function displacement. Note that movements are virtually all in-plane (translation in x and y, rotation about z), with translations and rotations limited to less than 1 mm and less than 1 degree, respectively. The highest correlation with the boxcar reference waveform (r = 0.52) is for rotation about z (in-plane). The abscissae are scaled in frames, with TR = 3 s/frame
The number of voxels subjected to statistical analysis for each phantom image was 20569 ± 78 (mean ± SD), a number comparable with that used in parametric map studies of activation in humans. There were no regions of false activation identified for motions with r < 0.52, at either the low or high Z thresholds (Fig 4). False activations occurred in every experiment with r > 0.67, irrespective of the threshold. The number and sizes of significant regions varied slightly with the threshold (Fig 5), with the expected trend toward fewer and larger regions at the lower threshold and greater numbers of smaller regions at the higher threshold. However, the results remained consistent with respect to the likelihood of observing false activation at a particular level of correlation. Among experiments with r > 0.67, the lower Z threshold resulted in a median of two activated regions per experiment with an average size of 119 voxels (8.4 cc); at the higher threshold, the median was 3.5 regions with an average size of 71 voxels (5.0 cc).
Numbers of falsely activated regions (at P < .05, corrected for multiple comparisons), excluding phantom edges and regions larger than 300 voxels, plotted against the maximum coefficient of correlation between motion and boxcar reference for each experiment. Each experiment is plotted twice, with a circle and triangle representing the low (P = .005) and high (P = .001) thresholds, respectively, applied to statistical parametric maps. There are 12 data points at the origin representing the six control experiments. Note that for correlations of r < 0.52, no areas of false activation were seen. For r > 0.67, false activation was observed in every experiment. Clusters became more coalescent at higher correlations; this explains the apparent lack of correlation between cluster number and r.
Sizes of falsely activated regions (at P < .05, corrected for multiple comparisons), excluding phantom edges and regions larger than 300 voxels, plotted against the maximum coefficient of correlation between motion and boxcar reference for each experiment. There are six data points at the origin on each plot, representing the six control experiments.
A, Plots for low (P = .005) thresholds applied to statistical parametric maps.
B, Plots for high (P = .001) thresholds applied to statistical parametric maps.
Regions of false activation tended to be located in the vicinity of a boundary between the gelatin and the embedded vials, which corresponded to regions of slightly different magnetic susceptibilities. However, the configurations of the activated areas frequently did not conform to the shape of the boundary, such that they would not be easily recognized as artifact in an actual functional MR imaging study. Several examples of falsely activated regions are shown in Figure 6.
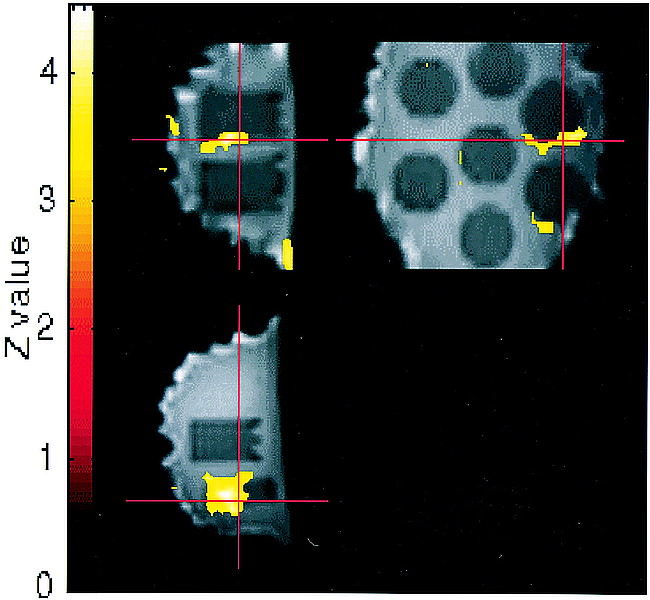
Activation maps overlaid onto functional MR images in sagittal (upper left), axial (lower left), and coronal (upper right) planes for an experiment with r = 0.70. Clusters were obtained from the statistical parametric map at a threshold of P = .001 (Z = 3.09). Crosshairs point to a 159-voxel region of false activation significant at P < .05, corrected for multiple comparisons. A second significant region of false activation is seen in the lower right on the coronal image. Several “activated” regions seen along the air-phantom edges were excluded from cluster counts (several of these smaller surface artifacts project over the center of the coronal image but do not lie within the middle of the phantom and are not counted). Functional MR imaging pulse sequence: 2D spiral; 3000/5; flip angle, 88°
In our four experiments with a resting human participant subjected to passive head movements, displacements were slightly larger than average for the phantom but remained less than ±2 mm/0.5° in-plane and ±0.2 mm/0.3° through-plane. Correlation with the boxcar reference ranged from 0.64 to 0.75. The mean number of voxels subjected to statistical analysis was 19437 (±458 SD), similar to the phantom. Activation was identified in two experiments using the lower Z threshold (one region per experiment; 55 and 90 voxels [3.9 and 6.3 cc, respectively]) and in one experiment using the higher threshold (one region of 24 voxels [1.7 cc]). These regions appeared to be located in cerebral cortex (Fig 7).

Activation map overlaid onto functional MR images in axial (top) and coronal (bottom) planes for a resting human volunteer subjected to passive, in-plane head motion (correlation of motion with boxcar reference, r = 0.75). Local activation is seen in left parietal cortex. Is this an area of motion-induced false activation? Functional MR imaging pulse sequence: 2D spiral; 3000/5; flip angle, 88°
Discussion
Several investigators have reported that patient motion during BOLD functional MR imaging cerebral activation studies occasionally produces regions of false activation, especially when these movements are relatively large (>3 mm) and highly correlated with the stimulus (5–8, 14). Conversely, motion artifacts may potentially obscure areas of true activation (5). To overcome these problems, most functional MR imaging studies include some means to limit or detect head motion, such as a bite bar (15), review of images in cine mode (16), and/or image realignment procedures coupled with correlative statistical analyses (1, 2). Our experiments confirmed and expanded these earlier results while raising some potentially troubling issues for the interpretation of individual cerebral activation studies.
First, we have shown that very low amplitude motions (<1 mm of translation or 1 degree rotation in-plane) are capable of causing areas of false activation that survive both image realignment and careful statistical analysis in functional MR imaging experiments. Such small degrees of motion are virtually impossible to prevent, even with highly cooperative participants, notwithstanding the use of bite bars, masks, or other restraining devices. Moreover, brain pulsations secondary to the vascular pulse wave routinely create periodic displacements of intracranial structures of approximately 1 mm or more.
The best current realignment algorithms used to process functional MR imaging data are known to be fallible in correcting for patient motion (5). Although several data processing strategies for overcoming these limitations have been proposed (5, 14), an optimal solution has not yet been found and nearly all published functional MR imaging studies to date do not use additional adjustments to correct for motion. Analyzing the functional MR imaging signal from several falsely activated voxels (Fig 8), we commonly observed a subtle but highly correlated signal shift as a function of displacement that was not removed by our standard image realignment algorithm. Therefore, the areas of false activation seen in many of our data sets can be explained by failure of the algorithm to correct for even submillimeter displacements fully.
Functional MR imaging signal at a falsely activated voxel, after realignment and temporal smoothing, is shown along with the x-translation vector (same experiment as that shown in fig 3). Failure of the realignment algorithm to correct fully for motion effects is clearly evident. (The abscissa is scaled in frames, with TR = 3 s/frame. The MR signal intensity scale is arbitrary, with approximately 2% change from lowest to highest value.)
Second, we have shown that motions that are only modestly correlated (r > 0.52) with the stimulus can also produce false activation artifacts. To illustrate how such partially correlated motions might occur within the context of a functional MR imaging experiment, we performed numerical simulations of representative participant motions in response to an on-off (boxcar) stimulus paradigm (Fig 9). In this hypothetical three-cycle experiment, we noted that a simple, brief “startle response” with rapid return to baseline position after each stimulus produced a correlation coefficient of only 0.33, inadequate to be manifest as a stimulus-correlated motion artifact in our experiments. A step response or partial response to at least two of the three stimuli, however, produced correlation coefficients of sufficient magnitude (r > 0.52) to generate false activations. A full response with time delay between stimulus and motion (not shown in the diagram) could also produce correlation coefficients in the troubling range of r = 0.5 to 0.9.

Examples of theoretical head movements with their correlations to a three-cycle on-off (boxcar) stimulus. (The abscissa is scaled in frames, with TR = 3 s/frame.)
Considering the complex temporal dynamics of both cerebral activation and human head motion, one might ask whether the false activations resulting from artificial, square, wavelike phantom motions have relevance to actual functional MR imaging experiments with humans. We think that unless the experimental paradigm and statistical analysis are specifically designed to exploit the differences in temporal dynamics between activation and motion (17), these results are relevant. Motion and activation waveforms need not be idealized square-wave functions for their correlations to be relatively high, as evidenced by our finding false activations even with the reference waveform delayed by 6 s, and temporally smoothed, in the regression analysis. Furthermore, stimulus-motion correlations as high as those in this study are not rare in our experience with human participants, particularly for motor tasks.
Of course, the range of correlations at which false activations become likely will depend on the specific task paradigm and analysis method. Therefore, no simple solution to this partial correlation issue can be stated. The use of “single-trial” or “event-related” paradigms may be useful for distinguishing partially correlated motion effects from brain activation on the basis of temporal dynamics (17). Alternatively, a blocked paradigm may be used as long as the investigator takes care to check the correlation between motion parameters and whatever reference waveform is used in a correlation/regression analysis. The results of our study suggest that the degree of correlation between stimulus and motion is likely to be more important than the amplitude of motion in determining whether a false activation may occur.
Third, we have shown that false activation resulting from stimulus-correlated motion can mimic genuine activation in terms of location and spatial extent. Specifically, we excluded from our results any clusters of falsely activated voxels that were either too small, too large, or too close to the air-phantom boundary to be misinterpreted as real. Although the size and location criteria that we applied were necessarily somewhat arbitrary, it is clear from our results that one cannot assume that false activations will be recognizable as such on activation maps.
The results of our study support and extend the work of others who have investigated functional MR imaging motion artifacts. Hajnal et al (7) found false activations resulting from small displacements in volunteers subjected to visual and motor functional MR imaging paradigms; Wu et al (8) used a motion-control system to produce false activations in a phantom, cadaver brain, and human volunteers. It is important to note that in these previous studies, activation was sought using either subtraction or simple t tests applied to composite “control” and “activation” images. This approach is very different in its sensitivity to motion than more current methods of correlative analysis based on functional MR imaging time series, which are more robust and are preferred to the earlier methods (3). Our study shows that stimulus-correlated motion remains an important problem despite the use of more sophisticated postprocessing.
In all functional MR imaging experiments, there is a trade-off between sensitivity and specificity in detecting cerebral activation. It is possible to remove all motion-correlated signal changes completely by using high levels of filtering and data processing (5, 14). When using these techniques, however, some or all of the true activation being sought will also likely be removed. Moreover, investigators may be justifiably reluctant to apply additional processing to their data when the exact nature of motion effects on functional MR imaging data are not completely understood and there is no consensus regarding how to correct for them.
Whether motion effects will confound data analysis in a particular study will depend on the extent to which a stimulus influences participant motion, the sensitivity of the BOLD signal to whatever motion occurs, and the effectiveness of the realignment procedure in correcting the images. Obviously, stimulus-correlated motion will not pose a problem if it has no appreciable effect on the measured signal or if the alignment procedure adequately corrects for such an effect. Similarly, false activation will not result from a suboptimal alignment procedure if participant movement is not sufficiently correlated with the stimulus.
Finally, we freely acknowledge the numerous methodological limitations inherent in a study such as this. Our phantom provided a well-controlled model that was fairly similar to brain in size, shape, and tissue contrast on functional MR images, with no possibility for true activation to confound the results. On the other hand, the phantom was not identical to brain in its structure or chemical composition. Although no visible distortions at the edges of the embedded vials were observed in the images, the gelatin-plastic-gel interfaces likely introduced microscopic susceptibility distortions potentially responsible for generating motion-correlated artifacts. The relatively higher water content of the phantom as compared with human brain and its different coil loading properties might have rendered a higher signal-to-noise ratio that could make it more sensitive to motion effects than a human participant would be (8).
Although the gelatin and carboxylic salt solutions used in the phantom contained small numbers of macromolecules with chemical shifts different from water, the only resonance peak observed in our experiment came from water protons. No chemical shifts within either compartment could be detected on any images. It seems therefore, that the macromolecules in our phantom were of such low concentration that they were dominated by the water resonance and could not be independently recognized on the overall MR signal. Rather, these macromolecules served to alter indirectly the relaxation times of water protons via cross-relaxation and dipole-dipole interactions, similar to the actions of macromolecules in real human tissues. Such effects have been long recognized based on previous research in similar gel-based tissue phantoms (18, 19).
Our pneumatic motion control system enabled submillimeter, in-plane displacements as determined by the SPM96 realignment algorithm, which is a widely used technique that has been shown to be robust down to 0.01 mm (2). Although the accuracy of this type of image registration in the presence of local task activations has been disputed (20), the phantom had no true activation to compromise the algorithm. It is conceivable that slight motion associated with inflation of the pneumatic system outside the field of view could have perturbed the spatial configuration of the magnetic field to produce correlated signal changes (21); we think, however, that this effect would be negligible compared with that of motion of the phantom itself.
We purposely limited the scope of our investigation to in-plane displacements, which we thought would be less dependent on the specific imaging parameters than would through-plane motion. Because the movements of a human participant will generally include both in- and through-plane displacements, the effects of the latter constitute an important area for future studies. It should also be noted that our conclusions may not be applicable to other pulse sequences, such as 3D or echo-planar acquisitions, which may have different sensitivities to participant movements.
The limited experiments with humans that we included in the study illustrate the problems in performing and interpreting motion effects studies in a living participant. Specifically, in vivo functional MR imaging experiments such as this may contain coexisting areas of true and false activation that would be impossible to differentiate from one another. Regarding human participation in our study (Fig 7), we cannot be certain whether each small area of cortical activation observed was false activation, similar to those generated in the phantom by stimulus-correlated movement, a true resting activation of the brain incidentally correlated with the stimulus, or a true activation in response to sensory stimulus of the air bag. To avoid these complex interpretative issues, we took refuge in a phantom model, which, despite its limitations, could be more carefully controlled.
Conclusion
In summary, participant movements of 1 mm or less that are only modestly correlated with stimuli can produce appreciable false activation artifacts on BOLD functional MR images, even when strict realignment algorithms and statistical techniques are used to exclude them. The degree of correlation between stimulus and motion may be more important than the magnitude of motion in creating these artifacts.
Appendix
Statistical Parametric Mapping Theory
Because of the size and complexity of the data sets generated in BOLD functional MR imaging cerebral activation experiments, sophisticated statistical methods must be used to extract meaningful results. Unfortunately, no consensus has yet been reached concerning the optimal method to detect brain activation. Popular techniques (3, 22–27) include image subtraction, statistical parametric mapping, nonparametric (Kolmogorow-Smirnov) mapping, principal component analysis, fuzzy data clustering, eigenimage analysis, contiguity thresholds, and Fourier transform methods.
Statistical parametric mapping techniques are among the most widely used, and a relatively complete theory of their properties has been developed (12, 13, 28). In this appendix, we define several terms used in our analysis and briefly review the mathematical concepts from which they are derived.
The statistical parametric mapping technique we used was developed by Friston, Worsely, and colleagues in the mid-1990s. It is an extension of 3D data analysis methods used in nuclear medicine and electrophysiology, based on a general block design statistical model known as MANCOVA (multiple analysis of covariance). A powerful statistical principle (the Central Limit Theorem) allows us to transform data sets obtained in functional MR imaging experiments into multidimensional gaussian (normal) distributions. This transformed data (a gaussian field) can then be subjected to tests of statistical inference using Z scores, t tests, F tests, and χ2 tests, similar to those used in simple univariate statistics.
To define the global level of statistical significance (P value) for analysis of a single functional MR imaging activation experiment, we define the null hypothesis (Ho) to be “No activation is present.” By setting the global P = .05 in our study, we are stating that the Type I statistical error should be no higher than 5%. In other words, when no true activation is present, we should only mistakenly conclude that a region has been falsely activated by chance less than 5% of the time. (Individual voxels are actually subjected to more stringent P values, generally of approximately P = .001. The global P = .05 figure includes a Bonferroni-like correction for the fact that multiple comparisons of many thousands of voxels are involved in the actual analysis.)
The mathematical analysis defining various conditional probabilities associated with a statistical parametric mapping is extremely complex, involving many terms and variables. Some of the variables (V and W) are defined intrinsically by the functional MR imaging experiment. Other variables (Z) involve somewhat arbitrary decisions by the operator based on perceived levels of clinical significance described below. The basic variables are as follows: V, the total number of voxels analyzed in the sample (approximately 20000 voxels in our phantom); W, a measure of smoothness of the statistical parametric map, calculated by spatial autocorrelation methods from the data; C, the size, in voxels, constituting a region to be tested for significant activation; Z, the minimum acceptable Z score defining threshold activation of a voxel.
As shown by Friston et al (12), the optimum threshold (Z) depends on the shape of the statistical parametric map. As a general rule, broader peaks in a map are best detected by low thresholds and sharp focal peaks are best detected by high thresholds. Based on published recommendations and our own experience, we analyzed each data set using two Z thresholds (Z = 3.09 and Z = 2.56), corresponding to P values of .001 and .005, respectively.
With these terms defined, we can now write an expression for the probability of making a Type I statistical error under the null hypothesis. Specifically, the probability, P, of finding at least one cluster of size C or larger to be falsely activated by chance can be written as follows:where  In these expressions, exp, Γ, and erf stand for the exponential, gamma, and error functions, respectively.
Acknowledgments
We thank Drs. Donald Gage, Timothy Morgan, William O’Neill, and the SPM Users Discussion Group for helpful discussions; Marcia Field for help with phantom construction; the Biomedical Communications Department for preparation of the figures; and the MRI technologists for working our experiments into their busy schedules.
Footnotes
↵1 Address reprint requests to Aaron S. Field, MD, PhD, Division of Radiologic Sciences, Wake Forest University School of Medicine, Medical Center Boulevard, Winston-Salem, NC 27157.
References
- Received January 18, 2000.
- Accepted after revision March 27, 2000.
- Copyright © American Society of Neuroradiology
In this issue


Jump to section
Related Articles
Cited By...
- Denoising task-correlated head motion from motor-task fMRI data with multi-echo ICA
- Head motion during fMRI tasks is reduced in children and adults if participants take breaks
- Improved motion correction of submillimetre 7T fMRI time series with boundary-based registration (BBR)
- Prospective Motion correction improves the sensitivity of fMRI pattern decoding
- Reduction of Motion Artifacts and Noise Using Independent Component Analysis in Task-Based Functional MRI for Preoperative Planning in Patients with Brain Tumor