
Abstract
BACKGROUND AND PURPOSE: After bolus injection, gadopentetate dimeglumine causes a T2* rate change in permeable tissue that is contaminated by the T1 shortening effect due to the leakage of contrast agent. Therefore, tumor vascularity as reported in previous single-echo perfusion-weighted MR imaging studies has been underestimated. Our aim was to quantitatively and qualitatively evaluate the degree of blood volume of glioblastoma multiformes (GBMs) underestimated by this T1 shortening effect.
METHODS: We used double-echo dynamic MR imaging after a bolus injection of gadopentetate dimeglumine (double-echo perfusion-weighted MR imaging) to simultaneously determine tumor blood volume without (VT1U) and with (VT1C) T1 shortening correction. MR imaging was performed in five consecutive patients with GBMs. The ratios of VT1U and VT1C were calculated and compared by means of quantitative analysis. The degree of tumor blood volume as determined by VT1U and VT1C maps were qualitatively compared using a three-point scale.
RESULTS: All GBMs showed contrast enhancement on postcontrast T1-weighted images. In all subjects, the values of VT1U were significantly lower than those of VT1C (mean ± SD, 2.05 ± 1.01 vs. 3.62 ± 1.40, respectively [P < .05]), indicating that tumor blood volume obtained by double-echo perfusion-weighted MR imaging was significantly higher than that by single-echo imaging. In the qualitative analysis, tumor blood volume on the VT1U map was less conspicuous than that on the VT1C map.
CONCLUSION: Careful attention should be paid to the underestimation of tumor blood volume resulting from T1 shortening effects when using single-echo perfusion-weighted MR imaging. Double-echo imaging may be more suitable for the analysis of blood volume in GBMs.
Studies of human neoplasms have shown that increased malignancy is associated with increased vascularity (1). The degree of vascular proliferation is an important parameter in determining the biological aggressiveness and histopathologic grading of an astrocytoma (2). Leon et al (3) reported that the density of microvessels is a prognostic indicator for patients with astroglial brain tumors. The degree of vascular proliferation is one of the most important parameters in determining the histopathologic grade of astrocytomas, along with the degree of cellular or nuclear pleomorphism and the presence or absence of necrosis (4). Thus, it is recognized that the more malignant the astrocytoma, the greater the degree of vascular hyperplasia.
Contrast agents, such as gadopentetate dimeglumine, in the vascular space cause a signal intensity decrease on perfusion-weighted MR images resulting from the decreased homogeneity of local magnetic fields (T2* shortening effect). This characteristic, which is used to semiquantitatively evaluate tumor vascularity (5, 6), cannot be provided by conventional MR imaging. The T2* shortening effect offers a functional parameter for assessing glioma grade and regions of focal activity (7–9), information that may be important in determining treatment strategies (10–14).
Although an examination of vascularity is useful for characterizing brain tumors, tumor vessels are different from normal blood vessels of the brain in that they do not usually express the properties of an intact blood-brain barrier. Therefore, after bolus injection, a T2* rate change caused by intravascular gadopentetate dimeglumine in a brain tumor is usually contaminated by the T1 shortening effect due to leakage of the contrast agent. Consequently, tumor vascularity as reported in previous studies with single-echo perfusion-weighted MR imaging may be underestimated.
The usefulness of double-echo perfusion-weighted MR imaging in the evaluation of the blood volume of brain tumors, such as meningiomas and neurinomas, has been reported (15, 16). It has been found that blood volume as determined by double-echo perfusion-weighted MR imaging is higher than that determined by single-echo imaging. Although glioblastomas may differ in barrier function of tumor vessels from that of extraaxial tumors, such as meningiomas and neurinomas, double-echo perfusion-weighted MR imaging may show a significant difference in the blood volume of glioblastomas as compared with that seen by single-echo imaging.
Our aim was to quantitatively and qualitatively evaluate how much vascularity is underestimated in glioblastomas by the T1 shortening effect due to the leakage of contrast material.
Methods
Theory
In previous studies with single-echo perfusion-weighted MR imaging (5–13), uncorrected tumor blood volume (VT1U) contaminated by the T1 shortening effect due to the leakage of contrast agent can be estimated by the T2* shortening effect of the intravascular contrast agent (ΔR2*T1U) by using the following equation, fitted with a gamma function to eliminate the second-pass effect (17):  where S represents the signal intensity at time t, S0 the signal intensity before the arrival of the contrast agent, and TE the echo time. This T1 shortening effect can be corrected by the application of the double-echo technique (15, 16). The corrected tumor blood volume (VT1C) can be estimated by means of the T2* shortening effect of the intravascular contrast agent, which is corrected by application of the double-echo technique (ΔR2*T1C) using the following equation (double-echo perfusion-weighted MR imaging):
  where S1 and S2 represent the signal intensity of the first echo time (TE1) and the second echo time (TE2), respectively, and R2*pre is the T2* rate before the arrival of the contrast agent.
Subjects
Human studies were performed under the guidelines of the Fukui Medical University Hospital Committee on clinical investigations. Written informed consent was obtained from all patients. Five consecutive patients (four men and one woman, 37–83 years old) with glioblastoma multiformes (GBMs) were examined. Two of the five patients with GBMs were examined twice on different days. In all cases, the histologic diagnosis was verified by means of surgical resection. One patient had previously undergone surgical resection followed by irradiation and chemotherapy for a GBM of the right frontal lobe. The maximum diameters of the GBMs ranged from 2.8 to 6.0 cm (mean, 4.16 cm).
MR Imaging Protocol
Axial T1-weighted spin-echo images (333/10/3 [TR/TE/excitations]) and T2-weighted fast spin-echo images (3500/88/2) were obtained before the dynamic study on a 1.5-T MR system using a rectangular 22 × 16-cm field of view, a 256 × 224 matrix, and a 5-mm slice thickness.
For the dynamic studies, we used two echoes with TEs of 7 and 23 ms of a spoiled gradient-recalled acquisition (SPGR) sequence (33.3/7, 23/0.75) with a 10° flip angle, a 256 × 128 matrix, a 7-mm slice thickness, and a rectangular 24 × 16-cm field of view. The slice displaying the largest solid portion was selected by the neuroradiologist from the information obtained from these spin-echo MR images. The apparent hemorrhagic portion was not selected. After five images were acquired, 0.15 mmol/kg body weight gadopentetate dimeglumine was rapidly injected intravenously at a rate of 4 mL/s with an MR-compatible power injector (MRS-50; Nemoto, Tokyo, Japan), followed by a 20-mL saline flush. After bolus administration of the contrast agent, a dynamic series of 50 sets of double-echo images were obtained at 2.4-second intervals. For this sequence, the total acquisition time was approximately 2 minutes. After the dynamic studies, we also obtained contrast-enhanced T1-weighted spin-echo images.
Data Processing
MR images were transferred to a Sun workstation (Ultra1 Creator 3D; Sun Microsystems, Mountain View, CA) for postprocessing. For qualitative analysis, parametric maps of VT1U and VT1C were generated for each subject by using in-house software. On a pixel-by-pixel basis, the signal intensity was converted to changes in ΔR2*T1C and ΔR2*T1U. We used a simple numerical integration of time-ΔR2*T1C and ΔR2*T1U curves instead of gamma fitting (17), because gamma fitting on a pixel-by-pixel basis is difficult owing to the relatively low signal-to-noise ratio of the dynamic images. One neuroradiologist visually determined when the ΔR2*T1U curve reached zero, and this was considered the end point of the curve for a VT1U map. The end point for the integration of the time-ΔR2*T1C curve was chosen according to regions-of-interest analysis.
Two experienced neuroradiologists qualitatively compared the degree of tumor blood volume by using only VT1U and VT1C maps. A consensus was reached if there was disagreement. The degree of tumor blood volume was rated on a three-point scale as follows: 1 = tumor blood volume on the VT1C map was definitely more prominent than that on the VT1U map, 2 = tumor blood volume on the VT1C map was equivalent to that on the VT1U map, and 3 = tumor blood volume on the VT1U map was definitely more prominent than that on the VT1C map.
For quantitative analysis, regions of interest were placed in the solid portion of the tumors and in the contralateral white matter on the SPGR images. The time series of signal intensity of SPGR images were converted to time-ΔR2*T1U and ΔR2*T1C curves. Gamma fitting (17) of time-ΔR2*T1U and ΔR2*T1C curves was performed to generate the values of VT1U and VT1C. However, because the time-ΔR2*T1U curve showed concentration values below zero during and after the passage of contrast agent, owing to its leakage into an interstitial space, we used only sections of the curve with concentration levels above zero to perform the gamma fitting. The end point for integration was determined by gamma fitting. VT1U and VT1C were normalized by blood volumes of the contralateral white matter.
A statistical review of VT1U and VT1C was done with the Wilcoxon signed rank test, in which a P value of less than .05 was considered to be statistically significant.
Results
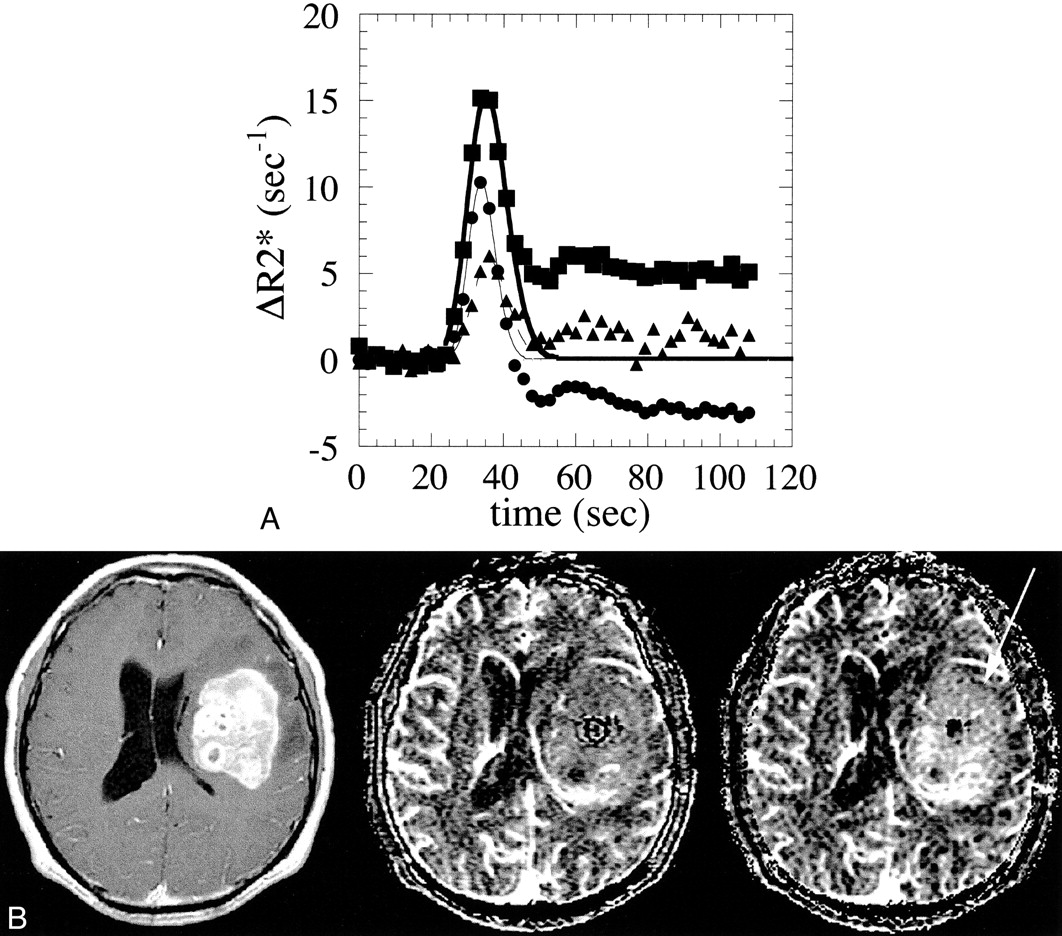
In this study, all GBMs showed contrast enhancement on postcontrast T1-weighted MR images (Figs 1 and 2). As shown in Figure 1A, a GBM was characterized by a high ΔR2*T1C curve and a relatively lower ΔR2*T1U curve, resulting in a lower VT1U compared with VT1C. The time-ΔR2*T1C and ΔR2*T1U curves of normal white matter were almost identical in all subjects. For quantitative analysis, the mean VT1U of the GBMs was significantly lower than the mean VT1C (mean ± SD, 2.05 ± 1.01 for VT1U vs. 3.62 ± 1.40 for VT1C; P < .05).

Case 2: 54-year-old man with a GBM.
A, Time course of the ΔR2* values of the GBM and normal white matter. The ΔR2*T1C values of the GBM are represented by solid squares and its gamma-fitted curve by a thick line; ΔR2*T1U is represented by solid circles and its gamma-fitted curve a thin line. The ΔR2*T1C values of normal white matter are represented by solid triangles and its gamma-fitted curve by a dashed line.
B, A stereotactic biopsy was performed before the MR study. A transaxial section of a contrast-enhanced T1-weighted (333/10/3) spin-echo image is shown on the left, the corresponding VT1U map is in the middle, and the VT1C map is on the right. The GBM shows nonhomogeneously dense contrast enhancement in the left frontotemporal lobe. Note that blood volume of the tumor is much more prominent on the VT1C map (arrow) than on the VT1U map. The qualitative analysis was rated as 1 in this case. The VT1U/VT1C ratio is 0.41.

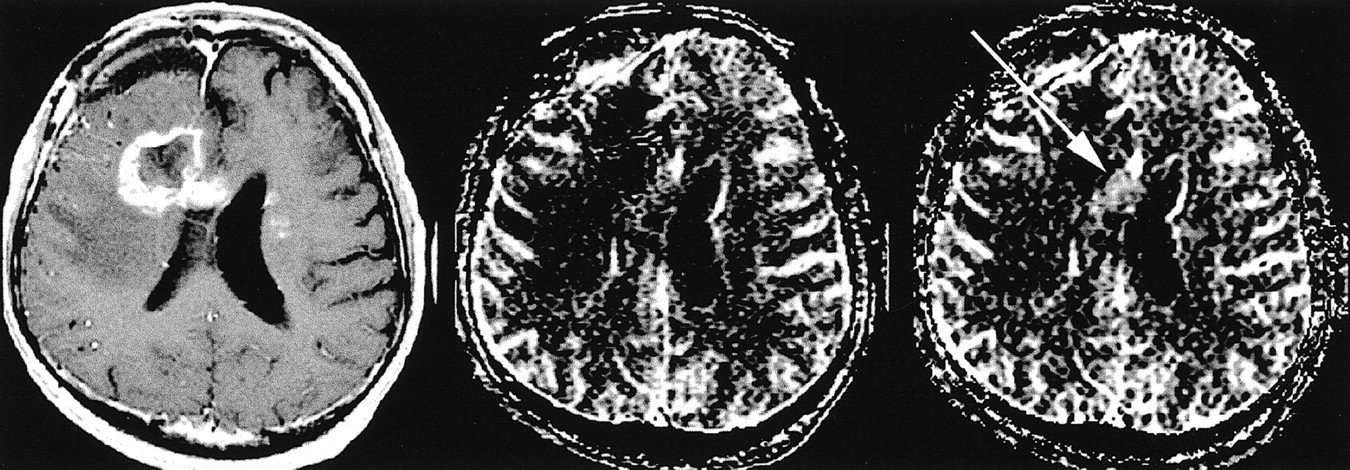
Case 5: 37-year-old man with a GBM who had previously undergone surgical resection, irradiation, and chemotherapy for a GBM of the right frontal lobe. Recently, a recurrent tumor was found on follow-up CT studies. A transaxial section of a contrast-enhanced T1-weighted spin-echo MR image (333/10/3) is shown on the left, a corresponding VT1U map is in the middle, and the VT1C map is on the right. The recurrent GBM shows dense contrast enhancement in the right frontal lobe, extending to the corpus callosum. Small, enhanced foci are also depicted in the left frontal lobe. Note that the lesion in the corpus callosum is depicted as an area of hypervascular blood volume on the VT1C map (arrow), and the blood volume of this lesion is similar to that of gray matter on the VT1U map, indicating the tumor blood volume is underestimated on the VT1U map. The qualitative analysis was rated as 1 in this case. The VT1U/VT1C ratio is 0.64
As shown in Figures 1B and 2, tumor blood volume on the VT1C map was definitely more prominent than that on the VT1U map in four patients. The results of the qualitative and quantitative analysis are summarized in the Table.
Results of quantitative and qualitative analysis of blood volume in GBMs
Discussion
Recent MR techniques have enabled the assessment of blood volume in brain tumors (5–16). Estimations of vascularity have relied on tissue characterization, preoperative assessment of tumor grade, radiation treatment planning, and subsequent follow-up care of patients with malignant gliomas. Aronen et al (7), Sugahara et al (8), and Knopp et al (9) reported that tumor blood volume was significantly different between low- and high-grade gliomas as measured on single-echo perfusion-weighted MR images. Although examination of the vascularity of a brain tumor is useful for characterizing grades of gliomas, tumor vessels are different from normal blood vessels of the brain in that they do not usually express intact blood-brain barrier functions. Therefore, after bolus injection, gadopentetate dimeglumine causes a T1 shortening effect due to the leakage of contrast material into the tumor tissue as well as a T2* rate change in the tumor vessels on single-echo perfusion-weighted MR images.
Our findings showed that VT1U was significantly lower than VT1C in GBMs, suggesting that tumor blood volume is underestimated by single-echo perfusion-weighted MR imaging. Regional tumor blood volume information has been used in targeting areas for stereotactic biopsy and in debulking operations in patients with malignant gliomas (7). Complete removal of a malignant tumor is usually not possible without resecting functioning tissue. Therefore, an underestimation of tumor blood volume may potentially cause diagnostic errors in the selection of biopsy targeting sites, leading to an erroneous assessment of tumor grade.
Because gray matter distal to a GBM might be involved in tumor extension, we used contralateral deep white matter as the reference tissue. The time-ΔR2*T1C and ΔR2*T1U curves of normal white matter were almost identical in this study, such that the question of normal brain tissue with an intact blood-brain barrier was minimized.
Concerning the relationship between the degree of contrast enhancement on postcontrast images and that of vascularity on perfusion-weighted images in brain tumors, meningiomas show high vascularity as well as prominent enhancement effect (6, 15). In a previous report by Sugahara et al (8), all GBMs showed high vascularity as well as prominent contrast enhancement. These authors also reported that the vascularity of anaplastic glioma with enhancement was significantly higher than that of the anaplastic gliomas without enhancement (8). In the case of low-grade gliomas with minimal blood-brain barrier breakdown, these lesions showed no contrast enhancement as well as low vascularity (8, 10). Thus, there may be a concordance between the degree of contrast enhancement and that of vascularity. On the other hand, Knopp et al (9) reported that in four (19%) of their 21 patients with GBMs, the lesions showed only minimal contrast enhancement but high vascularity. Cerebral lymphomas usually have lower vascularity, although these tumors produce a strong enhancement effect (18). In juvenile pilocytic astrocytoma, the tumor enhances well on postcontrast images; however, perfusion-weighted MR images show hypovascularity (5). Therefore, in some brain tumors, a discordance between the degree of contrast enhancement and that of vascularity is possible. When we apply perfusion MR techniques to brain tumors, a concordance or discordance between the degree of contrast enhancement on postcontrast images and that of vascularity on perfusion-weighted images should be kept in mind.
According to Roberts et al (19), tumor blood volume and tumor microvascular permeability can be quantified with dynamic contrast-enhanced 3D MR imaging. In 22 cases of glioma, signal intensity changes in blood and tissue were kinetically analyzed using a bidirectional two-compartment model, yielding estimates of blood volume and microvascular permeability (19). They found a strong correlation between microvascular permeability and tumor grade. Zhu et al (20) have also reported on quantification of microvascular permeability, leakage space, and blood volume in various brain tumors using combined T1- and T2*-weighted contrast-enhanced dynamic MR imaging. Three-dimensional mapping of the endothelial permeability surface area product and leakage space were generated on the basis of T1-weighted images. Tumor blood volume maps are obtained from T2*-weighted images (20). On the other hand, double-echo dynamic MR image acquisition after a bolus injection of gadopentetate dimeglumine can separate the T2* shortening effect due to intravascular localization of the contrast agent and the T1 shortening effect that occurs as a result of extravascular localization (15, 21). The combination of these two fractions can be used to measure the vascularity and the microvascular permeability of the tumors simultaneously. In the future, we may be able to characterize the gliomas by their vascularity and microvascular permeability.
Echo-planar imaging would have been desirable for this experiment; however, double-echo echo-planar imaging is not currently available in most institutions. Even if echo-planar imaging is used for the double-echo method, only two or three slices per 1.1 second can be imaged (22). We used the best technique possible with the equipment available.
Conclusion
Careful attention should be paid to the underestimation of brain tumor blood volume resulting from T1 shortening effects when using single-echo perfusion-weighted MR imaging. Double-echo perfusion-weighted MR imaging may provide a more accurate evaluation of the tumor blood volume in GBMs and may be more suitable for the purposes of analysis.
Acknowledgments
We thank Hiroyuki Sashie, Tomokazu Ishida, and Miho Takeuchi at Fukui Medical University and Genji Asanuma at Mie University School of Medicine for their assistance with MR imaging data collection, and Hajime Sakuma and Kan Takeda at Mie University School of Medicine for their technical support.
Footnotes
1 Supported in part by research grant JSPS-RFTF97L00203 from the Japan Society for the Promotion of Science.
2 Address reprint requests to Hidemasa Uematsu, MD, Pulmonary Functional Imaging Research, Department of Radiology, University of Pennsylvania Medical Center, 3600 Market St, Suite 370, Philadelphia, PA 19104.
References
- Received October 18, 2000.
- Accepted after revision June 14, 2001.
- Copyright © American Society of Neuroradiology
In this issue


Jump to section
Related Articles
Cited By...
- Optimization of Acquisition and Analysis Methods for Clinical Dynamic Susceptibility Contrast MRI Using a Population-Based Digital Reference Object
- Improving Perfusion Measurement in DSC-MR Imaging with Multiecho Information for Arterial Input Function Determination
- On the Use of DSC-MRI for Measuring Vascular Permeability
- The Effect of Pulse Sequence Parameters and Contrast Agent Dose on Percentage Signal Recovery in DSC-MRI: Implications for Clinical Applications
- The Role of Preload and Leakage Correction in Gadolinium-Based Cerebral Blood Volume Estimation Determined by Comparison with MION as a Criterion Standard
- Percentage Signal Recovery Derived from MR Dynamic Susceptibility Contrast Imaging Is Useful to Differentiate Common Enhancing Malignant Lesions of the Brain
- Relative Cerebral Blood Volume Values to Differentiate High-Grade Glioma Recurrence from Posttreatment Radiation Effect: Direct Correlation between Image-Guided Tissue Histopathology and Localized Dynamic Susceptibility-Weighted Contrast-Enhanced Perfusion MR Imaging Measurements