
Abstract
BACKGROUND AND PURPOSE: The diagnosis of brain tumors after high-dose radiation therapy is frequently limited by the lack of metabolic discrimination available with conventional imaging methods. The purpose of this study was to use proton MR spectroscopy to investigate serial changes in recurrent malignant gliomas after gamma knife radiosurgery to characterize tissue response to high-dose radiation.
METHODS: Eighteen patients with recurrent gliomas were studied with MR imaging and 3D proton MR spectroscopic imaging at the time of radiosurgery and at regular time points thereafter. Choline (Cho) and N-acetyl aspartate levels were calculated on a voxel-by-voxel basis and compared with levels found in normal tissue and with levels observed at previous time points. The results of the spectral analysis were then compared with the radiologic findings. Statistical comparisons were precluded by the small sample sizes involved.
RESULTS: Response within the gamma knife target was observed as a reduction of Cho levels and an increase in lactate/lipid levels, typically within 6 months of treatment. Increases in Cho correlated with poor radiologic response and suggested tumor recurrence, confirmed histologically in six cases. The development of a spectral abnormality preceded a coincident increase in contrast enhancement by 1 to 2 months in nine cases.
CONCLUSION: Proton MR spectroscopic imaging provided diagnostic and monitoring information before and after radiosurgery. Evaluation of metabolic changes with proton MR spectroscopy and structural changes with MR imaging improved tissue discrimination and provided correlation with histologic findings.
Gamma knife radiosurgery is capable of delivering a conformal radiation dose to a prescribed target, and has been shown to be useful in the treatment of malignant primary brain tumors (1–3). In this capacity, the treatment is frequently directed at residual postoperative tumors. Treatments are planned so that a specified isodose contour (usually 30% to 50%) conforms to a physician-specified target. Despite the fact that tumor cells often reside well beyond the region defined by signal elevation on a contrast-enhanced T1-weighted MR image (4), the radiosurgical target is usually specified to conform to this volume. Furthermore, the presence of contrast-enhancing radiation necrosis in previously irradiated patients suggests that the specified target may be focusing on regions that do not contain active tumor. Posttreatment monitoring of patients treated with gamma knife radiosurgery is also limited by the inherent insensitivity of CT and MR imaging in defining precise margins of neoplasm and in distinguishing treatment effects from recurrent tumor (5–8).
This study was designed to characterize the serial response of recurrent gliomas to gamma knife radiosurgery using MR imaging and proton MR spectroscopic imaging. Spectral measurements were taken at high resolution (1.0 cm3, nominally) over the gamma knife target and the surrounding tissue both before and after treatment with radiation, and were aligned retrospectively. Through comparisons of the normalized levels of choline (Cho) and N-acetyl aspartate (NAA) within and outside the radiation target and regions of abnormality, as well as of interval changes in these metabolites after radiosurgery, it was possible to observe tissue response to radiation as well as recurrence after treatment.
Methods
Patient Population
The patient population included 14 men and four women with postoperative histologically verified gliomas (details are provided in Table 1). The patients were selected on the basis of the ability to acquire spectral data of good quality from the lesion to be treated. All patients met our institution's requirements for treatment with gamma knife radiosurgery, which are 1) Karnofsky performance status greater than 60, 2) a well-defined unilateral tumor less than 4 cm in its greater diameter, 3) absence of subependymal spread or leptomeningeal extension, and 4) a location not adjacent to the optic chiasm or brain stem. All the patients had received external beam radiation between 2 and 276 months before gamma knife treatment (median, 10.5 months). Nine patients had been on chemotherapy regimens between 4 and 70 months before radiosurgery (median, 10 months). Eight patients were receiving steroid treatment at the time they underwent radiosurgery.
Patient data
Gamma Knife Treatment
Radiosurgical procedures were planned and administered by a radiation oncologist and a neurosurgeon. In 17 of 18 cases, these personnel were unaware of the pretreatment spectroscopic results. In one instance (patient 13), the radiation target was adjusted to include regions of abnormality identified on the pretreatment proton MR spectra. A stereotactic frame was attached to the patients' skull to provide a reference coordinate system, which was then delineated using MR imaging. The MR examinations were then transferred to a workstation for treatment planning. After specification of a desired radiation target, a sequence of shots was planned such that a predesignated isodose contour (30% to 50%) of the resultant dose distribution conformed to the target volume. Treatment planning was accomplished using primarily the contrast-enhancedT1-weighted MR studies. The contrast-enhancing volume was the most commonly prescribed target. The maximum dose was then specified as a function of the size of the target. After construction of a treatment plan, the patient was positioned within the gamma knife using the head frame, and the shots required to generate the desired dose distribution were delivered sequentially.
MR Imaging and MR Spectroscopy
Baseline imaging and spectroscopic examinations were obtained within a week before radiosurgery, and follow-up examinations were acquired at approximately 2-month intervals thereafter until the initiation of a new treatment strategy. All MR studies were performed on a 1.5-T clinical scanner. A series of MR images was acquired that included 1) a T1-weighted sagittal scout image, 2) dual-echo axial T2-weighted and proton density–weighted images obtained as interleaved 3-mm-thick slices (2500/30,80 [TR/TE], 18- × 24-cm field of view [FOV], 192 × 256 matrix), and 3) pre- and postcontrast spoiled gradient-echo volume images acquired axially with a partition size of 1.5 mm (26/6, 40° flip angle, 18- × 24-cm FOV, 192 × 256 matrix). Using these images, a 3D proton MR spectroscopic imaging acquisition was prescribed. A point-resolved spectroscopy chemical-shift imaging (PRESS CSI) sequence was used for volume localization, employing spectral- and spatial-selective pulses (9) to provide water suppression and volume selection with minimal chemical-shift misregistration. Automated shimming was performed over the region to be excited just before the spectral acquisition. The PRESS-selected region was chosen to include as much of the contrast-enhancing lesion as possible, as well as contralateral and other normal tissue, while avoiding bone, subcutaneous fat, or other materials that would complicate shimming and water suppression. Accurate placement of the PRESS box was verified on the imaging sequence acquired just before the proton MR spectroscopy sequence. Follow-up examinations encompassed both regions previously studied and new regions of interest (ROIs) wherever possible. A phase-encoded grid of dimensions 8 × 8 × 8, 16 × 8 × 8, or 12 × 12 × 8 was chosen on the basis of the dimensions of the volume of interest. All proton MR spectroscopy acquisitions used a TR of 1000, and were acquired in 17 to 19 minutes. In 13 patients, the spectra were acquired with a TE of 144 using the head coil for both excitation and reception. The spatial resolution obtained in these examinations was 1.0 cm3 per voxel. The proton MR spectra in two patients were acquired at a spatial resolution of 2.0 cm3 per voxel, using a TE of 272. The remaining three patients had superficial lesions that permitted the use of phased-array coils for reception in the spectroscopic sequences (10). In these acquisitions, improved spatial resolution was possible because of the greater sensitivity of the phased-array coil relative to the head coil. Spatial resolutions of 0.34 cm3 per voxel (using a TE of 65 or 144) were obtained in two patients, and of 0.42 cm3 per voxel (using a TE of 65) in the other. The complete MR imaging/proton MR spectroscopy examination required approximately 1.5 hours.
MR Data Processing
At the conclusion of an MR imaging/proton MR spectroscopy examination, all images and spectra were transferred to a workstation for off-line processing using software developed in our laboratory. The clinical MR images (T2-weighted, proton density–weighted, pre- and postcontrast T1-weighted) were all aligned to the postcontrast T1-weighted image, since it was acquired just before the proton MR spectroscopy data and was assumed to be the most similar in spatial orientation to the spectral data. The automated alignment process used is described elsewhere (11). For follow-up studies of a patient, all images were also aligned to the postcontrast T1-weighted image from the baseline study of the patient. To evaluate spectral changes relative to the volume of irradiation, the dose distribution received by a patient was aligned to the images of each follow-up MR examination as well. Each spectrum of the proton MR spectroscopic imaging acquisition was zero-filled to 1024 points, apodized in the time domain using a 2-Hz lorentzian filter, Fourier transformed, and frequency, phase, and baseline corrected. For proton MR spectroscopy data sets acquired with surface coils, the inhomogeneity of the coil reception profile was corrected using an analytic correction algorithm (12). The proton MR spectroscopy data from follow-up studies were reconstructed at voxel locations corresponding to those of the baseline proton MR spectroscopy data, using the alignment parameters determined from the image registration process. Retrospective voxel shifting was performed to center voxels on ROIs on the contrast-enhanced T1-weighted images. After these manipulations, the peak areas for the prominent metabolites (Cho, creatine, NAA) were estimated within the excited region, and the ratio of Cho to NAA was computed. Any peak observed in the 1.0 to 1.5 ppm range was classified as an unknown combination of lactate and lipid, and was assessed qualitatively.
Image analysis of each examination consisted of automated intensity-contour segmentation of regions of contrast enhancement as well as identification of the high-dose (>15 Gy) region using the aligned radiosurgical treatment plan. Using these ROIs, the volumes of the high-dose region and contrast enhancement were calculated, as was the volume of new contrast enhancement (total contrast enhancement minus contrast enhancement present at the time of radiosurgery) for follow-up studies. Each patient was grouped into a radiologic-response-to-therapy category based on the change in contrast-enhancing volume after treatment. These categories were arbitrarily defined as follows: the stable group showed a change in contrast-enhancing volume of less than 2 cm3 at their last follow-up examination and no new foci of enhancement; the local recurrence group exhibited greater than 2 cm3 of new contrast enhancement at their last follow-up, contiguous with the original enhancement; and the remote recurrence group exhibited new foci of enhancement not contiguous with the original lesion.
Analysis of proton MR spectroscopy data entailed manual selection of a population of normal voxels (typically contralateral to the lesion), based on the absence of disease as seen on T2-weighted and contrast-enhanced T1-weighted images. The Cho and NAA levels in all voxels were then normalized using the mean of the corresponding metabolite levels observed in the normal voxels, generating a unitless measure of metabolite concentrations (hereafter referred to as nMetabolite), which could be compared across examinations with minimal errors from differences in coil loading. Reduction of NAA levels relative to those observed in normal voxels was regarded as a nonspecific indicator of tumor or treatment effects. Elevation of Cho was interpreted as evidence of tumor. The most specific indicator of active tumor was the simultaneous elevation of Cho and reduction of NAA levels relative to normal (13, 14). Tumor-suggestive voxels were identified as those in which Cho was elevated and NAA was reduced by 2 SD of the corresponding normal metabolite distribution (ie, the 95% confidence limit). The reduction of Cho and NAA to near noise values in a voxel was considered representative of necrotic tissue (13, 14).
The ratios of the normalized follow-up metabolite levels to the baseline normalized metabolite levels (hereafter referred to as ΔMetabolite) were then calculated on a voxel-by-voxel basis. Differences could have been used to avoid the problems encountered with ratios as the denominator approaches zero; however, the use of ratios allowed the consideration of serial alterations in metabolite concentrations in terms of a familiar percentage of change. The spectral evolution of the high-dose region was assessed by summing nCho, nNAA, Cho/NAA, ΔCho, ΔNAA, and ΔCho/NAA for voxels that were at least 50% within the high-dose ROI. Serial spectral analysis of contrast-enhancing regions was performed in an analogous manner. It is worth emphasizing that while serial analysis of the high-dose region considered a single volume of tissue at multiple time points, serial analysis of contrast-enhancing regions compared the region of enhancement at one time point with the same region of tissue at the baseline study, not the region of enhancement at the baseline study. The analyses were then stratified on the basis of the response category of each patient. The low enrollments of each response group prohibited conclusive statistical analysis. Wherever possible, histologic data obtained at the time of resection after gamma knife treatment were compared with the spectroscopic results.
Results
Baseline Findings
One examination per patient was acquired before the application of gamma knife radiosurgery. Fourteen patients exhibited tumor-suggestive voxels as defined above at the baseline time point. nCho for these voxels ranged from 1.2 to 3.7 (median, 1.7), and nNAA was 0.0 to 0.8 (median, 0.2). These voxels were found within the area of contrast enhancement in 11 patients, and extended outside this region (beyond the gamma knife target) in 10 patients. The presence of spectral abnormalities beyond the limits of the radiation target has been associated with poor response to radiosurgery (15). Necrotic voxels were present in nine patients at the time of gamma knife treatment, seven of whom had a diagnosis of glioblastoma multiforme (GBM). In each case, at least one necrotic voxel was found in a contrast-enhancing region, whereas in four cases, spectrally indicated necrosis was found beyond the regions of contrast enhancement as well. The prescribed gamma knife targets ranged in volume from 1.1 to 39.0 cm3, with a median of 5.7 cm3, and were treated with maximum radiation doses of 20 to 38 Gy (median, 34 Gy).
Serial Findings
Sixty examinations were acquired as follow-ups after radiosurgery. The median number of follow-ups per patient was four (range, one to six), with a median final follow-up time after gamma knife treatment of 5.5 months (range, 1 to 14 months). At the time of their last follow-up, 11 patients exhibited tumor-suggestive voxels, all of whom had exhibited tumor-suggestive voxels at the time of treatment. These voxels had a median nCho of 1.5 (range, 1.2 to 3.4) and a median nNAA of 0.2 (range, 0.0 to 0.7). In each of these patients, a voxel with significantly elevated Cho and reduced NAA could be found outside the high-dose region. Four of these patients also had voxels with these characteristics inside the high-dose region after treatment. Twelve patients had necrotic voxels at the time of their final follow-up, including eight of the nine patients with GBM. In 10 cases, these voxels were found within the gamma knife target and in seven they were found outside the target. Five patients had necrotic spectra both inside and outside the radiation target.
The serial spectroscopic behavior of the high-dose region for each response group is summarized in Table 2. Each quantity stated is the median of the specified sample population, with the corresponding range given in parentheses. Reductions in Cho within the gamma knife target at the first follow-up after radiosurgery were observed in the medians of all groups. An example of this phenomenon can be seen in Figure 1, in which a decrease in contrast-enhancing volume is accompanied by a reduction in the Cho level for a voxel within the 15-Gy isodose line. Changes in NAA were more variable, although we can state that the median nNAA of each group was between 0.3 and 0.5 at each of the time points shown. Figure 2 shows a case in which NAA levels within the radiation target, already reduced relative to normal at the time of gamma knife radiosurgery, decrease over a period of 4 months. Reductions in the Cho/NAA ratio within the target for the stable and remote recurrence groups were noticeable at both the 1- and 5-month time points. Increases in lactate/lipid levels within the radiation target were observed in 10 patients, seven of whom displayed the increase within 2 months of radiosurgery.
Spectral response over the gamma knife target for the three response groups
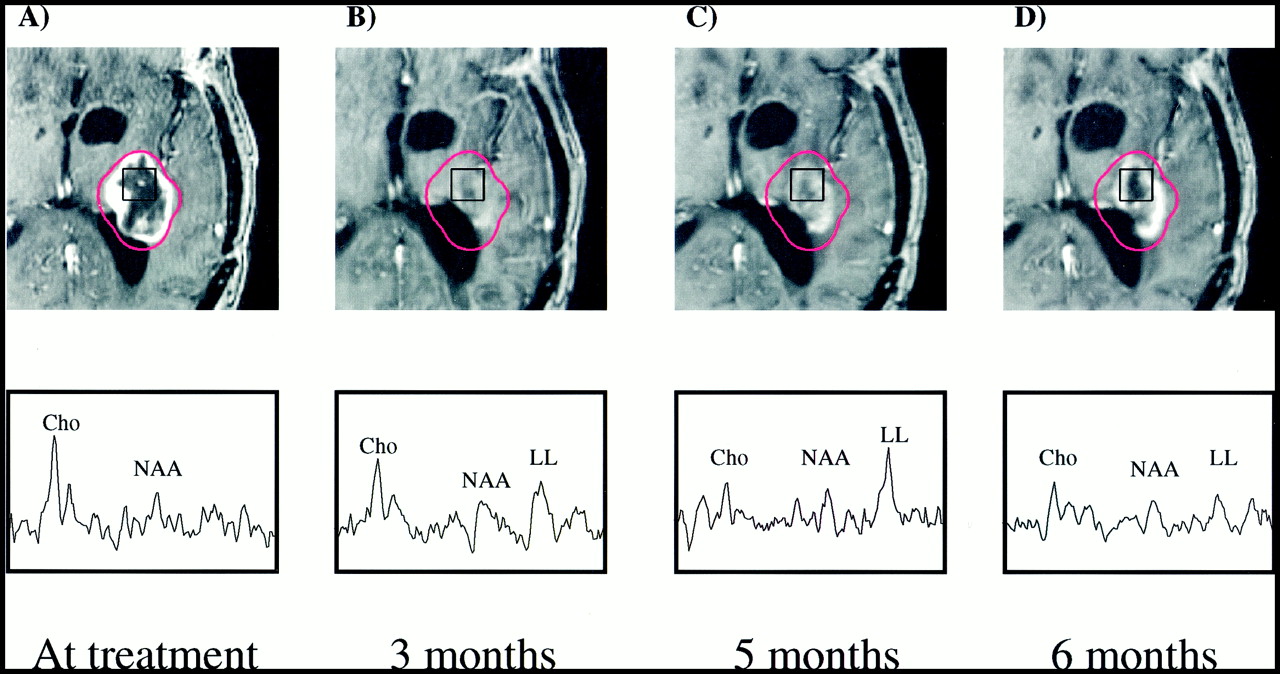
Patient 7.
A–D, Serial contrast-enhanced gradient-echo images (2/6/1) and PRESS spectra (1000/144/1; voxel resolution, 1.0 cm3) acquired 1 day (A), 3 months (B), 5 months (C), and 6 months (D) after gamma knife treatment and aligned retrospectively. The 15-Gy isodose line is shown in red. The volume of contrast enhancement is significantly reduced at the 3-month time point, but increases at both the 5- and 6-month follow-ups. Reduction of Cho from baseline levels is apparent at the 3-, 5-, and 6-month time points. No significant change in NAA levels is observed, while a lactate/lipid resonance develops at 3 to 5 months but is reduced at 6 months. This patient received no further treatment and died 17 months after undergoing gamma knife radiosurgery.

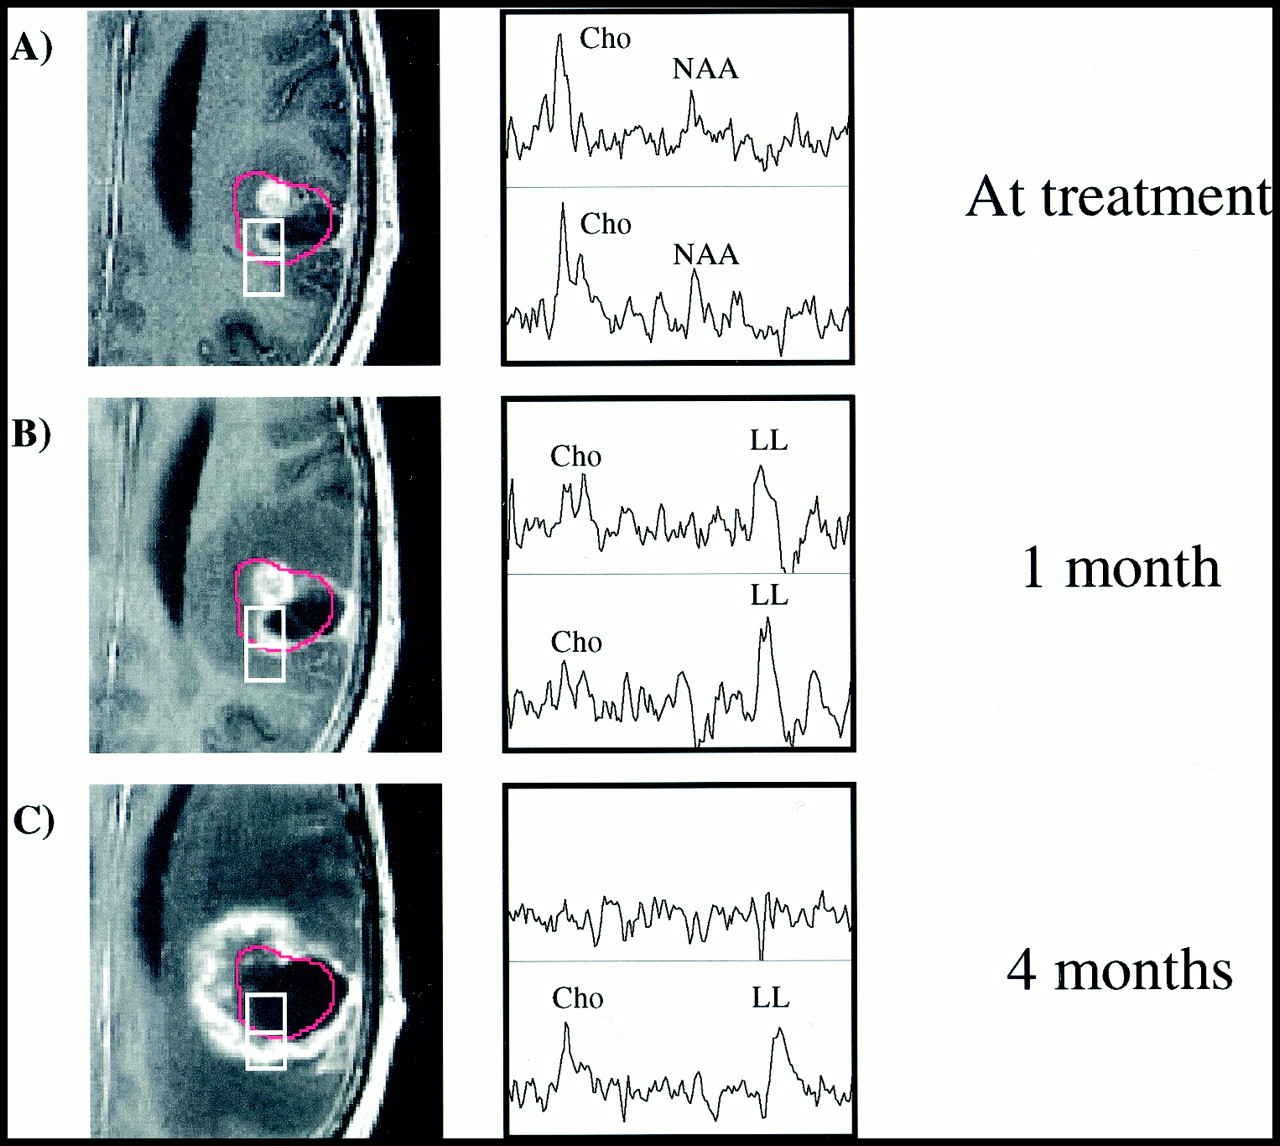
Patient 11.
A–C, Serial contrast-enhanced gradient echo-images (26/6/1) and PRESS spectra (1000/144/1; voxel resolution, 1.0 cm3) over the gamma knife target 3 days before (A) and 1 month (B) and 4 months (C) after radiosurgery. Two representative voxels are depicted, with the 15-Gy isodose line shown in red. The anterior voxel received an average radiation dose of 19.0 Gy, while the posterior voxel received 10.3 Gy. Reductions in both Cho and NAA as well as an increase in lactate/lipid are noted 1 month after radiosurgery. At 4 months, the less-irradiated voxel has developed a distinct tumorlike spectral pattern, while the heavily irradiated voxel appears necrotic. The lesion was resected, and brachytherapy seeds were implanted shortly after the last examination shown, but no biopsy samples were taken. The patient died 13 months after undergoing gamma knife treatment.
Recurrence (as defined as greater than a 2-cm3 increase in contrast-enhancing volume) was observed in 12 of the 18 patients. In each case, at least one voxel with an elevated Cho/NAA ratio was associated with the area of recurrence. In nine of the 12 recurrences, voxels coincident with the regions of recurrence with increased Cho/NAA ratio relative to normal-appearing voxels were identified before an increase in contrast enhancement. In the three other instances, the new area of contrast enhancement appeared in a region not previously imaged with proton MR spectroscopy. Regions of contrast enhancement not present at the time of gamma knife radiosurgery were characterized by averaging voxels within the volume of interest. Table 3 documents the spectral findings within these tissue regions for the local and remote recurrence groups. As in Table 2, values are given as the median of the specified distribution with the minimum and maximum values in parentheses. The mean dose received during radiosurgery over the volume of new contrast enhancement was 10.3 Gy for the patients with local recurrence and 6.9 Gy for those with remote recurrence. Regions of new contrast enhancement in local recurrences were characterized by pronounced increases in the Cho/NAA ratio. Figures 3 and 4 illustrate the observation of increased Cho within regions of new contrast enhancement in patients with local recurrence, although it is interesting to note that in Figure 3 the increase in Cho precedes the development of contrast enhancement. When contrast enhancement does appear in this region, the Cho levels have decreased relative to those at the prior time point. The local recurrence case in Figure 2 shows an abnormal Cho/NAA ratio outside the radiation target at both the baseline and 4-month follow-up time points. The 1-month follow-up shows a reduction in Cho, however. The volume of new contrast enhancement in the remote recurrence group showed greater increases in Cho than were observed in the local recurrence group, although as in that group the increase was not apparent until the 5-month time point. A dramatic increase in the median Cho/NAA ratio is conspicuous in the remote recurrence category at both the 1- and 5-month time points. An instance of remote recurrence is shown in Figure 5, in which a voxel distant from the gamma knife target is identified as abnormal by proton MR spectroscopy at the time of radiosurgery. Four months later, this spectral pattern is maintained and the region has developed into a remote recurrence. A transient reduction in Cho in this region is apparent at the 2-month follow-up, similar to the reduction in Cho outside the radiation target observed in Figure 2 at the first follow-up.
Spectral evolution of regions of new contrast enhancement in patients with tumor recurrence

Patient 4.
A–D, Serial contrast-enhanced gradient-echo images (26/6/1) and PRESS spectra (1000/144/1; voxel resolution, 1.0 cm3) of a cerebellar lesion 1 day before (A) and 3 months (B), 6 months (C), and 8 months (D) after treatment. The most irradiated voxel (almost completely within the red 15-Gy isodose line) received an average dose of 18.0 Gy, while the other three voxels received less than 10 Gy. At the time of radiosurgery low metabolite levels were noted in all voxels. Three months later, metabolite levels had increased, particularly within the radiation target. An increase in Cho is noted posterior to the radiation target at 3 and 6 months after treatment. At 8 months, these spectral abnormalities have become apparent radiologically, while the radiation target shows a necrotic spectrum. The development of a lactate/lipid peak within the high-dose region is also apparent from these serial observations. This patient was treated with gamma knife radiosurgery for a recurrence in the left superior frontal lobe 6 months after the initial treatment, and died 6 months thereafter.
Six patients underwent nonlocalized biopsy at the time of subsequent resection after gamma knife treatment. These results are compared in Table 4 with normalized metabolite levels observed in voxels at the last follow-up. The dramatic elevation of the Cho/NAA ratio relative to normal voxels is conspicuous in each case. Increased Cho levels (nCho > 1) are present in four of six cases as well. Also noticeable is that one of the biopsy samples read as containing necrosis possessed the lowest nCho level of the group (0.5).
Biopsy results versus spectral measurements for six patients
Discussion
While the spectral response of gliomas (7, 8, 14, 16, 17) and normal nervous tissue (18–20) to ionizing radiation has been addressed by a number of investigators, many of these studies were done with single-voxel techniques, which suffer from poor spatial resolution, lack of sampling of multiple regions, and partial-volume effects. The results reported from these studies generally concur with those measured in the present investigation: a reduction in Cho in cases showing a response to therapy and an increase in Cho and a decrease in NAA in areas of recurrent tumor. However, single-voxel approaches lack the spatial sampling necessary to assess the distribution of tumor metabolite levels relative to the radiation target both before and after treatment. Fluorodeoxyglucose positron emission tomography (FDG-PET) is an alternative imaging method for the study of irradiated brain tumors, but it is an expensive technique that requires alignment with a CT or MR examination to permit correlation with anatomy. Proton MR spectroscopic imaging offers the possibility of metabolic imaging during a conventional MR examination, and has been shown to have a diagnostic capability comparable or in some cases superior to that of FDG-PET (6, 8, 21). The present study demonstrates the clinical utility of proton MR spectroscopy in monitoring patients after treatment. A number of distinct spectral patterns were observed within lesions, allowing for discrimination of tissue beyond the level capable by conventional imaging techniques or single-voxel MR spectroscopy. The utility of 3D proton MR spectroscopic imaging in allowing retrospective alignments in all three dimensions was also critical to assess serial changes within and outside the treatment volume.
The values reported in Table 1 for the change in metabolite values within the high-dose region at 1 and 5 months after treatment exhibit the feasibility of observing response to radiosurgery with proton MR spectroscopy. Reduction in Cho, as shown for a single case in Figure 1, was apparent for both the stable and local recurrence response groups, most likely reflecting a reduced cellular population consistent with radiation-induced necrosis. This change is consistent with other investigators' observations of treated gliomas (7, 8, 14, 16, 22), as well as with one study of contralateral normal brain tissue irradiated to 16 to 62 Gy during the course of radiotherapy (18). However, Szigety et al (19) reported increased Cho within normal brain tissue irradiated to 50 to 80 Gy during the course of radiotherapy of primary brain tumors. They and others (17) postulated that these changes were due to the release of membrane-bound Cho after radiation damage to the membrane. The higher radiation doses and different fractionation patterns used may explain the discrepancy in results between those studies and ours. Changes in levels of NAA after treatment were more variable, showing a 70% increase for the stable group at 5 months after treatment, while the remote recurrence group showed no change at 5 months and the local recurrence group showed a 20% decrease. The case in Figure 1 shows minimal change in the NAA peak height for 6 months after radiosurgery. This is in contrast to the results reported by Usenius et al (18) and Estève et al (20), who observed reductions in NAA in normal tissue (albeit transiently in the latter study) after irradiation to 16 to 62 Gy.
Several explanations for our observations can be postulated. Increases in NAA such as those observed in the stable group most likely do not reflect the growth of new neurons. Alternatively, this phenomenon may be explained by the spatial redistribution of tissue resulting from changes in mass within the gamma knife target. As the tumor shrinks in response to gamma knife treatment, the surrounding normal tissue shifts correspondingly. Serial spectral observation of the radiation target would reveal increases in NAA corresponding to the movement of normal tissue containing viable neurons into the space created as the tumor decreases in volume. This was suggested by Houkin et al (23) in the observation of two malignant lymphomas with single-voxel MR spectroscopy after radiation treatment. The first follow-up examination in Figures 3 and 5 show increases in metabolites within the high-dose region, which could be explained with this hypothesis. Radiobiological evidence can also be used to offer explanations for the differences in response to radiation between the Cho and NAA signals. Histologic examination has shown that morphologic changes in neurons occur substantially later than corresponding changes in glia after irradiation (24, 25). The radioresistance afforded neurons by their postmitotic status has also been noted (26). Assuming the MR spectroscopy NAA signal to arise from the neuronal population and the Cho signal to come from the entire cellular population, these radiobiological differences may explain the more prominent changes in Cho relative to the changes in NAA. Finally, the nNAA levels for each of the three groups before treatment and at5 months after treatment were less than or equal to 0.5. These values suggest that, while ΔΝΑΑ suggests large swings in NAA levels, the changes are minimal when referenced to the actual nNAA levels in the ROI.
The difference in the evolution of the Cho/NAA ratio over the high-dose target between the stable and remote recurrence groups versus the local recurrence group highlights the ability of proton MR spectroscopy to assess patient response to radiosurgery. Each response category possessed a median Cho/NAA ratio within the radiation target that was distinctly abnormal when compared with the conventional normal Cho/NAA value of 0.6. After treatment, the stable group showed a 50% reduction in the Cho/NAA ratio, while the remote recurrence group showed a 40% reduction. Both these observations are consistent with the radiologic interpretation of the patients' response to treatment. The local recurrence group, however, exhibited a steady increase in Cho/NAA ratios, suggesting the persistence of active tumor within the area of irradiation, although both nCho and nNAA were decreased relative to previous examinations. The reductions in metabolite levels could be interpreted as a reduction in cell density within the target, reflecting cell death after radiation, whereas the increase in Cho/NAA ratio could correspond to a change in the tissue composition of the high-dose volume (ie, increased tumor fraction within the voxel). This distinction is particularly significant in GBM, in which intrinsic micronecrosis often prevents observation of increased Cho relative to normal tissue. In these cases, consideration of the Cho/NAA ratio may be of greater clinical significance than the individual nCho and nNAA levels.
Outside the gamma knife target, proton MR spectroscopy also proved useful in identifying regions of recurrence. Characterization of new contrast-enhancing volumes in the local and remote recurrence categories showed strongly abnormal Cho/NAA ratios. The observation that the median Cho level in remote recurrences were greater than those in local recurrences may be explained by the fact that the local recurrences occurred on average in regions that received a greater radiation dose than the regions in which remote recurrences occurred. Therefore, the local recurrences most likely contained a greater percentage of radiation necrosis, which would result in a lower measured Cho level within the area of contrast enhancement. Because in many cases the spectral abnormalities were present before the appearance of contrast enhancement, the observed changes from baseline in metabolites in areas of new contrast enhancement were relatively small. Such a situation is depicted in Figure 3. In this example, we see that at the time point at which contrast enhancement develops, Cho is actually decreasing. Recurrent gliomas often show active areas of tumor beyond the region of contrast enhancement (15). It is possible in these cases that by the time the tumor becomes enhancing it has developed a significant amount of necrosis. This would explain the reduction in Cho in regions of new enhancement at the final time point in Figure 3. The observation of abnormal spectra before radiologic progression in all cases in which the region of recurrence was studied serially with proton MR spectroscopy is very encouraging and reinforces previous findings (7, 8, 23). It appears that consideration of nCho, nNAA, ΔCho, ΔΝΑΑ, and the Cho/NAA ratio can provide reliable differentiation of tissue types after high-dose radiation treatment. The biopsy results suggest the correspondence between regions of spectral abnormality and recurrent tumor; however, rigorous statistical testing will be required to validate these observations.
The observation of lactate/lipid within this study did not follow any single hypothesis. Tomoi et al (27) correlated radiation response with a decrease in the lactate/lipid peak for three lymphomas and one metastatic cancer. For two glioblastomas and two other metastases, no change in the lactate/lipid peak was observed. This was taken as evidence of the radioresistance of these tumors. Heesters et al (16) reported disappearance of the lactate peak in three patients with lesions of unspecified grade. While these authors did not comment on the presence of lipid, they did not report the use of any technique to separate the lipid and lactate resonances. These findings contrast with correlations reported by Kuesel et al (28) and Negendank and Sauter (29) between mobile lipids in high-grade tumors and the amount of tissue micronecrosis. From this trend one would expect the lactate/lipid peak to increase after irradiation, reflecting the development of radiation necrosis. Negendank and Sauter (29) observed a higher rate of occurrence of lactate/lipid within irradiated patients than nonirradiated patients, although the difference was not significant. The single high-grade lesion from which Heesters et al (16) acquired usable serial data also showed a steady increase in lactate after irradiation. We observed 10 patients (55.5% of the patient sample) in whom an increased lactate/lipid resonance developed within the high-dose region. Two clear examples of this are shown in Figures 3 and 4. Figure 3 illustrates a case in which the increase in lactate/lipid is restricted to the tissue volume that received radiation, while areas of increased enhancement outside the radiation target show negligible lipid. This example suggests radiation-induced necrosis as the source of the lipid. However, increases in lactate/lipid in regions of new contrast enhancement outside the gamma knife target, as in Figure 2, were also observed in10 patients. Careful inspection of several cases in which areas of increased lactate/lipid occurred both inside and outside the radiation target suggests the peak more closely correlates with the area of contrast enhancement than the high-dose region, as in Figure 4, and implies that tissue necrosis associated with the neoplasm is responsible for the lipid peak. While other studies have shown that increased lipid may precede radiologically evident necrosis (28, 29), the time course of increase in lactate/lipid roughly corresponded to the time course of increase in contrast enhancement for this group of patients. The overlap of the lipid and lactate resonances was not addressed within this study. Further investigation, making use of editing sequences to quantify the individual levels of lactate and lipid, is needed to better understand the significance of these two compounds in irradiated tissue.

Patient 16.
A and B, Surface-coil contrast-enhanced gradient-echo images (26/6/1) and PRESS spectra (1000/144/1; voxel resolution, 0.34 cm3) acquired 2 weeks before (A) and 1 month after (B) gamma knife radiosurgery and aligned retrospectively. Before radiosurgery, several voxels with Cho above that of normal-appearing tissue are present beyond the 15-Gy isodose line (shown in red) of the prescribed treatment plan. One month later, the Cho/NAA ratio in eight of the nine voxels shown has increased to greater than 1. Also conspicuous are the strong lactate/lipid resonances after treatment. One month after the last examination shown here, the patient underwent resection. Histologic analysis of biopsy samples taken during surgery showed residual/recurrent anaplastic astrocytoma.
It remains unclear whether the use of radiation targets that encompass the entire region of spectral abnormality is recommended for cases in which elevated Cho is observed beyond the gamma knife target at the time of treatment. The response of patient 13, whose treatment was planned to include regions of spectral abnormality, is shown in Figure 6. At the time of treatment, a number of tumor-suggestive voxels were present beyond the area of contrast enhancement that were included within the 15-Gy isodose line of the gamma knife target. However, MR images showed a clear progression 6 months after radiosurgery. The spectra at this time point showed a mixed response, even within the high-dose region. Voxels closer to the original lesion showed reduced metabolite levels and an increased lactate/lipid resonance, suggesting a response to treatment. The column of voxels more medial to the initial lesion, however, showed reduced NAA levels and now appeared suggestive of recurrent tumor. While these regions were treated with a lower dose than were the more lateral voxels (9.6 Gy versus 15.2 Gy), they showed no spectral abnormality initially. It is possible that the presence of tumor-suggestive voxels beyond the regions of contrast enhancement implies the presence of a more aggressive or infiltrative variety of tumor that will respond poorly regardless of the treatment applied. Further investigation will be required to assess whether increasing the volume of the radiosurgical target or using a fractionated conformal radiation therapy technique to irradiate the entire spectral abnormality will result in improved local control.

Patient 18.
A–C, Contrast-enhanced gradient-echo images (26/6/1) and PRESS spectra (1000/144/1; voxel resolution, 1.0 cm3) acquired 1 day before (A) and 2 months (B) and 4 months (C) after radiosurgery. Voxel shifting was used to obtain a spectrum centered within the 15-Gy isodose line (shown in red). Although a hemorrhage present at the time of gamma knife treatment complicated radiologic interpretation, elevated Cho was clearly well outside the gamma knife target. At the last measured time point, the Cho/NAA ratio of the treated voxel (average dose, 18.5 Gy) was reduced to values comparable to normal tissue, while tumorlike spectral patterns remained present posteriorly. Resection was recommended at this time, during which biopsy samples were obtained that verified the new contrast enhancement as residual/recurrent GBM, including some necrosis.

Patient 13.
A and B, Contrast-enhanced gradient-echo images (26/6/1) and spectra (1000/144/1; voxel resolution, 1.0 cm3) acquired the day of radiosurgery (A) and 5 months afterward (B). The radiation target was prescribed to include spectral abnormalities beyond the regions of contrast enhancement. Despite the enlarged treatment field, the 6-month time point shows a large increase in contrast-enhancing volume. Increases in Cho within regions of new contrast enhancement suggest they correspond to recurrent tumor. Also conspicuous is the development of lactate/lipid resonances within the high-dose region. Resection was performed after the final time point shown, which histologically confirmed the increased contrast enhancement as recurrent tumor.
The design of this study posed several limitations. The inability to apply a statistical analysis to the serial spectral observations was an unfortunate side effect of the small number of patients available for study. Future investigations of glioma response to gamma knife radiosurgery will be required to statistically validate the observations made here. Also, other researchers have suggested that proton MR spectroscopy data acquired after the introduction of intravenous contrast material may suffer from signal loss (30). The magnitude of these effects is controversial (31), but there remains the possibility that the proton MR spectroscopy data in this study were interfered with by the presence of contrast agent. Any confounding effects of this phenomenon on our serial observations have been eliminated, however, by consistently acquiring proton MR spectroscopy data after the injection of contrast agent. The combination of treatments used in several patients in our sample also possibly obscured assessment of response to gamma knife radiosurgery. For five patients who underwent gamma knife radiosurgery as a boost to treatment with external-beam radiotherapy, the spectral observations document the response to both gamma knife treatment and radiotherapy. The broad irradiation field of the external-beam treatment may also have influenced the selection of normal spectral voxels in these patients. A similar concern is that the use of steroids in eight patients at the time at which they underwent gamma knife treatment may have influenced the tumor evolution observed here. The ability of steroids to reduce contrast enhancement, mass effect, and edema associated with brain tumors has been noted (32). While this possibly affected our measurement of tumor volume, it is also important to consider that steroid treatment is generally not cytotoxic. Therefore, while steroid treatment may affect the absolute levels of metabolites by inducing changes in edema and enhancement, the relative levels of metabolites should be unaffected by the treatment.
Conclusion
The utility of proton MR spectroscopy in assessing patient response to radiosurgery is apparent, and further study into characterizing modes of response is warranted. Within the radiation target, tissue response was observed spectrally as a reduction in Cho, which was interpreted as evidence of the development of radiation necrosis. Differences in the evolution of the Cho/NAA ratio over the gamma knife target were apparent between the local recurrence group and the stable and remote recurrence groups, and suggested the ability of proton MR spectroscopy to distinguish between these outcomes. Large increases in the Cho/NAA ratio were also measured in regions of recurrence. In nine of 12 cases, proton MR spectroscopy identified areas of abnormality that developed into radiologic recurrences at later time points. The correspondence between areas of spectral abnormalities and subsequent radiologic recurrence is encouraging, and prompts investigation into the use of proton MR spectroscopy in planning radiosurgical treatments. This and other studies demonstrate the metabolic heterogeneity of malignant gliomas and call for the use of proton MR spectroscopy techniques for assessment of the distribution of tumor at spatial resolutions (both voxel size and matrix) not possible with conventional single-voxel methods. On the basis of our experience, we recommend further use of proton MR spectroscopy to characterize radiation response in gliomas and to improve clinical management of patients treated with gamma knife radiosurgery.
Acknowledgments
We acknowledge the contributions of T. R. McKnight, J. I. Lee, M. H. von dem Bussche, N. J. Fischbein, S. M. Noworolski, R. G. Henry, M. R. Day, N. Schaffer, U. Jimenez, E. Proctor, and N. Bruce.
Footnotes
1 Supported by NIH grant RO1 CA59880.
2 Address reprint requests to Edward E. Graves, Magnetic Resonance Science Center, 1 Irving St, AC-109, University of California, San Francisco, CA 94143.
References
- Received April 24, 2000.
- Copyright © American Society of Neuroradiology
In this issue


Jump to section
Related Articles
Cited By...
- Early Metabolic Changes in 1H-MRSI Predictive for Survival in Patients With Newly Diagnosed High-grade Glioma
- Role of MRI in Primary Brain Tumor Evaluation
- Specific biomarkers of receptors, pathways of inhibition and targeted therapies: clinical applications
- Changes in Serial Magnetic Resonance Spectroscopy Predict Outcome in High-grade Glioma During and After Postoperative Radiotherapy
- Permeability Estimates in Histopathology-Proved Treatment-Induced Necrosis Using Perfusion CT: Can These Add to Other Perfusion Parameters in Differentiating from Recurrent/Progressive Tumors?
- Distinguishing Recurrent Intra-Axial Metastatic Tumor from Radiation Necrosis Following Gamma Knife Radiosurgery Using Dynamic Susceptibility-Weighted Contrast-Enhanced Perfusion MR Imaging
- The Extent and Severity of Vascular Leakage as Evidence of Tumor Aggressiveness in High-Grade Gliomas
- Physiologic and Metabolic Magnetic Resonance Imaging in Gliomas
- Diagnosis and Treatment of Recurrent High-Grade Astrocytoma
- NMR Spectroscopy and Pediatric Brain Tumors