
Abstract
BACKGROUND AND PURPOSE: The laminar patterns displayed by MR microscopy (MRM) form one basis for the classification of the cytoarchitectonic areas (Brodmann areas). It is plausible that in the future MRM may depict Brodmann areas directly, and not only by inference from gross anatomic location. Our purpose was to depict the laminar cytoarchitecture of excised, formalin-fixed specimens of human cerebral cortex by use of 9.4-T MR and to correlate MR images with histologic stains of the same sections.
METHODS: Formalin-fixed samples of human sensory isocortex (calcarine, Heschl’s, and somatosensory cortices), motor isocortex (hand motor area of M1), polar isocortex (frontal pole), allocortex (hippocampal formation), and transitional periallocortex (retrosplenial cortex) were studied by MRM at 9.4 T with intermediate-weighted pulse sequences for a total overnight acquisition time of 14 hours 17 minutes for each specimen. The same samples were then histologically analyzed to confirm the MR identification of the cortical layers. Curves representing the change in MR signal intensity across the cortex were generated to display the signal intensity profiles for each type of cortex.
RESULTS: High-field-strength MR imaging at a spatial resolution of 78 × 78 × 500 μm resolves the horizontal lamination of isocortex, allocortex, and periallocortex and displays specific intracortical structures such as the external band of Baillarger. The signal intensity profiles demonstrate the greatest hypointensity at the sites of maximum myelin concentration and maximum cell density and show gradations of signal intensity inversely proportional to varying cell density.
CONCLUSION: MRM at 9.4 T depicts important aspects of the cytoarchitecture of normal formalin-fixed human cortex.
Prior authors have illustrated the potential for MR imaging to display very fine anatomic detail within the CNS. Beuls et al (1) and Vandersteen et al (2) successfully evaluated the internal architecture of the excised human spinal cord and medulla oblongata at 9.4 T by using a Varian superconducting magnet (Nuclear Magnetic Resonance Instruments, Palo Alto, CA). Benveniste et al (3) displayed some of the layers of the excised mouse neocortex and hippocampus at 9.4 T by using an Oxford superconducting magnet (Oxford Instruments plc, Eynsham, Witney, Oxon, UK) with excellent histologic correlation (Nissl stain). Burgess et al (4) measured the thickness of the human cortex in vivo at 8 T by using a Brüker Avance Console (Brüker Daltonics Inc., Billerica, MA) connected to an 8-T, 80-cm-bore superconducting magnet (Magnex; Magnex Scientific Ltd, Yarnton, Oxforshire, U.K). These authors reported that most of the cortex measured approximately 2 mm in thickness, but commented specifically (p. 853) that “ the internal anatomy of the cortex cannot typically be resolved [in vivo].” We attempted 1) to display the laminar pattern of human cerebral cortex in formalin-fixed, excised specimens by using intermediate-weighted MR pulse sequences at 9.4 T and 2) to correlate these MR images with histologic sections of the same specimens to identify cytoarchitecture in normal human cortex.
Methods
Study specimens were obtained from two formalin-fixed brains of adult human cadavers (48-year-old woman, 56-year-old man) with no history of neurologic disease and normal postmortem examinations. The cortical anatomy of each specimen was identified by standard criteria (5–23) to select for analysis of 1) sensory cortex (calcarine cortex [Brodmann’s area (BA) 17]; Heschl’s gyrus [BA 41 and 42]; and somatosensory cortex [BA 3, 2, 1]), 2) motor cortex (hand motor area of M1 [BA 4]), 3) allocortex (midhippocampal formation), and 4) transitional periallocortex (retrosplenial cortex [BA 29 and 30]). In each case, the identification made by gross anatomy was later confirmed at histologic analysis.
Each specimen was positioned within a 1.5-cm diameter polyethylene tube filled with Fomblin (perfluoropolyether, Ausimont, Thorofare, NJ) that was used as a wetting and embedding agent to prevent dehydration and to reduce susceptibility artifacts at tissue margins. Where present, air bubbles were aspirated from the interstices of the sulci with a very fine needle and syringe. The sample was wedged in place between two styrofoam plugs to reduce tissue vibration, and the tube was sealed to prevent evaporation and reentry of air bubbles.
MR images were obtained on a unit (Brüker Avance System with microimaging, Brüuker Analytik, Rheinstetten, Germany) equipped with a 9.4-T superconducting magnet with a vertical 89-mm bore and a 25-mm birdcage coil. An automated water cooling system maintained the bore temperature below 30°C. Pilot studies of diverse T1-, T2-, and intermediate-weighted sequences led us to select the intermediate-weighted sequence for cortical analysis (2400/45/100 [TR/TE/NEX]; section thickness, 0.5 mm [500 μm]; field of view, 20 × 20 mm; data matrix, 256 × 256; and anti-aliasing factor, 1. This corresponded to an in-plane resolution of 78 × 78 μm and a section thickness of 500 μm. Each sample was run overnight for a total acquisition time of 14 hours 17 minutes. MR microscopy (MRM) data were displayed as standard images and as computer-generated profiles of the changing signal intensities across the cortex from the pial surface into the subcortical arcuate U fibers.
After imaging, samples were prepared for histologic analysis by overnight rinsing in phosphate buffered solution. Each specimen was then sectioned serially on a vibrotome, at 50-μm intervals, taking care to orient the histologic sections as nearly parallel to the imaging plane as possible. Each 30th section was stained for neurons by using cresyl violet, and the adjacent section was stained for myelin by using luxol fast blue, to display the cytoarchitecture and myelination of that specimen. The histologic sections were then compared directly with the MR images of the very same specimen, as nearly as possible, to confirm correct imaging identification of the cortical lamination.
Results
Intermediate-weighted MRM displays the cortex as horizontal layers of varying signal intensity. MRM distinguishes among many of the individual layers of the cortex, and even some sublayers, but does not successfully show every layer and sublayer (Fig 1).
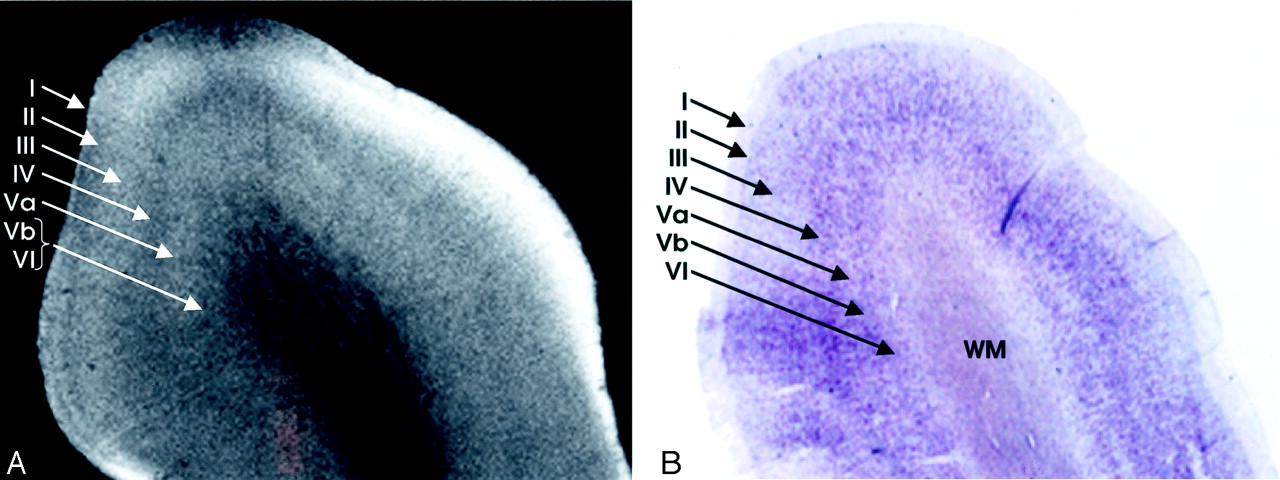
Homotypical polar isocortex.
A, MRM image of the frontal pole.
B, Corresponding histologic section with Nissl stain. From superficial to deep, depending on the concentration of the cells, the myelin fiber connections, the corresponding variation in the signal intensity, and the individual layers of the cortex can be identified: I, the molecular layer; II, the external granular layer; III, the external pyramidal layer; IV, the internal granular layer; V, the internal pyramidal layer, which is subdivided into an outer layer, Va, and an inner layer, Vb; and VI, the multiform layer (magnification ×8).
Direct correlation of the MR images with the corresponding Nissl and myelin stains shows that very low signal intensity is seen in two distinctly different settings: 1) heavily myelinated laminae, such as the intracortical layer IVB (external band of Baillarger) of the calcarine cortex or the subcortical arcuate U fibers, or 2) highly cellular layers nearly devoid of myelin, such as the granule cell layer of the dentate gyrus.
Intermediate signal intensity of varying shades of gray corresponds to layers with intermediate concentrations of cells and myelin in a complex fashion that is currently under active investigation.
On the MRM images, the distance from the pial surface to the arcuate U fibers defines the overall thickness of the cortex at each site (Fig 2). The cortex is thicker at the crowns of the gyri and thinner in the depths of the sulci (Fig 2). The position of layer IV within the cortex demarcates the superficial cortex (layers I, II, and III) from the deep cortex (layers V and VI). The changing position of layer IVB within the cortex indicates that the thinning of the cortex within the sulci predominantly affects the deep layers. The thickness of layer IV, the conspicuity of layer IV, and the laminar pattern of intermediate signal intensity from the cortex superficial to and deep to layer IV help to characterize the nature of the cortex as primary motor cortex, primary sensory cortex (of diverse types), or allocortex.

Heterotypical sensory isocortex.
A–C, MRM image (A) of the calcarine cortex with corresponding Nissl (B) and Luxol Fast Blue (C) stains. The thin, prominent, sharply defined intracortical band of low signal intensity corresponds to the highly myelinated plexus designated the external band of Baillarger (line of Gennari) (Layer IVB) (curved arrow in A and C). The prominent granule cells (long arrow in B) seen in layer II on the Nissl stain appear as a gray band (long arrow in A) on the MRM image. Note that the cortex is thicker at the crowns of the gyri and thinnest at the depths of the sulci. The changing relationship of layer IVB to the underlying white matter shows that the variation in cortical thickness results from thinning of the deep layers V and VI (magnification ×5).
D–G, Signal intensity profiles oriented perpendicular to the cortical surface, color coded by location on the cortex. Focal “dips” in signal intensity at the line of Gennari (1) and within the subcortical white matter (2) correspond to the presence of heavily myelinated fibers, confirmed by histologic staining (B and C). The lower signal intensity in the subcortical white matter compared with that in the line of Gennari may reflect not only the greater concentration of myelin in the U fibers but also the increased concentration of iron within them. The dip in the middle of the blue graph (E) identifies the sulcus (S) between two adjacent gyri.
The laminar pattern of the cortex is captured, in part, by the computer-generated profiles of the signal intensities across each type of cortex. In these profiles, prominent hypointensities localize the typical intracortical layer IV and the subcortical arcuate U fibers. The position of the subcortical arcuate U fibers provides one measure of the total thickness of the cortex. The position of layer IV within the cortex helps to characterize the thickness of the cortical layers superficial to and deep to layer IV. The width and depth of the downward deflections in signal intensity characterize the thickness and margination of individual cortical layers such as layer IV. These features, and the overall shape of the signal intensity profile, provide a first approximation to MR definition of the cytoarchitecture of normal human cortex.
Discussion
The human brain exhibits at least two types of cortices: a six-layered neocortex that constitutes most of the cerebral cortex, and a cytologically different allocortex that constitutes the olfactory cortex and the hippocampal formation (5, 11). At the borders of these two cortices, a transitional periallocortex may be found (5, 7, 11). Distinct patterns of cytologic structure are found in specific portions of the brain.
Cortical Architecture: An Overview
The Neocortex: Horizontal Lamination
The neocortex exhibits six layers of cells (Fig 1), including two granule cell layers (layers II and IV) and two pyramidal cell layers (layers III and V) (5, 11, 23). From superficial to deep, the six layers of the human neocortex consist of the following.
I, The Molecular Layer (Plexiform Layer).
Layer I is a sparsely cellular lamina that appears hyperintense on the MRM image (Fig 1).
II, The External Granular Cell Layer.
Layer II consists primarily of closely packed granule cells that are seen as a band of intermediate signal intensity situated just deep to the hyperintense layer I (Fig 1).
III, The External Pyramidal Cell Layer.
Layer III predominantly comprises pyramidal cells with scattered nonpyramidal cells. MRM typically displays the full thickness of layer III as a band that is slightly more hyperintense than that of the superjacent layer II, but differentiation of layer II from layer III proved difficult in some sections (Fig 1).
IV, The Internal Granular Cell Layer.
Layer IV is usually the narrowest of the cortical layers (except in sensory koniocortex [BA 3, 17 and 41]) and contains densely packed stellate cells and a variety of granule cells. It is subdivided into a superficial portion (IVA) and a deep portion that is permeated by a very dense horizontal plexus of myelinated fibers designated the external band of Baillarger (IVB) (Fig 1). MRM displays layer IV as a sharply defined, dark gray to black band (Fig 1). The primary visual (calcarine) cortex contains the thickest IVB, called the line of Gennari (Fig 2).
V, The Internal Pyramidal Cell Layer.
Layer V contains large pyramidal cells and scattered nonpyramidal cells. The superficial portion (Va) contains scattered pyramidal cells, whereas the deep portion (Vb) contains both pyramidal cells and a horizontal plexus of myelinated fibers designated the internal band of Baillarger. The internal band of Baillarger (layer Vb) is much thinner than layer IVB, forms a less densely interwoven plexus of myelinated fibers, and appears less distinct on MR images. On MRM images, layer Va is distinguished as a hyperintense band just deep to the hypointense, myelinated layer IVB. Layer Vb, however, merges into the hypointense band formed by the subjacent layer VI (Fig 1).
VI, The Multiform Layer (Fusiform or Pleomorphic Layer).
Layer VI is relatively thin and mostly comprises densely arranged, spindle-shaped cells interspersed with fiber bundles. MRM displays layer VI as a dark-gray zone that merges with the more superficial layer Vb (Fig 1).
The Neocortex: Lamination, Connections, and Parcellation
The cortical layers represent horizontal aggregations of neurons with common connections. The variations observed in the laminar appearance of the cortex reflect variations in the cellular composition and packing of each layer, the relative degrees of myelination in each layer and sublayer, and their interconnections with adjacent areas (5, 11). These variations in laminar structure give each cortical region a specific cytoarchitecture that subserves the function of that region. These variations also influence the ease with which the six layers of cells can be discerned. Isocortex containing six readily discernable layers is designated homotypical, whereas isocortex in which one or more layers show functional modification is designated heterotypical (5).
Von Economo (25) classified the cerebral isocortex into five types (Table). These five types are: 1) agranular, 2) frontal, 3) parietal, 4) polar, and 5) granular (koniocortex or dustlike cortex). Cortical Types 2, 3, and 4 are homotypical. Types 1 and 5 are heterotypical. The primary sensory cortices for vision (calcarine cortex) (Fig 2), audition (Heschl’s gyrus), and somatosensory perception (postcentral cortex) are specific examples of heterotypical koniocortex. Heterotypical cortex type 1 (agranular cortex) is specialized for motor function, as exemplified by the primary motor area (M1) of the precentral gyrus.
Five Types of Neocortex and Corresponding Locations
Brodmann (1909) recognized specific patterns of variation in the cortical architecture, parcellated the cortex into cytoarchitectonic areas, numbered them, and tried to relate cortical architecture to function (24). These regions are now designated the Brodmann areas (BAs). Later authors have refined these initial divisions (25–39).
The Allocortex
The allocortex includes the olfactory cortex, the dentate gyrus, and the hippocampus proper (synonym, cornu ammonis [CA]) (8). The hippocampal formation includes both gray matter and white matter arrayed around the hippocampal fissure (8, 12, 13). The gray matter includes the dentate gyrus, the subiculum, and the hippocampus proper. The white matter includes the alveus and the fimbria that together constitute the fornix.
Dentate Gyrus.
From superficial to deep, the three strata of the dentate gyrus are designated the stratum moleculare, the stratum granulosum, and the polymorphic layer. The stratum moleculare lies just deep to the hippocampal sulcus and appears as a hyperintense layer on MRM images (Fig 3). The stratum granulosum (dentate granule cell basket) is a thin, very sharply defined layer of densely packed, small, round, granular neurons nearly devoid of myelin. On MRM images, this appears as a thin, finely delineated, dark-gray band with a characteristic curvilinear shape (Fig 3). The polymorphic layer is the thinnest of the three dentate layers and contains the axons that cross from the granule cell neurons of the dentate gyrus to the hippocampus proper. On MRM images, the polymorphic layer is just discernible as a faint, thin, hyperintense band situated between the hypointense stratum granulosum and the gray matter of the hippocampus proper (CA4) (Fig 3).

Allocortex of the hippocampal formation.
A and B, MRM images of adjacent sections through the midhippocampal formation in the coronal plane.
C, Nissl stain specimen corresponding to A. From lateral to medial, the MRM displays: 1, alveus; 2, stratum oriens; 3, stratum pyramidale; 4, stratum radiatum; 5, stratum lacunosum; 6, stratum moleculare; 7, hippocampal sulcus; 8, stratum moleculare; 9, the dentate granule cell layer (straight arrow in A, B, and C); and 10, the polymorphic layer (arrowhead in B and C). Also seen are the caudate nucleus (CN), subiculum (Sub), and the lamellar retinotopic organization of the lateral geniculate body (curved arrow) (magnification ×6.25).
Hippocampus Proper (CA) (CA1–CA4).
The remaining horizontal laminations of the hippocampal formation form six strata: the alveus, stratum oriens, stratum pyramidale, stratum radiatum, stratum lacunosum, and stratum moleculare (cited in order from the ependyma to the hippocampal sulcus) (Fig 3)
The alveus is a thin subependymal layer of white matter seen as a sharply marginated band of very low signal intensity just deep to the edge of the temporal horn (Fig 3).
The stratum oriens includes scattered neurons (basket cells) crossed by axons from the adjacent stratum pyramidale. On MRM images, it is seen as a hyperintense band that merges with the underlying stratum pyramidale (Fig 3).
The stratum pyramidale includes prominent pyramidal cells arrayed in a spiral and organized into four fields of cells designated CA1–CA4. On MRM images, the stratum oriens and the loose pyramidal cells of CA1 merge into a single hyperintense band (Fig 3).
The stratum radiatum contains apical dendrites that arise from the pyramidal neurons of the stratum pyramidale. On MRM images, the stratum radiatum appears as a gray band (Fig 3).
The stratum lacunosum contains numerous fascicles of axons from the perforating fibers and the Schaffer collaterals, which run parallel to the surface of the CA. This layer cannot be distinguished separately from the stratum moleculare on either MRM images or Nissl stains (Fig 3); however, its low signal intensity is better defined in the more anterior section shown (Fig 4). Hypointensity on MRM images and the corresponding dip in the signal intensity profile correlate with high myelin content (Fig 4).
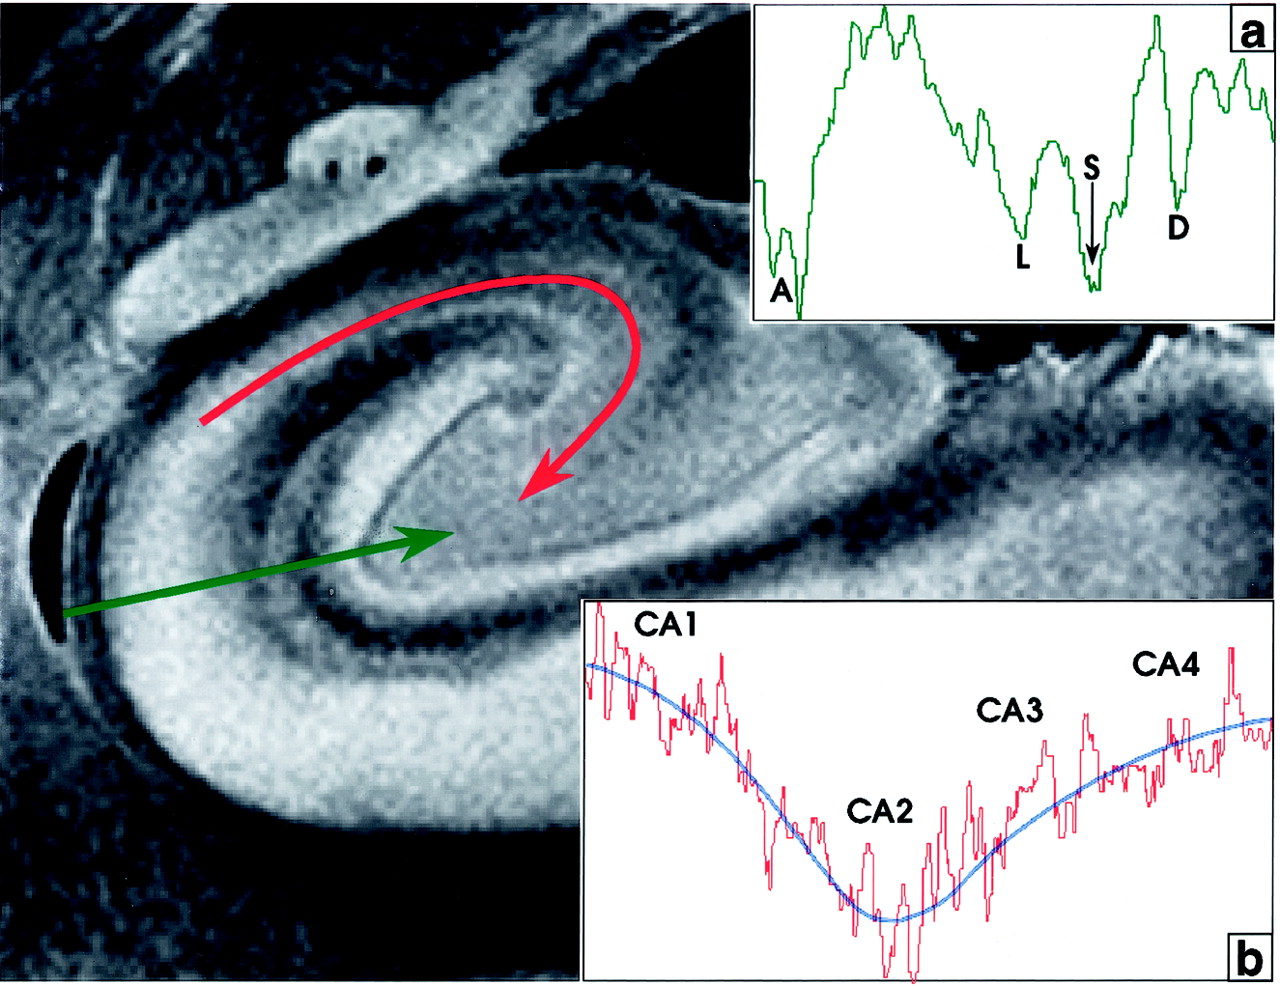
Signal intensity profiles of the hippocampal allocortex. The profile perpendicular to the cortex (green line, profile in inset a) displays deep dips of low signal intensity at the acellular heavily myelinated alveus (A), the stratum lacunosum (L), the hippocampal sulcus (S), and the unmyelinated densely cellular dentate granule cell layer (D). In the profile along the CA from CA1 to CA4 (curved red line, profile in inset b), signal intensity is inversely related to cellular density. Signal intensity is highest in CA1 (lowest cellular density), decreases to its lowest signal intensity in CA2 (highest cellular density), and then rises progressively toward CA4, as cell density decreases. The blue line fitted to this signal intensity curve approximates an average of the signal intensity in each area. Note that signal intensity in CA4 is lower than that in CA1.
The stratum moleculare contains a few neurons and dendritic connections to the adjacent layers and appears as a single, hyperintense, slightly heterogeneous band that lies just lateral to the hippocampal sulcus (Fig 3).
The MRM appearance of the hippocampal formation varies along the formation. Lorente de No (29, 30) described four fields of hippocampal pyramidal cell neurons, designated CA1, 2, 3 and 4. CA1 consists of scattered pyramidal cells and is seen as the hyperintense band described above. CA2 consists of a narrow band of densely packed pyramidal cells that appear as a narrow gray band, distinct from the broader, more hyperintense band of CA1. The densely packed strata of pyramidal cells in CA3 form the genu of the CA, where it enters the concavity of the dentate gyrus (Fig 3). This appears on MRM images as a curvilinear, gray band. CA3 is also characterized by the presence of a stratum lucidum, which appears hyperintense on MRM images. This supplementary layer contains mossy fibers that originate in the dentate gyrus. The CA3 pyramidal layer continues into the hilus of the dentate gyrus, where it is designated CA4. CA4 contains scattered, large, ovoid pyramidal cells and myelinated fibers, and appears gray on MRM images (Fig 3). Signal intensity profiles along the hippocampal fields CA1 through CA4 document that the gradation in signal intensity accurately reflects the gradation in cell density and myelination (Fig 4).
The Transitional Cortex
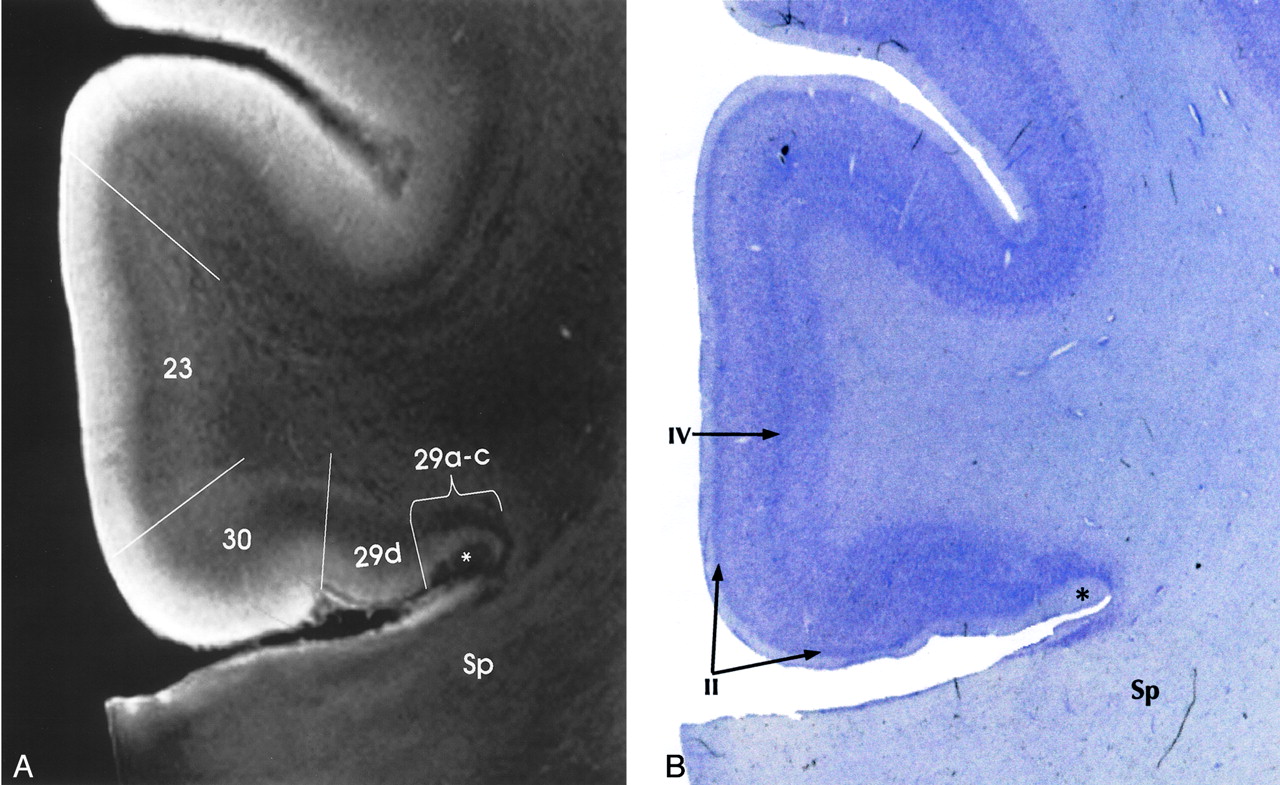
Transitional cortex (periallocortex) is found in the retrosplenial region (BA 29 and 30), the anterior cingulate cortex (BA 23, 24a-c, and 25), and the ectosplenial cortex of area 26 (19, 33, 38, 39). BA 29a-d constitutes the granular retrosplenial cortex. BA 29a-c contain a very thick layer I, a plexus of myelinated fibers in the superficial portion of the thick layer I, and densely packed darkly staining neurons immediately deep to layer I. On MRM images, areas 29a-c showed the expected thickness of layer I and very low signal intensity at the superficial aspect of that layer, corresponding to the superficial myelinated plexus (Fig 5). BA 29d is distinguished by the broadening of the overall thickness of the cortex, increased definition of individual cell layers, and the emergence of a layer of loosely packed pyramidal neurons interposed between layers I and IV. MRM clearly depicts this region, although not as clearly as the Nissl stain of the same specimen (Fig 5).

Transitional cortex in the retrosplenial region of the cingulate gyrus. MRM (A) and Nissl stain (B) show progressive thickening of the cortex and increasing definition of the individual layers from the periallocortical regions (BA 29, 30) into the adjacent isocortex (BA 23). BA 29a-c are characterized by a thin cortex with very prominent myelination (asterisk) in a thick layer I. BA 29d shows funnel-shaped broadening of the cortex toward BA 30, with poor lamination, but beginning definition of layer II. BA 30 shows greater cortical thickness and a well-defined layer II. Isocortical BA 23 shows clear definition of layer IV as well as layer II. Sp indicates splenium (magnification ×6.25).
BA 30 is designated the agranular-dysgranular subdivision of the retrosplenium (19, 33, 38, 39). In this area, the cortex continues to thicken (even as layer I becomes less prominent), and granule cell layer II shows progressively increasing definition. MRM showed the incipient layer II as a faint gray band interposed between the hyperintense layers I and III (Fig 5). Adjacent to BA 23 is the six-layered isocortex of BA 30, the layers of which are indistinct both histologically and on MRM images.
Signal Intensity Profiles
With the pulse sequence used, at 9.4 T, low signal intensity in the cerebral cortex is felt to represent high myelin density (as in layer IVB in Fig 2), or high cellular density (as in the dentate granule cell layer in Fig 3). Iron, histologically shown to be present within the U fibers, may help to explain signal intensity decreases beyond those expected from high myelin density alone (40). This concept of dual causes for low signal intensity is supported by the parallel gradations in signal intensity, cellular density, and myelination, as shown by the signal intensity profiles obtained both across the different layers of cortex (Fig 2) and along the hippocampal fields CA1–CA4 (Fig 4).
Utility of Cortical Imaging
Knowledge of cortical structure and intracortical lamination helps explain the in vivo imaging appearance of the human cortex. Meyer et al (41) noted that the motor isocortex was perceptibly thicker than the somatosensory isocortex. By use of MR imaging at 1.5 T and taking this difference into account, they identified the central sulcus. By use of T2-weighted coronal imaging at 1.5 T, Yoshiura et al (42) demonstrated that the high cellular density within the sensory isocortex (koniocortex) of Heschl’s gyrus correlated with low signal intensity (compared with that in adjacent superior temporal gyrus). With standard spin-echo sequences at 1.5 T, Naidich et al (12, 13) displayed the lamellar architecture of the hippocampal formation. Hirai et al (43), using turbo fluid-attenuated inversion recovery imaging at l.5 T, have since demonstrated differing signal intensities of the limbic and other cortices. It is fully expected that increasing familiarity with the laminar anatomy of the human cortex will lead to additional clinically useful correlations of intracortical anatomy with MR images, especially as higher field strength (ie, 3T–8T) systems begin to enter routine clinical practice. MRM may then provide criteria for beginning to characterize and identify the cortical type, the cytoarchitecture, and the BA designations among patients by means of computer-generated signal intensity profiles of in vivo MR images.
Technical Considerations
Despite our efforts, the surfaces of the specimens showed a thin rim of increased signal intensity that could represent fixation artifact or MR edge artifact or both. To reduce fixation artifacts caused by uneven infiltration of formalin into the tissue, all specimens were deliberately fixed in 10% formalin for an additional 2 weeks after harvest from the parent hemisphere. To reduce edge artifact, the specimens were all embedded in Fomblin for scanning and wedged into position with styrofoam plugs to reduce vibration. Nevertheless, artifactually increased signal intensity at the cortical surfaces produced a superficial hyperintense “stripe” of variable thickness. This artifact was most prominent in relation to large pools of overlying fluid. Therefore, one could attempt to minimize this problem by carefully tracing each cortical layer from the crown of the gyrus (where the artifact is greatest) into the depths of a narrow sulcus (where the artifact is least) to see which portion of the superficial signal intensity may be attributed to the artifact and which to layer I. However, the artifact still limits interpretation of the cortical lamination and of the signal intensity profiles.
Conclusion
This study demonstrates that intermediate-weighted, high-spatial-resolution MRM at 9.4 T can display the horizontal laminar pattern of formalin-fixed human cerebral isocortex, allocortex, and periallocortex. With the pulse sequence used, signal intensity correlates with the degree of myelination and cell density of the intracortical layers. Because the patterns discerned by MRM form one basis for the cytoarchitectonic classification of BAs, this study lends support to the concept that in the future MRM may depict BAs directly rather than by inference from gross anatomic location. Signal intensity profiles provide one method for capturing these relationships. The application of MRM and signal intensity profiles for identifying and characterizing intracortical disease is now under active investigation.
Acknowledgments
The authors wish to express their deep gratitude to both Edwin Lugo of the Division of Neuropathology and John C. Gentile of the Department of Radiology, The Mount Sinai School of Medicine, for their help with this project.
Footnotes
Presented at the 39th Annual Meeting and Scientific Assembly of the American Society of Neuroradiology, Paper 457, Boston, MA, April 27, 2001.
References
- Received August 21, 2001.
- Accepted after revision April 12, 2002.
- Copyright © American Society of Neuroradiology
In this issue


Jump to section
Related Articles
Cited By...
- Relating sex differences in cortical and hippocampal microstructure to sex hormones
- Myelination and excitation-inhibition balance synergistically shape structure-function coupling across the human cortex
- Characterization of late structural maturation with a neuroanatomical marker that considers both cortical thickness and intracortical myelination
- Quantitative MRI susceptibility mapping reveals cortical signatures of changes in iron, calcium and zinc in malformations of cortical development in children with drug-resistant epilepsy
- High-Resolution 7T MR Imaging of the Motor Cortex in Amyotrophic Lateral Sclerosis
- Ultra-High-Field MR Neuroimaging
- MRI detection of prion protein plaques in variant Creutzfeldt-Jakob disease
- BigBrain: An Ultrahigh-Resolution 3D Human Brain Model
- Mapping Human Cortical Areas In Vivo Based on Myelin Content as Revealed by T1- and T2-Weighted MRI
- Combined 7-T MRI and histopathologic study of normal and dysplastic samples from patients with TLE
- Histologically Confirmed Hippocampal Structural Features Revealed by 3T MR Imaging: Potential to Increase Diagnostic Specificity of Mesial Temporal Sclerosis
- Phase maps reveal cortical architecture
- Diffusion Tensor Microscopy Indicates the Cytoarchitectural Basis for Diffusion Anisotropy in the Human Hippocampus