Advertisement

Main menu

  • Home
  • Content
    • Current Issue
    • Publication Preview--Ahead of Print
    • Past Issue Archive
    • Case of the Week Archive
    • Classic Case Archive
    • Case of the Month Archive
  • For Authors
  • About Us
    • About AJNR
    • Editors
    • American Society of Neuroradiology
  • Submit a Manuscript
  • Podcasts
    • Subscribe on iTunes
    • Subscribe on Stitcher
  • More
    • Subscribers
    • Permissions
    • Advertisers
    • Alerts
    • Feedback
  • Other Publications
    • ajnr

User menu

  • Subscribe
  • Alerts
  • Log in

Search

  • Advanced search
American Journal of Neuroradiology

American Journal of Neuroradiology

  • Subscribe
  • Alerts
  • Log in

Advanced Search

  • Home
  • Content
    • Current Issue
    • Publication Preview--Ahead of Print
    • Past Issue Archive
    • Case of the Week Archive
    • Classic Case Archive
    • Case of the Month Archive
  • For Authors
  • About Us
    • About AJNR
    • Editors
    • American Society of Neuroradiology
  • Submit a Manuscript
  • Podcasts
    • Subscribe on iTunes
    • Subscribe on Stitcher
  • More
    • Subscribers
    • Permissions
    • Advertisers
    • Alerts
    • Feedback
  • Follow AJNR on Twitter
  • Visit AJNR on Facebook
  • Follow AJNR on Instagram
  • Join AJNR on LinkedIn
  • RSS Feeds
Research ArticleBRAIN

Evolution of Lesions in Susac Syndrome at Serial MR Imaging with Diffusion-Weighted Imaging and Apparent Diffusion Coefficient Values

Matthew L. White, Yan Zhang and Wendy R. K. Smoker
American Journal of Neuroradiology May 2004, 25 (5) 706-713;
Matthew L. White
  • Find this author on Google Scholar
  • Find this author on PubMed
  • Search for this author on this site
Yan Zhang
  • Find this author on Google Scholar
  • Find this author on PubMed
  • Search for this author on this site
Wendy R. K. Smoker
  • Find this author on Google Scholar
  • Find this author on PubMed
  • Search for this author on this site
  • Article
  • Figures & Data
  • Info & Metrics
  • References
  • PDF
Loading

Article Figures & Data

Figures

  • Tables
  • Fig 1.
    • Download figure
    • Open in new tab
    • Download powerpoint
    Fig 1.

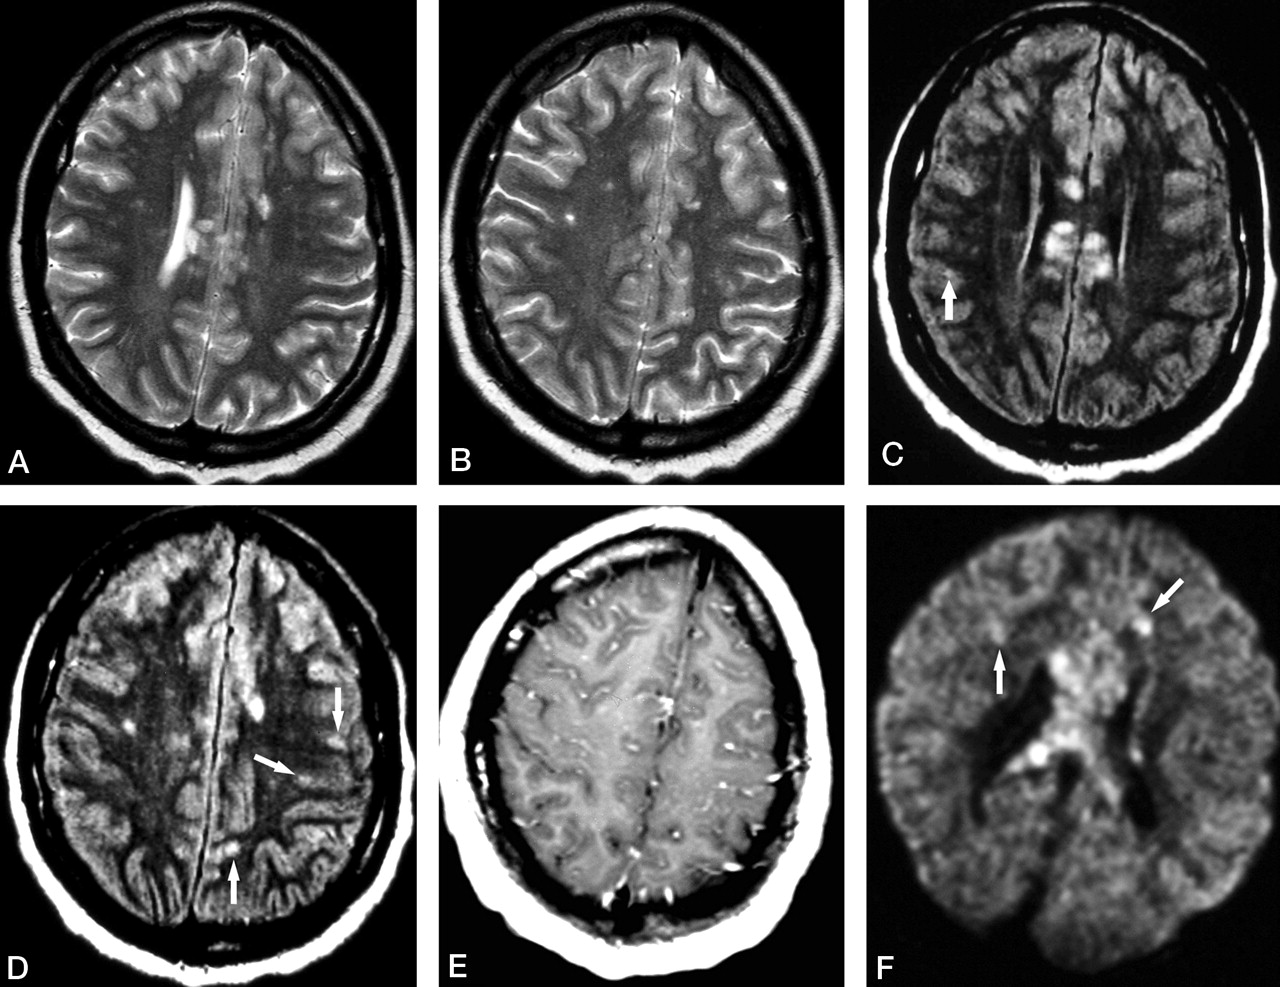
    Patient 1. Initial MR examination at 2 weeks from the onset of symptoms.

    A and B, Axial T2-weighted images show multiple hyperintense lesions involving the corpus callosum and cerebral white matter.

    C and D, Axial FLAIR images at almost the same levels as in A and B show hyperintense lesions not only in the corpus callosum and cerebral white matter but also in the cerebral cortex (arrows).

    E, Contrast-enhanced axial T1-weighted image shows diffuse leptomeningeal enhancement.

    F, Axial DWI shows several hyperintense lesions in the cerebral white matter (arrows), with a cluster of lesions in the corpus callosum.

  • Fig 2.
    • Download figure
    • Open in new tab
    • Download powerpoint
    Fig 2.

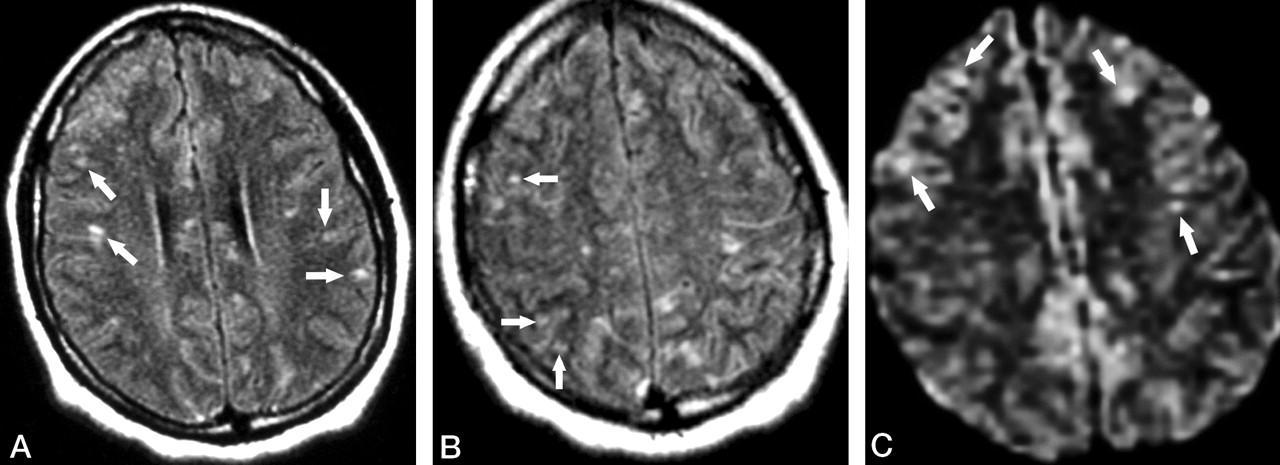
    Patient 1. Second MR examination shortly after relapse of the symptoms (8 weeks from initial onset).

    A and B, Axial FLAIR images show that the lesions in the corpus callosum have decreased in size and number compared with those in Figure 1. However, new punctate hyperintense lesions appeared in the cerebral cortex (arrows).

    C, Axial DWI also reveals the scattered hyperintense lesions in the cerebral cortex (arrows).

  • Fig 3.
    • Download figure
    • Open in new tab
    • Download powerpoint
    Fig 3.

    Patient 1. Third MR examination at 2 weeks following relapse of the symptoms (10 weeks from initial onset).

    A and B, Axial FLAIR images show multiple hyperintense lesions in the basal ganglia and thalami bilaterally, as well as in the left cerebellar peduncle and left dentate nucleus. A questionable small lesion is seen in the cortex (arrow in A).

    C, Axial DWI shows a hyperintense lesion in the right caudate head (arrow), which was not depicted by either FLAIR or T2-weighted images (not shown).

  • Fig 4.
    • Download figure
    • Open in new tab
    • Download powerpoint
    Fig 4.

    Patient 1. Fourth MR examination at 8 months from the onset of symptoms. Axial FLAIR image shows diffuse, bilateral, confluent increased signal intensity in the deep white matter. Note the enlarged ventricles and mildly prominent sulci; this is consistent with cerebral atrophy.

Tables

  • Figures
    • View popup
    TABLE 1:

    Clinical histories and presentations in patients with Susac syndrome

    Clinical courseSymptomsMR ExaminationAuditory FindingsRetinal FindingsTreatment*
    Patient 1
     Initial admission, 2 wk after onsetHeadaches, vomiting, R arm feeling loss, impaired balance, urinary incontinence, dysarthria, decreased attention span, gait ataxia2 wk after onsetNormalR branch retinal artery occlusionIV SoluMedrol 1 g/d × 5, IVIG 0.4 g/d × 5, prednisone 60 mg/d (with taper)
     Symptom relapse, 8 wk after initial onsetHeadaches, cognitive decline, clumsiness, worsened gait ataxia, upper extremity ataxia8 and 10 wk after initial onsetL high-frequency hearing lossNew L branch retinal artery occlusionIVIG 0.4 g/d × 5, prednisone 50 mg/d (with taper)
     Stable condition, 8–9 mo after initial onsetDifficult in tandem walking, mild dysmetria8 mo after initial onsetNo changeNo new occlusionPrednisone 20 mg/d
    Patient 2
     Initial admission, 2 wk after onsetHeadaches, R partial vision loss2 wk after onsetNormalR branch retinal artery occlusionAspirin
     Symptom relapse, 6 wk after initial onsetHeadaches, R face and arm numbness6 wk after initial onsetNormalNew L branch retinal artery occlusionIV methylprednisolone 1 g × 1, prednisone 80 mg/d (with taper)
     Symptom relapse, 4 mo after initial onsetL arm parethesias, R extremity weakness, staggering walking4 mo after initial onsetR partial hearing lossNew R/L branch retinal artery occlusionIVIG 0.4 g/d × 5 (monthly basis for 4 consecutive mo), prednisone 60 mg/d (with taper)
     Worsening symptoms, 11 mo after initial onsetWorsening in vision, poor concentration, confusion, impaired balance11 mo after initial onsetNo changeNo changeIVIG 0.4 gm/d × 5 (almost every 6–8 wk for 1 y)
     Stable condition, 2 y laterMild ataxia, poor tandemNormalNormal
    • Note.—IV indicates intravenous; IVIG, intravenous immunoglobulin.

    • View popup
    TABLE 2:

    Distribution and number of lesions detected at serial MR studies in patient 1

    Clinical Course and MR StudyCerebral White MatterCerebral CortexCorpus CallosumBasal GangliaCerebellar HemisphereCerebellar Peduncle
    2 wk after onset
     T2WI18022548
     FLAIR221520524
     DWI2011330
    8 wk, relapse of symptoms
     T2WI28014406
     FLAIR313715501
     DWI4329100
    10 wk, relapse of symptoms
     T2WI*130162041
     FLAIR3261723111
     DWI005100
    8 mo, stable condition
     T2WI407301
     FLAIR203301
     DWI000000
    • Note.—T2WI indicates T2-weighted imaging.

    • * Some small lesions could not be identified because of motion artifact.

    • View popup
    TABLE 3:

    Distribution and number of lesions detected at serial MR studies in patient 2

    Clinical Course and MR StudyCerebral White MatterCerebral CortexCorpus CallosumBasal GangliaCerebellar HemisphereCerebellar Peduncle
    2 wk after onset
     T2WI200000
     FLAIR400010
     DWI170000
    6 wk, relapse of symptoms
     T2WI705102
     FLAIR905102
     DWI032100
    4 mo, relapse of symptoms
     T2WI1305102
     FLAIR1015102
     DWI113000
    11 mo, worsening of symptoms
     T2WI43341946
     FLAIR521551786
     DWI727502
    • Note.—T2WI indicates T2-weighted imaging.

PreviousNext
Back to top

In this issue

American Journal of Neuroradiology: 25 (5)
American Journal of Neuroradiology
Vol. 25, Issue 5
1 May 2004
  • Table of Contents
  • Index by author
Advertisement
Print
Download PDF
Email Article

Thank you for your interest in spreading the word on American Journal of Neuroradiology.

NOTE: We only request your email address so that the person you are recommending the page to knows that you wanted them to see it, and that it is not junk mail. We do not capture any email address.

Enter multiple addresses on separate lines or separate them with commas.
Evolution of Lesions in Susac Syndrome at Serial MR Imaging with Diffusion-Weighted Imaging and Apparent Diffusion Coefficient Values
(Your Name) has sent you a message from American Journal of Neuroradiology
(Your Name) thought you would like to see the American Journal of Neuroradiology web site.
CAPTCHA
This question is for testing whether or not you are a human visitor and to prevent automated spam submissions.
Citation Tools
Evolution of Lesions in Susac Syndrome at Serial MR Imaging with Diffusion-Weighted Imaging and Apparent Diffusion Coefficient Values
Matthew L. White, Yan Zhang, Wendy R. K. Smoker
American Journal of Neuroradiology May 2004, 25 (5) 706-713;

Citation Manager Formats

  • BibTeX
  • Bookends
  • EasyBib
  • EndNote (tagged)
  • EndNote 8 (xml)
  • Medlars
  • Mendeley
  • Papers
  • RefWorks Tagged
  • Ref Manager
  • RIS
  • Zotero
Share
Evolution of Lesions in Susac Syndrome at Serial MR Imaging with Diffusion-Weighted Imaging and Apparent Diffusion Coefficient Values
Matthew L. White, Yan Zhang, Wendy R. K. Smoker
American Journal of Neuroradiology May 2004, 25 (5) 706-713;
del.icio.us logo Digg logo Reddit logo Twitter logo Facebook logo Google logo Mendeley logo
  • Tweet Widget
  • Facebook Like
  • Google Plus One

Jump to section

  • Article
    • Abstract
    • Methods
    • Results
    • Discussion
    • Footnotes
    • References
  • Figures & Data
  • Info & Metrics
  • References
  • PDF

Related Articles

  • No related articles found.
  • PubMed
  • Google Scholar

Cited By...

  • Diagnosis and Prediction of Relapses in Susac Syndrome: A New Use for MR Postcontrast FLAIR Leptomeningeal Enhancement
  • Diagnostic criteria for Susac syndrome
  • What to see when you are looking at confusion: a review of the neuroimaging of acute encephalopathy
  • Clinical Reasoning: A 28-year-old pregnant woman with encephalopathy
  • Crossref
  • Google Scholar

This article has not yet been cited by articles in journals that are participating in Crossref Cited-by Linking.

More in this TOC Section

  • Predictors of Reperfusion in Patients with Acute Ischemic Stroke
  • Enhanced Axonal Metabolism during Early Natalizumab Treatment in Relapsing-Remitting Multiple Sclerosis
  • SWI or T2*: Which MRI Sequence to Use in the Detection of Cerebral Microbleeds? The Karolinska Imaging Dementia Study
Show more BRAIN

Similar Articles

Advertisement

News and Updates

  • Lucien Levy Best Research Article Award
  • Thanks to our 2021 Distinguished Reviewers
  • Press Releases

Resources

  • Evidence-Based Medicine Level Guide
  • How to Participate in a Tweet Chat
  • AJNR Podcast Archive
  • Ideas for Publicizing Your Research
  • Librarian Resources
  • Terms and Conditions

Opportunities

  • Share Your Art in Perspectives
  • Get Peer Review Credit from Publons
  • Moderate a Tweet Chat

American Society of Neuroradiology

  • Neurographics
  • ASNR Annual Meeting
  • Fellowship Portal
  • Position Statements

© 2022 by the American Society of Neuroradiology | Print ISSN: 0195-6108 Online ISSN: 1936-959X

Powered by HighWire