
Abstract
BACKGROUND AND PURPOSE: Defining viability and the potential for recovery of ischemic brain tissue can be very valuable for patient selection for acute stroke therapies. Multiparametric MR imaging analysis of ischemic lesions indicates that the ischemic lesion is inhomogeneous in degree of ischemic injury and recovery potential. We sought to define MR imaging characteristics of ischemic lesions that are compatible with viable tissue.
METHODS: We included patients with supratentorial ischemic stroke who underwent multiparametric MR imaging studies (axial multi-spin-echo T2-weighted imaging, T1-weighted imaging, and diffusion-weighted imaging) at the acute (<24 hours) and outcome (3 months) phases of stroke. Using the algorithm Iterative Self-Organizing Data Analysis Technique (ISODATA), the lesion was segmented into clusters and each was assigned a number, called the tissue signature (white matter = 1, CSF = 12, all others between these two). Recovery was defined as at least a 20% size reduction from the acute phase ISODATA lesion volume to the outcome phase T2-weighted imaging lesion volume. The tissue signature data were collapsed into the following categories: ≤3, 4, 5, and ≥6. Logistic regression analysis included the following parameters: lesion volume, tissue signature value, apparent diffusion coefficient (ADC) value, relative ADC (rADC) expressed as a ratio, T2 value, and T2 ratio. The model with the largest goodness of fit value was selected.
RESULTS: We included 48 patients (female-male ratio, 26:22; age, 64 [±14] years; 15 treated with recombinant tissue plasminogen activator [rt-PA] within 3 hours of onset; median National Institutes of Health Stroke Scale score, 7 [range, 2–26]). Median symptom onset-to-MR imaging time interval was 9.5 hours. With ISODATA processing, we generated 200 region-of-interest tissue records (one to nine tissue records per patient). Regarding tissue recovery, we detected a three-way interaction among ADC, ISODATA tissue signature, and previous treatment with rt-PA (P = .003). In the group not treated with rt-PA, ischemic tissues with acute rADC greater than the median (0.79) and tissue signature ≤4 were more likely to recover (80% vs. 31% and 13%, odds ratio [95% CI]: 0.12 [0.05, 0.30] and 0.04 [0.01, 0.18] for tissue signatures 5 and 6, respectively).
CONCLUSION: ISODATA multiparametric MR imaging of acute stroke clearly shows inhomogeneity and different viability of the ischemic lesion. Ischemic tissues with lower acute phase ISODATA tissue signature values (≤4) and higher rADC values (≥0.79) are much more likely to recover than those with higher signature values or lower rADC values. The effect of these factors on tissue recovery, however, is dependent on whether preceding treatment with rt-PA had been performed. Our approach can be a valuable tool in the design of therapeutic stroke trials with an extended time window.
MR imaging yields a wealth of information regarding the status of tissue after the onset of cerebral ischemia in humans, contributing to early diagnosis and also prognosis of acute ischemic stroke (1–6). Such physiologically significant events as edema, cellular energy failure, and hypoperfusion are accessible through manipulation of MR imaging contrast and processes. With the advent of thrombolysis during the acute phase of stroke as an effective therapy, albeit within a very restricted time window (7), it has become increasingly important for the design of clinical trials to have accurate knowledge of tissue viability before the initiation of any therapeutic agent. Equally important is the ability to define viable tissue soon after treatment with thrombolytics, so that clinical trials with developing neuroprotective salvage therapies will be rationally designed and will not include patients who are unlikely to benefit. Thus, the question regarding which MR imaging contrast mechanisms and characteristics are minimally necessary to describe tissue viability has acquired weighty clinical significance.
Diffusion-weighted imaging alone may not be capable of defining the viability of ischemic brain, mainly because the relative apparent diffusion coefficient (rADC) moves relatively rapidly from decreased values, through pseudo-normal, to elevated values (6). Furthermore, reversibility of lesions on diffusion-weighted images has been clearly shown in cases of human stroke (8). Fiehler et al (9) recently showed that within the first 3 hours after onset of stroke, the depth of rADC decrease did not predict irreversible tissue damage. In contrast, several studies indicated that the depth of rADC decrease was predictive of the irreversibility of the acute ischemic lesion within the first 24 hours and clearly after the first few hours after stroke onset (9, 10). These observations suggest that the rADC value, or most likely some combination of rADC and conventional MR imaging, could be a predictor of the irreversibility of the ischemic lesion, as Welch et al (6) reported.
The ischemic lesion is inhomogeneous, consisting of various segments that evolve toward necrosis or recovery at a different pace (11). Nagesh et al (12), by using the Iterative Self-Organizing Data Analysis Technique (ISODATA) method, showed this heterogeneity of rADC in acute stroke <10 hours from symptom onset by showing hyperacute pseudonormalization and elevation of rADC in various portions of the ischemic zone. Also using the ISODATA method of postprocessing cluster analysis in experimental animal stroke models, our group has shown that MR imaging segmentation by ISODATA generates different zones within the lesion, reflecting inhomogeneity of tissue damage, and also that ISODATA segmentation identifies a gradation of cerebral tissue damage independent of time (13). The histologic scoring of ischemic tissue damage from 4 hours to 1 week after the onset of stroke was significantly correlated with ISODATA segmentation when a multiparametric (T2-, T1-, diffusion-weighted imaging) data set was used, indicating that the ISODATA approach can distinguish and stage the ischemic tissue. By applying a similar approach to staging of human stroke, we hypothesize that ischemic brain tissue that is still viable can be distinguished from tissue that is irreversibly damaged.
The aims of our present study were the following. First, we sought to define the apparent diffusion coefficient (ADC)/rADC and T2/relative T2 values from the acute phase MR imaging studies of untreated patients and patients after treatment with recombinant tissue plasminogen activator (rt-PA) that would predict tissue recovery at 3 months. Second, we sought to segment the acute ischemic lesion into various tissue clusters or tissue signatures by using multiparametric MR imaging ISODATA analysis and thus identify the tissue signature characteristics that would be predictive of ischemic lesion recovery at 3 months.
Methods
Patients
Patients with sudden focal neurologic deficit consistent with stroke within 24 hours of onset were recruited prospectively from the Stroke and General Neurology Services of Henry Ford Hospital, from January 1998 to January 2001. Patients with ischemic stroke, whether they had been treated with rt-PA within 3 hours of symptom onset, were recruited. The patients in this report were part of a larger cohort of 168 patients who had ischemic stroke and were enrolled in the prospective MR Imaging-Stroke Study.
Stroke onset was defined as the last time the patient was known to be without neurologic deficit. All patients were examined by the study neurologist (P.D.M.). The clinical neurologic deficit was graded by using the National Institutes of Health Stroke Scale score, which was assessed at the time of each MR imaging study. The stroke subtype was defined according to the Trial of Org 10172 in Acute Stroke Treatment classification, based on the entire diagnostic evaluation the patient underwent during hospitalization and follow-up. MR imaging studies were performed according to the protocol specified below at the following time intervals after stroke onset: acute, <24 hours; sub-acute, 3–5 days; outcome, 90 days. Patients were excluded if they had cerebral hemorrhage, preexisting significant neurologic conditions, or history of stroke that would hamper interpretation of clinical and radiologic data.
For the present analysis, we selected all patients who met the following criteria: 1) diagnosis of acute ischemic stroke, 2) acute phase MR imaging completed within 24 hours of stroke onset, 3) outcome phase MR imaging completed at 3-month follow-up assessment, 4) supratentorial stroke, and 5) MR imaging data of sufficient quality to allow computer processing and analysis.
Patients or appropriate family members provided informed consent before enrollment. The study was approved by the Human Rights Committee of the Henry Ford Health Sciences Center.
MR Imaging Data Acquisition
MR imaging studies were acquired on a 1.5-T GE Signa MR unit with echo-planar capability (General Electric, Milwaukee, WI). Each MR imaging study consisted of conventional axial multi-spin-echo T2-weighted imaging, unenhanced and contrast-enhanced T1-weighted imaging, and diffusion-weighted imaging. Sections were 6 mm for all sequences. For T1- and T2-weighted imaging, the field of view was 200 × 200 mm and the matrix was 256 × 192 pixels. For diffusion-weighted imaging, the field of view was 240 × 240 mm and the matrix was 128 × 128 pixels. Additional parameters for each study were as follows: T1-weighted imaging, 600/14 ms (TR/TE); T2-weighted imaging, 2800/30, 60, 90, 120 ms; axial diffusion-weighted imaging, echo-planar sequence, 10,000/101/1 (TR/TE/NEX), b values of 1000, 600, 300, and 0 s/mm2. The patient was clinically monitored throughout the acquisition of the images.
MR Image Preprocessing
MR imaging data analyses were conducted on a Sun ULTRA 2 workstation (Sun Microsystems Inc., Mountain View, CA) with Eigentool image analysis software (Henry Ford Health System, Detroit, MI). Eigentool has a comprehensive set of functions for displaying, restoring, enhancing, and analyzing images. After reconstruction, all image volumes were co-registered and warped to the acute T2-weighted imaging volume (see below), after which images were preprocessed to segment the intracranial volume (sub-imaging) and to suppress noise. Sub-imaging of the intracranial volume was accomplished by using thresholding and morphologic operations to segment and remove the image background, skull, scalp, eyes, and other extracranial structures. After sub-imaging, the images were noise-reduced by using a nonlinear restoration filter to reduce noise while preserving edges and partial volume effects (14).
Co-registration and Curve-Fitting
Co-registration and warping were used to correct for the misalignment and mismatch among the different imaging modalities caused by patient movement or other factors (15). After registration, maps of the trace ADC and T2 were created pixel by pixel for each time point. For each direction of diffusion gradient weight (x, y, z), signal intensity was normalized to the b = 0 value and was log-transformed. The transformed data were fitted versus b value by using a least-squares linear model; the negative slope of this fit estimated the ADC for that gradient direction. The three ADC coefficients thus obtained were averaged to provide the trace diffusion coefficient. As for T2, the signal intensity for each echo was normalized to the first echo and was then log-transformed. The data were fitted versus TE to a least-squares linear model, the negative slope of which provided an estimate of T2. The ADC and T2 maps were used to overlay the region of interest of the signatures made by ISODATA and to obtain the ADC and T2 mean values for each region of interest. Because the absolute values of the ADC and T2 maps may vary among different patients and even among various sections of the same patient, we also obtained the mean ADC and T2 values of the contralateral homologous normal tissue and expressed ADC and T2 in relative terms (i.e., rADC and relative T2, defined as the ratio of mean ADC or T2 of the abnormal cluster region of interest to the mean ADC or T2 of the contralateral normal region of interest).
Warping
Co-registration of the multi-technique (spin-echo and echo-planar) images alone may not accurately match the two image volumes. Therefore, warping of the echo-planar image volume to the spin-echo volume, through a nonlinear spatial transformation, is required to match them. Co-registration was accomplished by using a modified “head and hat” surface-matching algorithm (15). This method considers the head surface defined by one data set as head and that defined by the other data set as hat. An iterative optimization method then puts the hat on the head by using as a criterion the minimization of the mean Euclidean distance between the two sets. After co-registration, warping was performed by using the deformable model reported by Ghanei et al (16). The method creates the boundary around the target image (T2-weighted image) and around the image that will be warped (diffusion-weighted image). The inverse-distance weight interpolation method is then used to calculate the projection from one image into another one. The anatomic structures are next visually checked between the warped diffusion-weighted image and the T2-weighted image for accuracy of the warping procedure. Note that because diffusion-weighted images are more distorted than other images, they were warped to fit the T2-weighted images.
Multiparameter Segmentation Technique: ISODATA Algorithm
Tissue characterization was performed of multiparameter MR imaging data by using ISODATA, a segmentation and classification algorithm that requires minimal user intervention. The neuroradiologist (S.C.P.) and the neurologist (P.D.M.) of the study selected at most three sections from each ischemic lesion for multiparametric ISODATA analysis. The section that showed the largest lesion area on diffusion-weighted images for the acute phase and the sections above and below that level were selected for analysis. In cases of small ischemic lesions, such as lacunar infarcts, two sections or even one section could show the lesion, and those were used for analysis.
The ISODATA is an unsupervised segmentation method related to the K-means algorithm, with additional splitting and merging steps that allow for the adjustment of cluster centers (17, 18). It requires no initial training procedure for segmentation. The multiparametric MR imaging data set used in the segmentation algorithm consisted of two T2-weighted imges (TE = 30, 90 ms), one T1-weighted image, and two diffusion-weighted images (b = 600, 1000 s/mm2). Our modified ISODATA algorithm consisted of the following steps: 1) the clustering parameters were input into the program; 2) the MR imaging data were partitioned into random clusters; 3) cluster centers and intra- and inter-Euclidean distances were calculated between pixel vectors and cluster centers; 4) splitting and merging of clusters were performed based on intra- and inter-Euclidean distances; and 5) steps 3 and 4 were repeated until the algorithm converged or reached the maximum number of iterations allowed.
Classification of Tissue Clusters (Tissue Status) by Standardized ISODATA
After convergence, the resultant clusters were used to construct a theme map, a color-coded composite that located on the image the different tissue signatures segmented from the data set. To compare the resultant maps among different sections and patients, we developed a technique in which ISODATA clusters were standardized on the basis of the characteristics of two known clusters: normal white matter and CSF. For comparison purposes, we assigned signature 1 (blue color on the theme map) to normal white matter and signature 12 (white color on the theme map) to CSF. We allowed ISODATA to define up to 12 signatures because ISODATA has not defined more than 11 clusters in any previous analysis. Thus, ischemic tissue clusters had signature numbers between 2 and 11, and colors between green and red on the theme map (Fig 1). Details on the steps of the standardized ISODATA algorithm were previously described (19). After the standardized ISODATA images were calculated for the different sections at each time point, the region of interest for each signature was formed. These signature regions of interest were laid on the ADC and T2 maps and were also reflected onto the contralateral normal area to obtain mean rADC and relative T2 values for each region of interest.
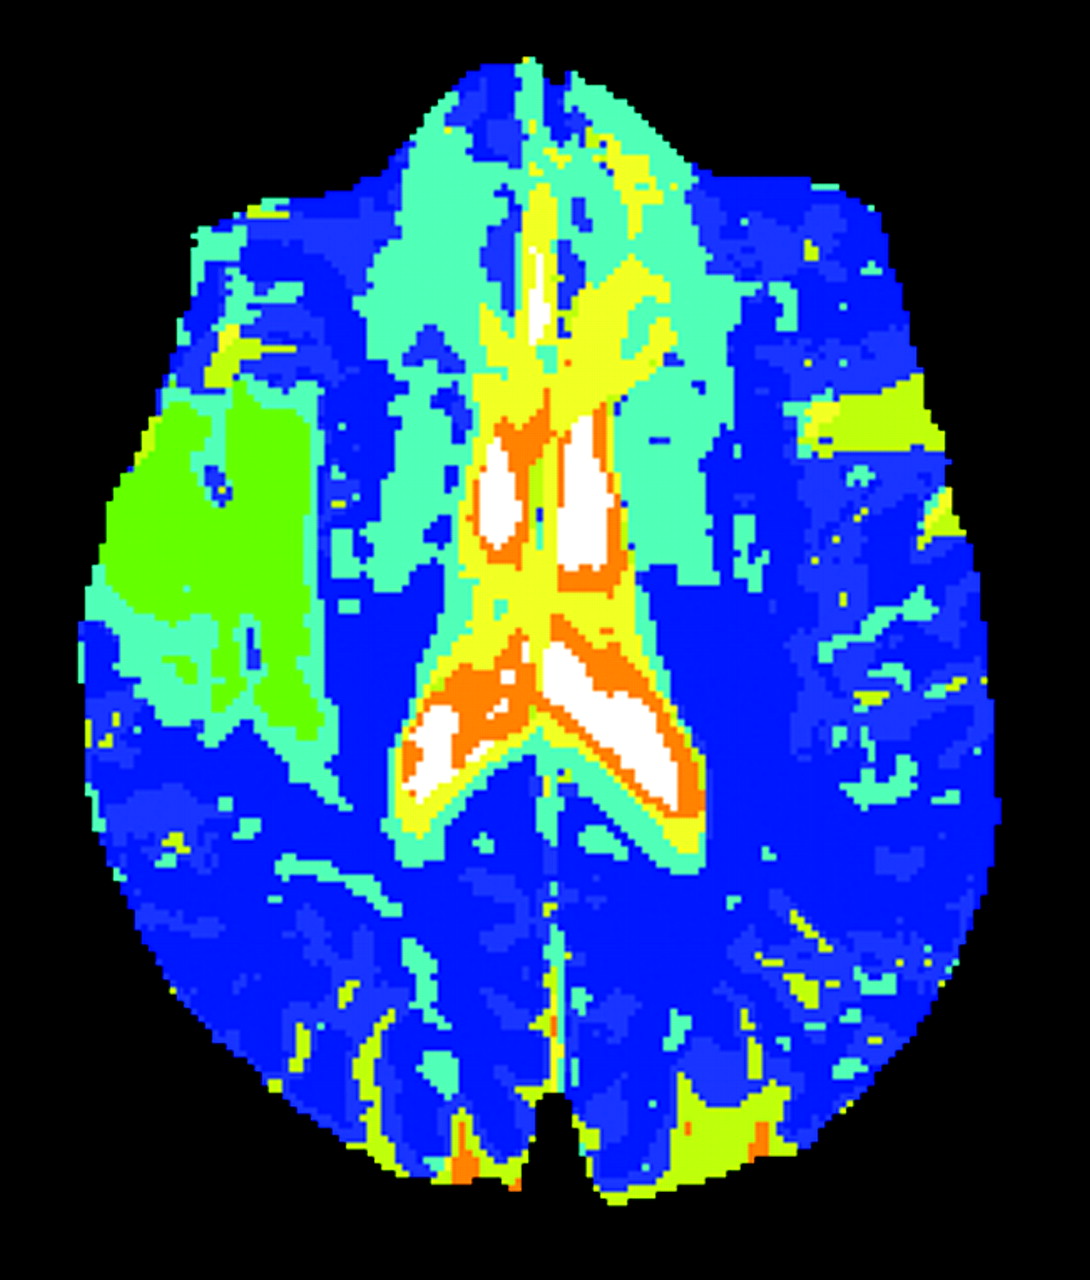
Standardized ISODATA image reveals a right hemispheric ischemic lesion. The ischemic lesion is inhomogeneous and contains two different tissue signatures (4 and 5). The MR imaging study was performed 12 hours after symptom onset.
Calculation of Tissue Recovery
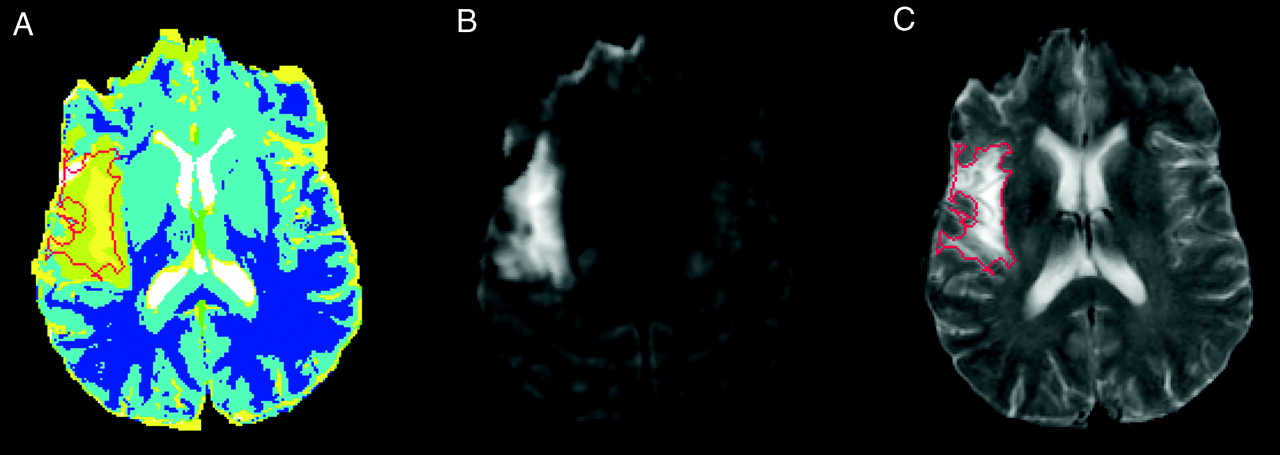
For each standardized ISODATA signature region of interest, tissue recovery was defined as the brain tissue that was considered to be a lesion based on the acute study but was shown to be normal by the T2-weighted images in the chronic study (Fig 2). Using the logical AND operation, the lesion regions of interest found at the acute time point were compared with those found at the chronic time point for each signature in each patient. The following algorithm was developed to estimate the percentage of each lesion zone (signature region of interest) that became normal between acute and chronic times: 1) make and save a binary image for each of the lesion zones (signatures within the lesion) at the acute time point (in these images, the pixels of the corresponding lesion zone will be 1 and the rest of the image pixels will be 0); 2) make and save a binary image for the total lesion at the chronic time point (in this image, the pixels corresponding to the total lesion in the chronic time—the hyperintense region on the chronic T2-weighted image—will be 1 and the rest of the image pixels will be 0); 3) apply the logical AND operation between each of the binary images made in step 1 and the image made in step 2 (this generates an image in which the pixels that remained are 1 and all other pixels are 0); and 4) calculate the number of pixels that are 1 in each of the resulting images made in step 3. This number represents the lesion size at the chronic time. As an example, if the number of pixels in signature 4 at the acute time is 100 and in the AND image is 55, the tissue recovery for signature 4 is (100 − 55) / 100, or 45%.

Calculation of tissue recovery based on acute phase ISODATA image and outcome-phase T2-weighted image.
A, Acute phase ISODATA image.
B, Acute phase diffusion-weighted image.
C, Outcome (3-month) phase T2-weighted image.
Statistical Methods
We dichotomized tissue recovery into two categories: recovery when there was at least 20% reduction in ischemic lesion size from the acute to the outcome point and no recovery if otherwise. We accepted ≥20% ischemic lesion size reduction as indication of recovery. This was an arbitrary definition that was based on the concept of resolution of the edema, present during the early phases of ischemic infarction, by the time of the outcome assessment. This most likely underestimates the degree of recovery. As for potential acute predictors of recovery, in each region of interest chosen by ISODATA characteristics, the lesion volume, tissue signature value, ADC value, rADC value, T2 value, and relative T2 value were recorded.
We first tested linearity of log odds for each MR imaging parameter. To study the predictive ability of early MR imaging parameters on the tissue response at 3 months, logistic regression analysis was conducted by using the generalized estimation equations (20), which takes into account the correlation among sections and the correlation among tissue types within sections.
We note that all the acute phase MR imaging studies of patients who were treated with rt-PA were obtained after treatment. Acutely administered IV rt-PA has been shown to improve stroke recovery and outcome (7) and also to affect other acute measures of stroke recovery (21, 22). Therefore, the predictive ability of each MR imaging parameter for recovery was evaluated, taking into account whether rt-PA was administered. We first tested the difference of each MR imaging parameter between the rt-PA treated and non-rt-PA treated groups for possible confounding effect of treatment. Univariate analyses tested whether each individual MR imaging parameter predicted a 3-month tissue response, including interactions with rt-PA treatment. All variables that had an individual effect or an interaction between the variable and treatment of rt-PA with P < .15 (23, 24) were included in the first multivariate model. Variables that were highly correlated to each other (e.g., ADC value and rADC) were evaluated separately. Two-way or three-way effects (MR imaging parameter interactions or MR imaging parameters and the treatment of rt-PA interactions) were considered only if there was one-way effect at the P < .05 level or two-way MR imaging variable-by-treatment interaction at the P < .10 level. A final multivariate model included parameters with P values < .05 or parameter-variable interactions with P < .10, after conducting the backward model selection. The odds ratio and 95% confidence interval limits of each predictive variable are reported in the final model.
An odds ratio <1 and 95% CI not including 1 indicated that tissues with a unit MR imaging parameter increment were less likely to have a positive tissue response (i.e., recovery) compared with tissues without the increment. An odds ratio >1 and 95% CI not including 1 indicated that tissues with a unit MR imaging parameter increment were more likely to have a positive tissue response compared with tissues without the increment. An MR imaging variable-by-treatment interaction indicates that the effect of the acute MR imaging status on 3 months of tissue response might be influenced by the presence or absence of rt-PA treatment. If interactions were detected in the final multivariate model, a further examination of predictive ability was performed by conducting subgroup analysis. The acute MR imaging parameters were collapsed into a binary variable or categorical variable. We chose the most likely tissue recovery group (e.g., acute phase tissue signature ≤4 and ADC value greater than or equal to the median) and the least likely tissue recovery group (e.g., acute phase tissue signature >4 and ADC value less than the median) as the reference groups, respectively. All analyses were adjusted for the ISODATA lesion volume at the acute time point, at which MR imaging parameters of larger lesions would carry more weight in the prediction of eventual tissue recovery.
We assessed the goodness of fit to compare different multivariate models (25), preferentially selecting that model with the larger goodness-of-fit value (25). Finally, the predictive ability of each model was quantified via the calculation RN by using the methods presented by Montgomery and Peck (26) and Nagelkerke (27). We note that Cox (28) concluded that in logistic regression for a binary outcome, an R2N with a value >20% is considered a good fit with a high predictive accuracy, because the dichotomized variable tends to have less power compared with a continuous variable.
Results
Sixty-eight patients in our MR imaging stroke database had acute and outcome MR imaging studies that were completed and analyzed. We excluded seven patients with brain stem infarcts, two with no visible ischemic lesion on the initial MR images, two with hemorrhagic conversion of the infarct, and nine with MR imaging quality problems precluding ISODATA analysis.
Forty-eight patients who had suffered strokes were included in this analysis. Twenty-two (46%) were male and 26 (54%) were female patients. Thirty-three (69%) were African American, and 15 (31%) were white. The mean age was 64 (±14) years. The median National Institutes of Health Stroke Scale score was 7.0 (25% and 75% quartiles: 4 and 14, respectively; range: 2–26). Fifteen patients had received rt-PA within 3 hours of stroke onset (and before the acute MR imaging study). Thirty-three (69%) patients had the acute MR imaging study performed within 12 hours of stroke onset. The median onset-to-MR imaging time was 9.5 hours. No difference was observed between the rt-PA-treated and untreated groups regarding stroke onset-to-acute MR imaging study time interval (8 vs. 10 hours, respectively; P = .14). The ischemic stroke subtypes were cardioembolic (n = 16), large vessel athero-occlusive disease (n = 7), lacune (n = 11), uncommon causes (n = 1), and undetermined or incomplete diagnostic evaluation (n = 13).
Using ISODATA processing, we generated 200 region-of-interest tissue records (one to nine tissue records per patient). The distribution of acute MR imaging parameters for all patients, and separately for rt-PA and untreated groups, is presented in Table 1. Because of low frequency of tissue signatures ≤2 (4 counts), or ≥7 (7 counts), the tissue signature data were collapsed into the following categories: ≤3, 4, 5, and ≥6. Between the rt-PA-treated and untreated groups, no difference was observed for any individual MR imaging parameter, except for the T2 value, which was higher in the rt-PA group (P = .04).
Distribution of MR Imaging Parameters during the Acute Phase of Ischemic Stroke
Table 2 details the effect of individual MR imaging parameters, including MR imaging parameter by rt-PA treatment interactions, on tissue recovery. No rt-PA treatment effect on tissue recovery (P = .37), no effect of stroke onset-to-acute MR imaging study time interval (P = .13), and no effect of stroke onset-to-acute MR imaging study time interval by rt-PA interaction on tissue recovery (P = .75) was observed. However, we detected an ISODATA tissue signature by rt-PA treatment interaction (P = .056). As expected, we observed a high correlation between absolute ADC value and rADC (Spearman correlation coefficient = 0.85), but the absolute ADC value fitted the model better than did the rADC. As a result, the absolute ADC value was included in the first step of the multivariable model along with the ISODATA tissue signature value, rt-PA treatment, ISODATA tissue signature value by rt-PA treatment interaction, and relative T2.
Association of Acute Phase MR Imaging Parameters with Outcome of ≥20% Recovery at 3 Months: Individual Parameter Effect
After a backward model selection, only the three-way interaction among ADC value, ISODATA tissue signature value, and preceding treatment with rt-PA remained in the final model (P = .003 for the three-way interaction, along with their individual and two-way interaction terms). Using the rADC instead of absolute ADC value, along with the other MR imaging parameters in this model, the three-way interaction remained significant (P = .09). The predictive ability of the final model (R2N) is high: 26% when the absolute ADC value is used and 22% when the rADC is used. Without the ISODATA tissue signature value, the predictive ability of the model for tissue recovery was 15% (falling into the moderate predictive ability category). These results indicated that the effects of acute phase ISODATA tissue signature value, absolute ADC value, or the combination of acute phase ISODATA tissue signature value and ADC on tissue recovery at the outcome phase is dependent on the presence or absence of preceding treatment with rt-PA.
To further illustrate this interaction, we grouped the tissue signature values into either a binary (≤4 or >4) or a three-category (≤4, 5, and 6) scheme and the ADC values into a binary (less than the median or greater than or equal to the median) scheme (median ADC = 609 μm2/s, median rADC = 0.79). Table 3 presents the proportion of tissue recovery based on preceding treatment with rt-PA (presence, absence), acute phase tissue signature (≤4, >4), and rADC (less than the median, greater than or equal to the median), along with the odds ratios and the 95% confidence limits for each group compared with two reference groups: 1) the most likely tissue recovery group (MLTR: rt-PA treatment, tissue signature value ≤4, and ADC greater than or equal to the median), and 2) the least likely tissue recovery group (LLTR: no rt-PA treatment, signature >4 and ADC less than the median). In the rt-PA group, no difference was observed in the proportion of tissue recovery for any tissue signature or ADC category compared with most likely tissue recovery reference group. In the untreated group, tissues with acute phase signature >4 and rADC less than the median were less likely to exhibit tissue recovery compared with the MLTR reference group (24% vs. 74%, odds ratio [95% confidence interval]: 0.12 [0.03, 0.47], P = .002). By using the LLTR as the reference group, significantly better tissue recovery was observed for any acute phase tissue signature and ADC category, except for the group with rt-PA treatment, tissue signature >4, and rADC greater than or equal to the median (24% vs. 75%, odds ratio [95% confidence limit] 5.50 [0.87, 34.55], P = .07). Similar effects were observed when the rADC was replaced by the absolute ADC value in the model (Table 3).
Effects of Tissue Signature Value, Apparent Diffusion Coefficient Value, and Recombinant Tissue Plasminogen Activator Treatment on Outcome of ≥20% Recovery of Ischemic Lesion at 3 Months: Demonstration of Three-Way Interaction among These Individual Factors Regarding Eventual Recovery in Comparison with the Reference Groups
Subgroup analysis was conducted, including tissue signature value, ADC value, and the combination of tissue signature and ADC values in the group that received no thrombolytic treatment before the MR imaging study. The results are presented in Table 4. Considering the MLTR (signature ≤4 and rADC greater than or equal to the median) as the reference group, tissues with acute phase ADC less than the median and tissue signature >4 were less likely to recover (31% and 13% for tissue signatures 5 and 6, respectively, vs. 80% in the most likely tissue recovery, odds ratio [95% confidence limit] 0.12 [0.05, 0.30] and 0.04 [0.01, 0.18] for tissue signatures 5 and 6, respectively, with rADC less than the median compared with the MLTR group). Compared with the LLTR group (tissue signature = 6, and rADC less than the median), tissues with signature ≤4 showed significantly more recovery, regardless of the status of rADC. On the other hand, considering that the cutoff for ADC is the first quartile (25% quartile), no difference, regarding tissue recovery was detected within the same tissue signature level with ADC <15% quartile. However, tissues with acute phase tissue signature 5 or 6 were less likely to recover compared with MLTR group with ADC ≥25% quartile.
Subgroup Analysis for Untreated Patients Only, Indicating the Effects of Tissue Signature Value, Apparent Diffusion Coefficient Value, and Recombinant Tissue Plasminogen Activator Treatment on Tissue Outcome, in Comparison with the Most Likely to Recover and Least Likely to Recover Reference Groups
Discussion
We studied 48 patients who had suffered stroke and who underwent multiparametric MR imaging studies at the acute and outcome (3-month) time points. We developed multiparameter composite MR images that allowed segmentation of the acute ischemic lesion, and we followed the evolution of the acute ischemic lesions into the outcome phase of infarction to define the tissue signatures and other characteristics of the ischemic tissue that would be compatible with eventual tissue recovery. Three factors emerged as significant in this analysis, the ADC value of the acute ischemic lesion, the ISODATA tissue signature number, and the preceding treatment (or absence of treatment) with IV rt-PA, with a three-way interaction among them.
In this three-way interaction among the tissue signature number, the ADC level and the preceding treatment (or absence of treatment) with rt-PA regarding tissue recovery, the probability for ischemic tissue to recover was improved when the tissue signature number was lower and the ADC decline less severe. This probability was influenced in a positive direction in cases in which there had been previous treatment with IV rt-PA. The multiparametric ISODATA analysis detected several regions within the acute ischemic lesion (tissue signatures 2–7) that had different MR imaging characteristics. The analysis conducted of tissue recovery, based on the tissue signature number, indicated that the lower the signature number was, the higher was the chance for tissue recovery. The addition of the tissue signature number to the multivariable model increased the predictive ability, R2N, to 26% (from R2N 15% in a model without signature number). Therefore, the ISODATA method is capable of segmenting the ischemic lesion into heterogeneous regions and grading the degree of ischemic injury, with the lower tissue signature numbers indicating less severe tissue damage. Our present work is in accord with previous observations in a middle cerebral artery occlusion experimental stroke model by our group (13); the ISODATA tissue signatures were highly correlated with the histologic degree of ischemic injury.
The ADC value (whether absolute or relative) also predicted the outcome of the ischemic tissue. The lower the value of the acute phase ADC was, the less likely the tissue recovery was. Tissues with acute phase rADC value ≤0.66 (first quartile) or 0.66 through 0.78 (second quartile) were less likely to revert to normal in the follow-up studies, compared with rADC values in the fourth quartile (>0.91) (odds ratio [95% confidence limit] = 0.38 [0.17, 0.87], P = .02, between the first and fourth quartiles; odds ratio [95% confidence limit] = 0.34 [0.14, 079], P = .01, between the second and fourth quartiles). The predictive ability in the multivariable model with the rADC was high (>20%). This finding indicates that the depth of the ADC decrease in acute ischemia, within 5 to 24 hours from onset, correlates with it the severity of the ischemic injury and as such strongly predicts the ultimate fate of the ischemic tissue. Wittsack et al (29) reached similar conclusions by analyzing diffusion-weighted imaging studies and indicated that the signal intensity of diffusion-weighted imaging is predictive of evolution of ischemic tissue into infarction after the first 4 hours of onset of ischemia. In contrast, Fiehler et al (9) showed that ADC values within the currently accepted time window for thrombolysis (3 hours) do not predict the fate of the ischemic tissue.
The very strong interaction between preceding treatment with rt-PA and the tissue signature number, and the ADC level regarding recovery of ischemic tissue was not unexpected and has two potential explanations. The first is that ISODATA correctly graded the degree of tissue injury and rt-PA influenced the evolution of the ischemic process, so that even more severely damaged tissue could recover because of timely reperfusion. The second potential explanation would be simply related to the reperfusion effect of rt-PA and the multiparametric images per se. The ISODATA composite images have a very significant contribution from T2-weighted imaging, which produces its contrast as a result of increased total water content. Once rt-PA is expected to produce reperfusion, which consequently will lead to increase of the tissue total water content, the tissue signatures that have a higher T2 intensity will be graded with higher numbers. In this sense, the higher signature number in the rt-PA-treated patient may not necessarily be a reflection of more severe ischemic damage, but rather an indication of more adequate reperfusion. As a result, the ISODATA approach may be useful in assessing the adequacy of reperfusion in rt-PA-treated patients. This, however, still needs to be proved in a group of patients with combined ISODATA, perfusion-weighted imaging, and MR angiography studies.
Additionally, of notable interest are the findings from the most likely tissue recovery group of patients who received no thrombolytic treatment before the MR imaging study (Table 4). This group (signature ≤4 and rADC greater than or equal to median) exhibited significantly more tissue recovery compared with groups of tissues with acute phase ADC less than the median and tissue signature >4 were less likely to recover. Also, compared with the least likely tissue recovery (tissue signature = 6 and rADC less than median), tissues with signature ≤4 showed significantly more recovery, regardless of the status of rADC (Table 4). This analysis provides more evidence that segmenting the ischemic lesion with ISODATA allows clear distinction of viable tissue with high probability for recovery from nonviable tissue with very low probability for recovery, irrespective of other MR imaging parameters. Ischemic tissue with the characteristics of most likely tissue recovery can be a potential target for either thrombolytic or neuroprotective therapies with an extended therapeutic time window, as it represents viable tissue with high probability for recovery.
Our study has a number of potential limitations. First, the MR imaging studies were performed during a rather wide time interval (5–24 hours), which, however, does reflect the clinical reality of stroke care. The ADC value in acute ischemia is time dependent, and the results of the early part of this time window may therefore differ from the results of the later part. Second, no patient was studied within 3 hours of onset (the currently relevant time window for thrombolysis) and therefore no comment can be made regarding the hyperacute phase of stroke and the significance of the ADC value and tissue signature numbers during that phase. However, considering that currently only approximately 4–21% of all patients with ischemic stroke receive or are candidates to receive treatment with IV rt-PA within 3 hours of symptom onset (30–32), our approach to studying patients with acute stroke and the ability of the model to predict tissue viability could constitute a very valuable guide for the design of acute stroke treatment trials with an extended therapeutic window. Third, tissue recovery was calculated with reference to pan-necrotic tissue, as reflected by the lesion shown on 3-month T2-weighted images. Tissue that was partially damaged may have been present, and that may not have been reflected in our study. Partial volume effects may have affected the present analysis, as MR imaging sections from acute and chronic time points may not match exactly for co-registration. Despite these potential limitations, however, we have clearly shown that our approach is capable of defining the fate of the acutely ischemic brain tissue with a high degree of accuracy, and that this approach could be a valuable guide in the design of acute stroke treatment trials.
The concept of multiparametric MR imaging in cases of acute stroke is appealing, mainly because of the potential promise that it would allow prediction of tissue viability at a variety of time points after stroke onset or in a time-independent, tissue status-dependent, manner. Several groups of investigators have designed a variety of basic sets of multiparametric MR imaging studies for the assessment of tissue viability (33, 34), such as the perfusion-weighted imaging−diffusion-weighted imaging mismatch (34) model that has recently been assessed in the context of thrombolysis beyond the 3-hour window (35). The potential problem with the mismatch concept is that some of the perfusion-weighted imaging lesion volume may reflect tissue that is oligemic but at no risk for infarction. We think our approach is more valid in assessing the potential for tissue recovery, as it addresses the changes that occur at the cellular level as a consequence of significant or critical hypoperfusion. However, the selection of the optimal basis set of MR imaging studies remains to be defined.
Currently, most patients with acute stroke cannot enjoy the therapeutic benefit of thrombolysis, and perhaps the benefits of other potential acute phase treatments, because of delays in symptom identification or presentation to appropriate medical facilities. Our approach to studying patients with acute stroke and the ability of the model to predict tissue viability could constitute a very valuable guide for the design of acute stroke treatment trials with an extended therapeutic window. We expect to test this model in an acute stroke intervention trial to determine its ability to predict tissue viability and recovery before initiation of treatment.
Conclusion
We developed a multiparametric MR imaging approach to acute cerebral ischemia. We used the segmentation algorithm ISODATA, which segmented the acute ischemic lesion into several clusters, each having a unique set of MR characteristics (tissue signatures), indicating that the ischemic lesion is inhomogeneous. We developed a model for prediction of potential for tissue recovery in the acute phase of stroke, and we defined that the ADC level, the tissue signature value, and the preceding treatment with rt-PA, with a three-way interaction among them, are the factors strongly predicting the ultimate fate of the ischemic tissue.
References
- Received October 24, 2003.
- Accepted after revision January 27, 2004.
- Copyright © American Society of Neuroradiology


