
Abstract
BACKGROUND AND PURPOSE: Physiologic age-related T2* and T2′ values are required as reference for comparison with disease-related deviations. In our study, T2* and T2′ values (T2 values as control) were determined with MR imaging in healthy subjects to determine standard values and investigate age-related changes.
MATERIALS AND METHODS: Data of 50 patients without intraparenchymal pathology and 10 acute stroke patients who underwent MR imaging including a T2 and T2* sequence with 3 echotimes were included. After calculation of T2*, T2′, and T2 maps, the values of gray matter (GM) and white matter (WM) for each hemisphere were measured in 6 distinct regions of interest (ROIs).
RESULTS: There was a negative correlation between age and T2* values in the caudate nucleus (r = −0.34 Pearson correlation; P = .001) and lentiform nucleus (r = −0.67; P = .001) and a positive correlation in the occipital (r = 0.41; P = .001) and subcortical (r = 0.45; P = .001) WM. An age dependency for T2′ values was only found for the caudate (r = −0.35; P = .001) and lentiform nucleus (r = −0.69; P = .001). T2′ values in acute stroke were lower than normal in all patients with stroke.
CONCLUSION: Decrease in T2′ and T2* values in GM and increase of T2* values in WM correlate with the progress of brain aging. Explanations for decreasing T2′ and T2* values include iron deposition in the caudate and lentiform nucleus. In contrast to T2* values, there is no association of T2′ values with the degree of leukoaraiosis. These age-dependent values can be used as a reference in neurovascular diseases and for the discussion of functional MR imaging data.
The possibility of measurements of T2* and T2′ values is of considerable interest for the application of MR imaging in the evaluation of cerebral disease. The use of quantitative techniques potentially increases the diagnostic sensitivity and specificity in the characterization of brain tissue pathologic processes. T2* and T2′ values represent intrinsic parameters of tissue that determine MR imaging signal intensity. These values are sensitive to changes in chemical composition and metabolic modifications that accompany cerebral pathologic processes. T2′ is equal to T2* corrected for spin-spin effects and therefore better isolates the influences of deoxyhemoglobin on T2* values according to the formula 1/T2′ = 1/T2*−1/T2.1,2
Quantitative MR values have been used in several studies for different conditions. Measurement of T2 values is used in the diagnosis of leukoencephalopathy or developmental anomalies of gray (GM) and white matter (WM) in children.3 It has been known for a long time that age-dependent changes in brain structure and metabolism are associated with changes of relaxation values.4 Measurement of T2* and T2′ values has been used for determination of iron tissue concentration,5 and calculation of T2′ values has already been used in MR imaging in acute stroke to investigate the oxygen extraction fraction (OEF) in acute ischemic stroke2,6 and chronic misery perfusion.7,8 However, normal reference T2′ values have not been reported so far, and the determination of T2′ reference values is mandatory for future applications in ischemic disease. In our study, T2* and T2′ values (and T2 values as control) were determined with MR imaging in distinct regions of interest (ROIs) in the WM and in the basal ganglia in subjects without intraparenchymal pathologic processes to determine age-related normal values. To prove applicability of the obtained T2′ normal values, in addition, T2′ values were measured in 10 patients with acute stroke.
Patients and Methods
Fifty patients were retrospectively selected from a pool of 220 consecutive patients who underwent routine MR imaging examination, including a T2 and T2* sequence with 3 different echotimes (TE) and calculation of corresponding T2′ maps in our department between August 2006 and January 2007. Informed consent on the use of their data for study purposes was obtained from all persons included. Only subjects without intraparenchymal pathologic processes as determined independently by 2 experienced neuroradiologists were included. Leukoaraiosis was considered a regular aging process and was graded corresponding to the Fazekas score.9 Patients with any other brain lesions (eg, brain tumors or other structural defects) were excluded.
MR Imaging Protocol and T2 Maps
All MR imaging scans were conducted on a 1.5T MR system (Magnetom Sonata; Siemens, Erlangen, Germany). The MR protocol included a T2 and T2* sequence. For T2 determination, a fast spin-echo sequence with 15 echoes per shot was used to acquire images at 3 different TE of 12, 84, and 156 ms within a total acquisition time of 74 s (number of sections, 24; section thickness, 5 mm; section spacing, 0 mm; FOV, 240 mm; matrix, 74 × 128; TR, 4550 ms; and refocusing flip angle, 150°). T2*-weighted images were obtained with a single-shot echo-planar imaging sequence at a TE of 20, 52, and 88 ms and a TR of 3240 ms, giving a total acquisition time of 19 s (flip angle, 90°; other parameter as for T2).
Calculation of qT2*, qT2′ and qT2 Images
Quantitative T2 (qT2), qT2*, and qT2′ maps were obtained on-the-fly on the MR system with an extended image reconstruction algorithm custom made by the manufacturer's image calculation environment (ICE). T2* and T2 maps were calculated by separately fitting a single exponential term to the signal intensity decay curve given by SI(t)=SI0 e−t/T2 for the signal intensities of the multiple TE data (SI(t)) of the T2 and T2* sequences. T2′ is equivalent to T2* corrected for spin–spin (T2) effects according to the relationship: 1/T2′ = 1/T2*−1/T2.1 For each voxel, the quantitative T2 and T2* values were used to generate T2′ values by applying this relationship.2 Voxel sizes of the obtained parameter maps were 3.2 × 1.9 × 5 mm3.
Regions-of-Interest Analysis
T2′, T2*, and T2 values of GM and WM were measured in 12 distinctive ROIs on each of the created qT2′, qT2*, and qT2 maps with medical image processing, analysis, and visualization (MIPAV) software (Center for Information Technology, National Institutes of Health, Bethesda, Md).
For definition of ROIs, T2-weighted images (third echo of triple-echo T2 sequence) were used. Predefined ROIs were then transferred to corresponding qT2′, qT2*, and qT2 images.
T2*, T2′, and T2 values of deep GM and WM for each hemisphere were measured in 6 ROIs chosen in different brain regions: frontal WM (frontalWM), occipitoparietal WM (opWM), subcortical WM (sWM), caudate nucleus (caudGM), thalamus (thalGM), and lentiform nucleus (lentGM) (Fig 1). For definition of the first 2 GM ROIs, the same transaxial section was used. The third ROI was located in the axial section showing the largest extent of the transaxial sectioned lentiform nucleus. The ROIs were chosen carefully to minimize partial volume effects. All ROIs were the same shape and comprised an area of 21 mm2, except for the ROI at the caudate nucleus, which was chosen with an area of 12 mm2. These 2 types of ROIs were predefined manually and then transferred for each patient intraindividually to each parameter map. No ROIs were chosen in cortical GM because of substantial partial volume effects contributed by CSF. We conducted all numeric calculations for ROI analysis using the MIPAV software. Statistical analysis was performed with SPSS 13.0 (correlation between grade of leukoaraiosis and T2, T2*, and T2′ WM values [Spearman rho]; calculation of Pearson correlation coefficients and corresponding P values for each ROI localization and the age dependence of T2*, T2′, and T2 values; and Mann-Whitney U test for comparison of T2′ values measured in patients with acute stroke with normal reference value).

Definition of 6 ROIs on T2-weighted images chosen in different brain regions: frontal WM (frontalWM), occipitoparietal WM (opWM), subcortical WM (sWM), caudate nucleus (caudGM), thalamus (thalGM), and lentiform nucleus (lentGM).
Measurement of T2′ Values in Acute Stroke Lesions
For proof of principle, T2′ values were measured within the hypoperfused brain tissue in 10 patients with acute stroke. Inclusion criteria were MR imaging examination within 6 hours after the onset of symptoms; acute ischemic stroke in the territory of the middle cerebral artery; and visible, hypointense lesion on T2′ maps in WM of the affected hemisphere. Hypoperfused tissue was delineated in time-to-peak perfusion maps as the region with perfusion delay apparent for the observer by visual inspection. Mean T2′ values were obtained for each patient.
Results
The mean age of the patients was 54 ± 20 years (mean ± SD) ranging from 12 to 91 years (30 male and 20 female). Age distribution for the entire collective was found as illustrated in Fig 2.

Age distribution of the healthy subjects.
T2′, T2*, and T2 values were determined for all 50 patients within 6 ROIs for each hemisphere. Mean absolute values and SD for T2*, T2′, and T2 values are listed in Table 1.
Mean (MW) and SD for T2*, T2′, and T2 values
Mean T2, T2*, and T2′ values for WM corresponding to different grades of leukoaraiosis are displayed in Table 2. A significant correlation was observed between the grade of leukoaraiosis and T2 WM values (Spearman rho ρ = 0.293; P < .001 [2-tailed]) and also with T2* WM values (Spearman rho ρ = 0.215; P < .001 [2-tailed]). No significant correlation was found for T2′ values measured in WM ROIs.
Mean (MW) and SD for T2*, T2, and T2′ values for WM corresponding to different grades of leukoaraiosis (0–6)
Correlation coefficients and corresponding P values for each ROI localization and the age dependence of T2*, T2′, and T2 values are displayed in Table 3.
Pearson correlation coefficients and corresponding P values for each ROI localization and the age dependence of T2*, T2′, and T2 values
In addition, age-related changes in T2*, T2′, and T2 values were determined for male (n = 30; mean age, 54 years; minimum, 15 years; maximum, 78 years) and female (n = 20; mean age, 54 years; minimum, 12 years; maximum, 91 years) patients separately. Even stronger correlation coefficients were observed compared with analysis of the entire patient collective when data of the female patient group were separately analyzed. In addition, there was a significant positive correlation between age and T2′ values in the occipital WM (r = 0.42; P ≤ .001) and a significant negative correlation between age and T2 in the caudate nucleus (r = −0.37; P ≤ .001) for the female group. In contrast to the results for the entire patient collective, the male patient group did not show significant (P ≤ .001) correlation between age and values determined in the caudate nucleus on T2* and T2′ maps as well as in occipital WM on T2* images. There was no significant sex- or side-dependent difference in absolute values of T2, T2*, or T2′.
Measurement of T2′ Values in Patients With Acute Stroke
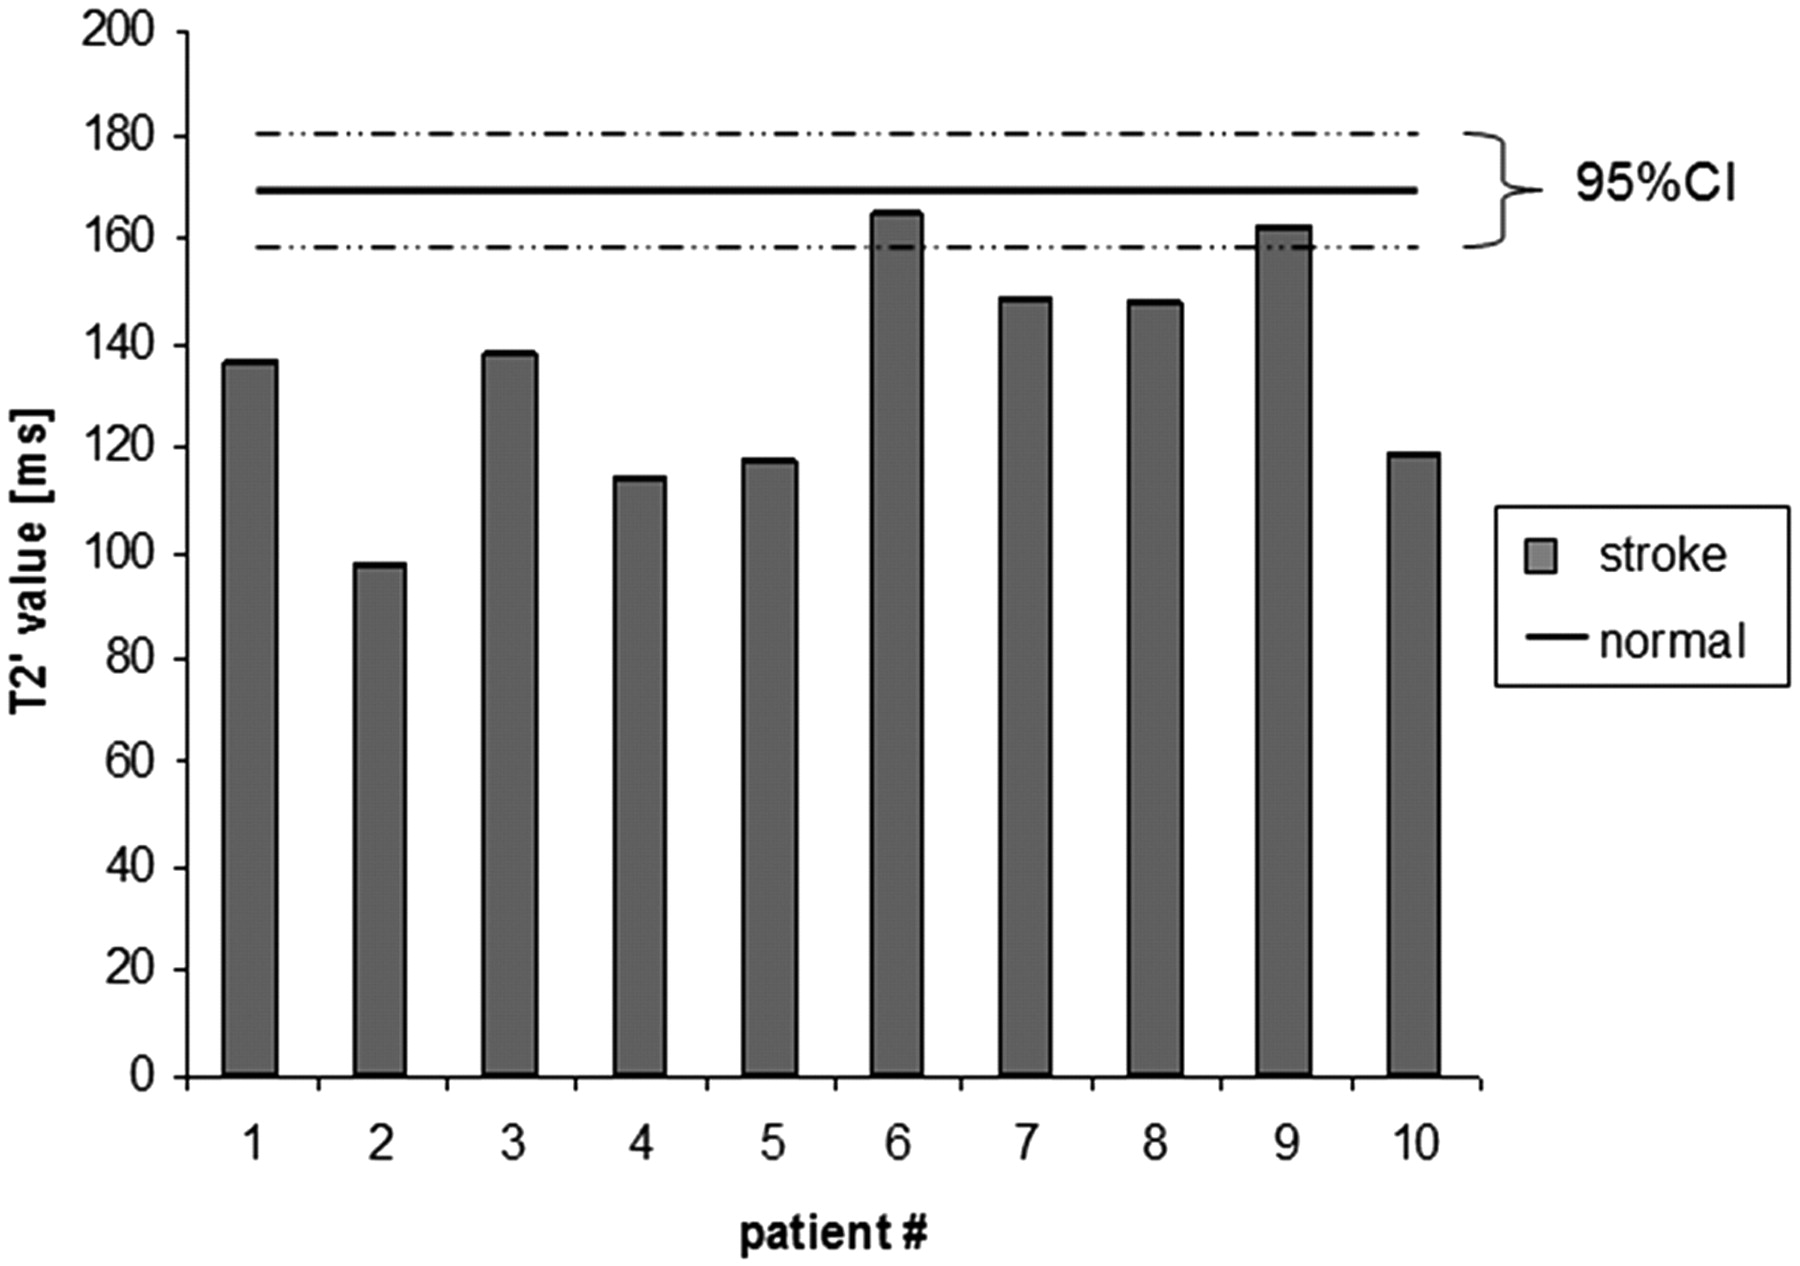
Mean T2′ values measured in ROIs defined in hypointense lesions in the infarcted hemisphere compared with the above obtained T2′ normal value for WM of 170.47 ms (95% confidence interval, 159.24–181.70 ms) are displayed in Fig 3. All T2′ values measured in patients with acute stroke inside the visible hypointense T2′ lesion were lower than the obtained normal reference value for WM in healthy control subjects (P < .001).

T2′ values measured in acute stroke lesion (stroke) compared with normal reference values in healthy subjects (normal).
Discussion
Quantitative MR techniques have been shown to be sensitive to microstructural and metabolic changes.3,10 The use of quantitative MR imaging parameters such as T2*, T2′, and T2 values, each contributing to different tissue characteristics, is essential to detect alterations in signal intensity resulting from tissue abnormalities. Reference values of healthy control subjects with respect to age are essential to interpret the observed values in pathologic conditions. Therefore, we sought to investigate T2* and T2′ values in healthy control subjects and their age-related changes. Absolute T2 values and their age-related changes have been investigated by several studies.3,11-13 In our study, T2 values were determined as controls in addition to the primary target variables T2* and T2′ parameters. The mean T2 value of 170 ms for WM in our study agrees with a study reporting a T2 value of 96 ms in WM obtained in the temporal lobe of adults,14 and another study, describing a T2 value of 95 ms for frontoparietal WM.15 Other studies11 have found a significant effect of age on T2 values in WM and also a positive effect on T2 values in the thalamus with aging. T2′ values were independent from pre-existing leukoaraiosis.
Obtaining normal values for T2′ as a reference is equally essential because T2′ maps have already been used in several studies to measure the OEF as a parameter of brain metabolism, especially in vascular pathologic processes such as arterial stenosis and stroke.6,16 Positron-emission tomography (PET) is usually needed to measure the OEF.17 In contrast, T2′ maps are more easily applicable in clinical routine and can easily be incorporated into an protocol for acute stroke. Normal reference values are needed to allow further evaluation of pathologic variation in brain tissue. To our knowledge, there are no studies reporting on normal T2′ values as a reference so far. In our study, mean T2′ values in WM were 170 (± 99 SD) and 109.92 (± 44.91 SD) in GM. These values show a high SD and variance compared with T2* and T2 values (Table 1). This shortcoming is easily understood when considering the formula 1/T2*−1/T2 = 1/T2′,2 implying that small changes in T2 or T2* values show, in contrast, a large effect on T2′ values. The acquisition of the T2′ sequence still needs improvement, but in the setting of acute stroke, time limitations prohibit achieving a better signal-to-noise ratio at the cost of acquisition time.
Moreover, the results have implications with regard to functional MR imaging studies because blood oxygen level-dependent (BOLD) optimization in signal intensity is achieved when TEs are set equal to the T2* values of the tissue of interest. The magnitude of the BOLD change in signal intensity on brain functional MR imaging is dependent on intrinsic tissue properties such as transverse relaxation time (T2*) and extrinsic parameters such as TE and magnetic field strength.18 In addition, abnormalities shown with these techniques may correspond to increasing calcification in areas of the extrapyramidal system or, in cases of T2′ images, to a variation in the deoxyhemoglobin concentration as an indicator of the OEF in brain parenchyma. Changes in signal intensity on T2* weighted BOLD MR imaging are dependent on changes in the local concentration of deoxyhemoglobin.19 A hypointense lesion on BOLD imaging corresponding to a decrease of T2* indicates an increased local deoxyhemoglobin concentration. Thus, T2* changes reflect an alteration in oxygen availability and might be related to age.2,20 The BOLD effect is superimposed on the underlying T2 processes in determining T2*. Therefore, separation of these 2 contributions better isolates the influences of deoxyhemoglobin on T2*. The T2′ image more clearly displays susceptibility related influences of deoxyhemoglobin on T2*.
To demonstrate applicability of the obtained T2′ normal values, in addition, T2′ values were measured in 10 patients with acute stroke. PET studies reported an increase of the OEF in ischemic brain tissue. Similar to hyperacute ischemic lesions in CT, the regions with abnormalities on T2′ BOLD imaging are clearly visible to the human eye, and a measurable loss of T2′ signal intensity in the infarcted hemisphere compared with the unaffected hemisphere has been reported.6 Our observations are in line with these reports. The T2′ values for all 10 patients with acute stroke were significantly lower (P < .001) than the T2′ normal value of 170 ms.
Age-related changes in brain anatomy during human development represent one of the most challenging and important topics of research in neuroscience. During infancy and adolescence, developmental changes occur in GM and WM microstructure and organization of the brain.21,22 MR imaging has mainly contributed to the understanding of age-related brain changes, providing a noninvasive tool to study the normal aging process in vivo at multiple time points23-26 because it is highly sensitive for detecting abnormalities of signal intensity in brain parenchyma leading to increased recognition of alterations in signal intensity of the WM. Most of these WM lesions generally appear as hyperintense on T2-weighted images. Various studies describe a relationship between these hyperintensities and increasing age.27-30 In this context, it has been shown that T2 parameters do not provide sufficient information about the underlying microstructural modifications of brain tissue occurring with aging because they are affected by several factors such as tissue attenuation and tissue water content as well as by iron content in the tissue.5,31
Having obtained the individual T2*, T2′, and T2 values for all subjects, we studied the age dependence of T2*, T2′, and T2 values. The accumulation of paramagnetic metals such as iron could be a main reason for the reduction of the T2*, T2′, and T2 values in deeper GM32 as it was also observed in our study. The normal aging changes of the brain include enlargement of the sulci and ventricles, and focal changes in WM.22,33,34 Our results suggest an overall tendency for increase in T2*, T2, and T2′ during the aging process. In particular, dynamic degenerative changes of the microstructure in brain parenchyma because of leukoaraiosis might contribute mainly to the detected increase of T2* and T2, especially in the WM. However, there was no association of T2′ values with leukoaraiosis in our patients. Histopathologic studies have revealed that WM hyperintensities are associated with areas of tissue destruction in demyelination and axonal changes such as a reduction of the total length of myelinated fibers and also fiber loss, and that these reported changes are detectable with quantitative MR imaging techniques.35-37 The increase in T2* and T2 values with age could represent diffuse structural changes in neurons or myelin or a decrease in the cellularity of the brain with aging. In the alternative sense, the reported increase in measured values may reflect small focal abnormalities not visualized with MR imaging, such as senile plaques, amyloid deposits, small infarcts, or Virchow-Robin spaces.33
Basal ganglia represent an area especially susceptible to pathophysiologic processes associated with deposition of iron resulting in changes in signal intensity on MR imaging of the individual brain with older age.38,39 MR imaging sequences such as T2* and T2′ are highly sensitive to ferritin iron within brain tissue. In clinical practice, increased iron deposits may be visible by darkening of the basal ganglia on qT2*, qT2′, and qT2 maps.37 Visualizing normal iron deposition as detected with MR imaging might be helpful in the diagnosis of known iron-deposition diseases and also in the detection of iron-related pathologic changes. Because the increase in iron in the brain is age related, the role of iron in age-related neurodegenerative disorders still needs investigation.31,39 Age-related changes in signal intensity from the pallidum or thalamus, possibly attributable to the deposition of iron, have been reported.22 Rivkin et al40 measured T2* values in brain tissue of neonates and adults with a mean age of 38 years, which included the frontal and parietooccipital areas in the WM as well as the thalamus. For the adult group, they reported mean T2* values ranging from 62 to 69 ms and a brain average of T2* values of 66 ± 5 ms. The T2* values we obtained in corresponding ROIs are in line with these measurements and are also consistent with those reported by Speck et al.8
In theory, the more echoes, and thus more points, for calculation of the signal intensity decay curve would be beneficial for the derivation of T2 and T2* values and, consecutively, of T2′ values than from triple-echo sequences. In clinical routine, though, multi-echo MR images with more echoes also require a longer TR. This leads to a longer MR acquisition time and higher sensitivity to artifacts from patient movement, which is most relevant in patients with acute stroke. Another reason for deviations of measured values compared with other studies might be that ferritin has been observed to exert a strong magnetic effect that results in marked T2 shortening,41-43 and tissue T2 parameters have been shown to be field dependent.44,45 Ferritin itself shortens T2 more in high-field than in low-field instruments.31,46 Hence, cerebral T2 values decrease with increasing field strength,5 and several qT2 reference values were obtained by low-field systems.3,12,47
Most of the patients included in our study presented with a variety of neurologic symptoms because only patients with an indication for MR imaging examination were scanned. None of the subjects included in our study showed pathologic changes in brain tissue. Because information concerning demographic factors such as race, lifestyle factors such as alcohol and coffee consumption, and medical history factors such as surgery and drug use was not available, we are not able to determine whether these might contribute to our results.
Conclusions
Decrease in T2′ and T2* relaxation time values in GM and increase of T2* and T2 in WM correlate with the progress of the aging brain. We hypothesize that decreasing T2′ and T2* values result from iron deposition in the caudate and lentiform nucleus, whereas the increase in WM may be related to an increased OEF. In contrast to T2* values, there is no association of T2′ values with the degree of leukoaraiosis. These age-dependent values can be used as a reference in neurovascular diseases and for the discussion of functional MR imaging data.
Footnotes
This study was supported by the European Union (Proposal/Contract 027294-I-Know-STREP).
References
- Received October 9, 2007.
- Accepted after revision November 22, 2007.
- Copyright © American Society of Neuroradiology
In this issue


Jump to section
Related Articles
Cited By...
- Magnetic Resonance Fingerprinting with Combined Gradient- and Spin-echo Echo-planar Imaging: Simultaneous Estimation of T1, T2 and T2* with integrated-B1 Correction
- Detection of Normal Aging Effects on Human Brain Metabolite Concentrations and Microstructure with Whole-Brain MR Spectroscopic Imaging and Quantitative MR Imaging
- Quantitative T2'-Mapping in Acute Ischemic Stroke
- Age-Related Changes of Cerebral Autoregulation: New Insights with Quantitative T2'-Mapping and Pulsed Arterial Spin-Labeling MR Imaging
- T2' Imaging Within Perfusion-Restricted Tissue in High-Grade Occlusive Carotid Disease