
Abstract
BACKGROUND AND PURPOSE: The quantification and clinical significance of WD in CSTs following supratentorial stroke are not well understood. We evaluated the anisotropy by using DTI and signal-intensity changes on conventional MR imaging in the CST to determine whether these findings are correlated with limb motor deficit in patients with MCA ischemic stroke.
MATERIALS AND METHODS: We studied 60 patients within 12 hours of stroke onset. At admission, day 3, and day 30 of evolution, patients underwent multimodal MR imaging, including DTI sequences. We assessed the severity of limb weakness by using the motor subindex scores (5a, 5b, 6a, 6b) of the m-NIHSS and established 3 groups: I (m-NIHSS scores of 0), II (m-NIHSS, 1–4), and III (m-NIHSS, 5–8). FA values and rFAs were measured on the affected and the unaffected CSTs in the pons.
RESULTS: FA values for the CST were significantly lower on the affected side compared with the unaffected side only at day 30 (P < .001), and the rFA was significantly correlated with the motor deficit at day 30 (P < .001; r = −0.793). The sensitivity, specificity, and positive and negative predictive values for motor deficit by rFA < 0.925 were 95.2%, 94.9%, 90.9%, and 97.4%, respectively.
CONCLUSIONS: WD in the CST revealed by DTI correlates with motor deficit 30 days after MCA ischemic stroke. This study highlights the utility of imaging follow-up at 30 days and the potential of DTI as a surrogate marker in clinical trials.
Abbreviations
- ANOVA
- one-way analysis of variance
- CST
- corticospinal tract
- DTI
- diffusion tensor imaging
- DWI
- diffusion-weighted imaging
- EPI
- echo-planar imaging
- FA
- fractional anisotropy
- FLAIR
- fluid-attenuated inversion recovery
- ICC
- intraclass correlation coefficient
- IQ
- interquartile
- MCA
- middle cerebral artery
- NIHSS
- National Institutes of Health Stroke Scale
- m-NIHSS
- motor subindex scores of the NIHSS
- PWI
- perfusion-weighted imaging
- rFA
- FA ratio
- ROC
- receiver operating characteristic
- rtPA
- recombinant tissue plasminogen activator
- SENSE
- sensitivity-encoding
- WD
- wallerian degeneration
Motor deficit is one of the most common sequelae of ischemic stroke, and its severity correlates with functional disability and reduced quality of life.1 The CST is the most important motor pathway.2 The extent of WD in the CST is one of the major determinants of motor deficit.3 WD consists of the anterograde degeneration of axons and their myelin sheaths after proximal axonal or cell body injury from numerous causes, including stroke, and has been demonstrated through experiments, postmortem studies, transcranial magnetic stimulation, and conventional imaging.4–8 Many studies have reported hyperintense signals regarded as WD along the affected CST on T2-weighted or diffusion-weighted imaging weeks or months after stroke, and this finding correlates well with persistent functional disability.9–12 However, on conventional MR imaging, these findings are usually subtle and can be difficult to detect in the first few weeks; moreover, the extent of WD is difficult to quantify on conventional MR imaging and is not consistent in all patients with motor deficit.
Recently, much interest has focused on the potential of DTI for in vivo quantification of microstructural damage to cerebral white matter following stroke. DTI provides information on the predominant direction and degree of tissue water diffusion.13,14 In the white matter, water diffuses quickly lengthwise along the fibers and slowly perpendicular to fibers, resulting in anisotropic diffusion.15 The degree of anisotropy depends on the level of organization and integrity of the white matter tract and on the degree of freedom of water diffusion movements by oriented axonal membranes and myelin sheaths.16 Reduced anisotropy along the CST remote from a cerebral infarct has been interpreted as WD, even when these areas appeared normal on conventional MR imaging.17,18 Cross-sectional studies found that lower FA values in the affected CST were associated with greater motor deficit 1–2 weeks after stroke onset and a worse motor recovery at 3 months.19–25 However, the few studies of WD of the CST determined by DTI after supratentorial stroke were performed in small heterogeneous samples months to years after stroke onset. To our knowledge, no prospective controlled studies have assessed WD in the CST immediately following MCA ischemic stroke. Therefore, we investigated the value of FA as a potential biomarker of motor deficit in relation to well-established clinical scores after MCA territory ischemic stroke.
Materials and Methods
Patients
We studied 60 consecutive patients with acute MCA hemispheric infarction within 12 hours of symptom onset. We excluded patients with cerebral hemorrhage, significant preexisting nonischemic neurologic deficit, or a history of prior stroke. The study was approved by the local ethics committee. All patients or their relatives provided written informed consent.
Clinical Assessment
Patients underwent neurologic examination, including NIHSS score, by a certified neurologist at admission, day 3, and day 30 after stroke onset. On the basis of the m-NIHSS (5a, 5b, 6a, 6b), the severity of limb weakness was categorized into grade I (total m-NIHSS score of 0), grade II (m-NIHSS, 1–4), and grade III (m-NIHSS, 5–8). All m-NIHSS assessments were administered without knowledge of the MR imaging findings.
MR Imaging
All patients underwent MR imaging examination on a 1.5T Intera scanner (Philips Healthcare, Best, the Netherlands). The protocol included axial trace DWI, FLAIR, gradient-echo T2*-weighted, PWI, time-of-flight angiography, and DTI sequences. DTI data were acquired by using single-shot EPI sequences with the SENSE parallel-imaging scheme (acceleration factor 2) after contrast agent administration. DTI with SENSE helped reduce scanning time and minimize the susceptibility and distortion artifacts typically associated with EPI sequences. Diffusion-sensitized gradients were applied along 15 noncollinear directions with a b-value of 1000 s/mm2. Diffusion-weighted B0 images were also obtained. Other acquisition parameters were the following: TR/TE, 6795/72 ms; FOV, 23 × 23 cm; and matrix size, 112 × 112. Forty-five contiguous 3-mm axial sections covering the entire brain and brain stem were acquired parallel to the anteroposterior line. DTI scanning time was 3 minutes 10 seconds.
Data Processing
DTI data were transferred to an off-line workstation for postprocessing and visually checked for quality. Diffusion-encoded FA-weighted images were elaborated by using the calculation scheme proposed by Pajevic and Pierpaoli.26 Color FA maps were generated following the standard convention (red, left-right; green, anteroposterior; and blue, superior-inferior). Quantitative values of FA were obtained by manually placing regions of interest on the entire CST area at the level of the rostral pons on axial sections (left and right sides) on the basis of the T2-weighted image and anatomic knowledge, by using our image display software (DTIWeb, Version 2.0, http://trueta.udg.edu/DTI/index.html).27,28 FA values for each region of interest were obtained by averaging all voxels within the region of interest on the sides affected and unaffected by the infarct. In each patient, the FA of the CST was derived from the mean value of 3 contiguous sections. The ipsilateral-to-contralateral CST rFAs were calculated (rFA = FAaffected side / FAunaffected side). FA measurements were repeated by 1 rater (J.P.) on the first 30 patients on the affected and unaffected sides (a total of 180 measurements) on 2 separate occasions 1 month apart and were performed once by 2 raters (J.P., G.B.). The presented FA values are based on the average of the mean values obtained by the 2 raters. Statistical analysis (intrarater and interrater comparisons) was performed for the mean FA values. Unaffected CSTs at the level of the rostral pons were used as internal controls for the assessment of WD-related changes because no significant differences in anisotropic diffusion are found between tracts on the left and right sides in normal subjects.15,16 Signal-intensity abnormalities on the affected side of the CST were also determined on diffusion-weighted b=1000, T2-weighted, and FLAIR images. Finally, for infarct volumes, 2 raters (J.P., G.B.) manually outlined the areas of abnormal hyperintensity on each section of DWIs. Surfaces of areas of abnormal hyperintensity were summed and multiplied by section thickness (6 mm) and intersection gap (1 mm) to calculate infarct volumes. The results of the 2 raters were averaged.
Statistical Analysis
Data are presented as mean (± SD) values for each group. The statistical evaluation of the results was based on ANOVA with the Bonferroni correction. Levene and Bartlett tests were used to determine whether the samples had equal variances, and then ANOVA tests were applied to examine the relationship of the mean FA values on the affected side of the CST and of rFA with the clinical scores at admission, at day 3, and at day 30. To determine the association between mean FA, motor deficit at day 3 and at day 30, and signal-intensity change in affected CST, we used the ANOVA test. The Pearson rank correlation coefficient was calculated to compare the FA and rFA values with clinical scores and infarct volumes. To calculate the FA and rFA cutoff points to discriminate subjects with motor deficit at day 30 from those without, we used the ROC curves. For these tests, P < .05 was considered to indicate a statistically significant difference.
To compare first and second measurements of the observer number 1 (intraobserver reliability) and to compare the measurements of 2 independent observers (interobserver reliability), we used the ICC. The level of intra- and interobserver consistency was classified as fair (ICC = 0.5–0.7), good (0.7–0.9), or almost perfect (>0.90). All statistical evaluations were performed by using Minitab, Version 15.1.0.0 (Minitab, State College, Pennsylvania).
Results
Subjects
Sixty consecutive patients with nonlacunar MCA ischemic stroke (38 men, 22 women; mean age, 68 ± 13 years) were included in the study between May 2006 and December 2007. One patient missed the admission MR imaging study but completed the day 3 and day 30 studies. Two patients missed the day 3 imaging study. All patients underwent MR imaging and clinical assessment at day 30. Two patients had small slightly hyperintense areas in the periventricular white matter; none had previous strokes. The modified Rankin Scale score before the infarct was 0 in all patients.
Clinical and Neuroimaging Characteristics
Table 1 shows the mean clinical scores and anisotropic indexes at baseline, day 3, and day 30. At day 30, mean NIHSS and m-NIHSS scores had improved compared with baseline values. At day 30, 21 patients had some motor deficit (m-NIHSS-II or m-NIHSS-III categories) (Table 2) and all patients had started physiotherapy within 2 weeks after the stroke. Infarct volumes on DWI ranged from 0.72 to 164.04 mL, and there were significant differences between the mean infarct volumes at admission, day 3, and day 30 (P = .213). The MCA territories most frequently involved were the peripheral and/or striatocapsular territories. Thirty-one patients (51.67%) received intravenous rtPA. There were no significant differences in rtPA treatment at admission among the m-NIHSS groups at day 30. No significant differences were found among the mean FA values in the unaffected CST in the entire group of patients at admission, day 3, and day 30 (0.609, 0.598, and 0.591, respectively) (P = .531). The estimated interobserver consistency showed good agreement for FA measurements (ICC = 0.809). The estimated intraobserver consistency was also good (ICC = 0.881).
Summary of the demographics, diffusion tensor findings, and clinical scores
Motor scores, signal intensity on conventional MR imaging, and FA in the affected CST in patients with motor deficits at day 30
Correlations Between DTI, Conventional MR Imaging Findings, and Clinical Scores
The FA and rFA cutoff points that best discriminated the presence of motor deficit at day 30 were 0.556 and 0.925, respectively. The sensitivity, specificity, and positive and negative predictive values for motor deficit by FA < 0.556 were 76.2%, 76.9%, 64%, and 85.7%, respectively. For FA at the pons ipsilateral to the infarct at day 30, the area under the ROC curve was equal to 0.897 with an error of 0.043. The sensitivity, specificity, and positive and negative predictive values for motor deficit by rFA < 0.925 were 95.2%, 94.9%, 90.9%, and 97.4%, respectively. The area under the ROC curve was equal to 0.937 with an error of 0.037.
Mean FA values on the affected side of the CST were significantly different from those on the normal contralateral side only at day 30 (P < .001), and mean FA values on the affected side at 30 days were lower than those at admission and at day 3 (Table 1). Likewise, rFA values in patients with motor deficits (m-NHISS-II and m-NHISS-III) were lower only at 30 days (P <.001). In 20 of 21 patients with motor deficits at 30 days (95.2%), FA in the affected CST was below the mean value of the group of patients without motor deficit, and FA was lower on the affected side than on the unaffected side in the group of patients with motor deficits (Table 2). FA decreased 17% in the m-NIHSS-II and 32% in NIHSS-III groups, and the decrease in mean FA and rFA values correlated negatively with the degree of motor deficit at 30 days (Figs 1 and 2). However, there were no significant differences in mean FA and rFA values between patients with NIHSS-II and NIHSS-III at 30 days.
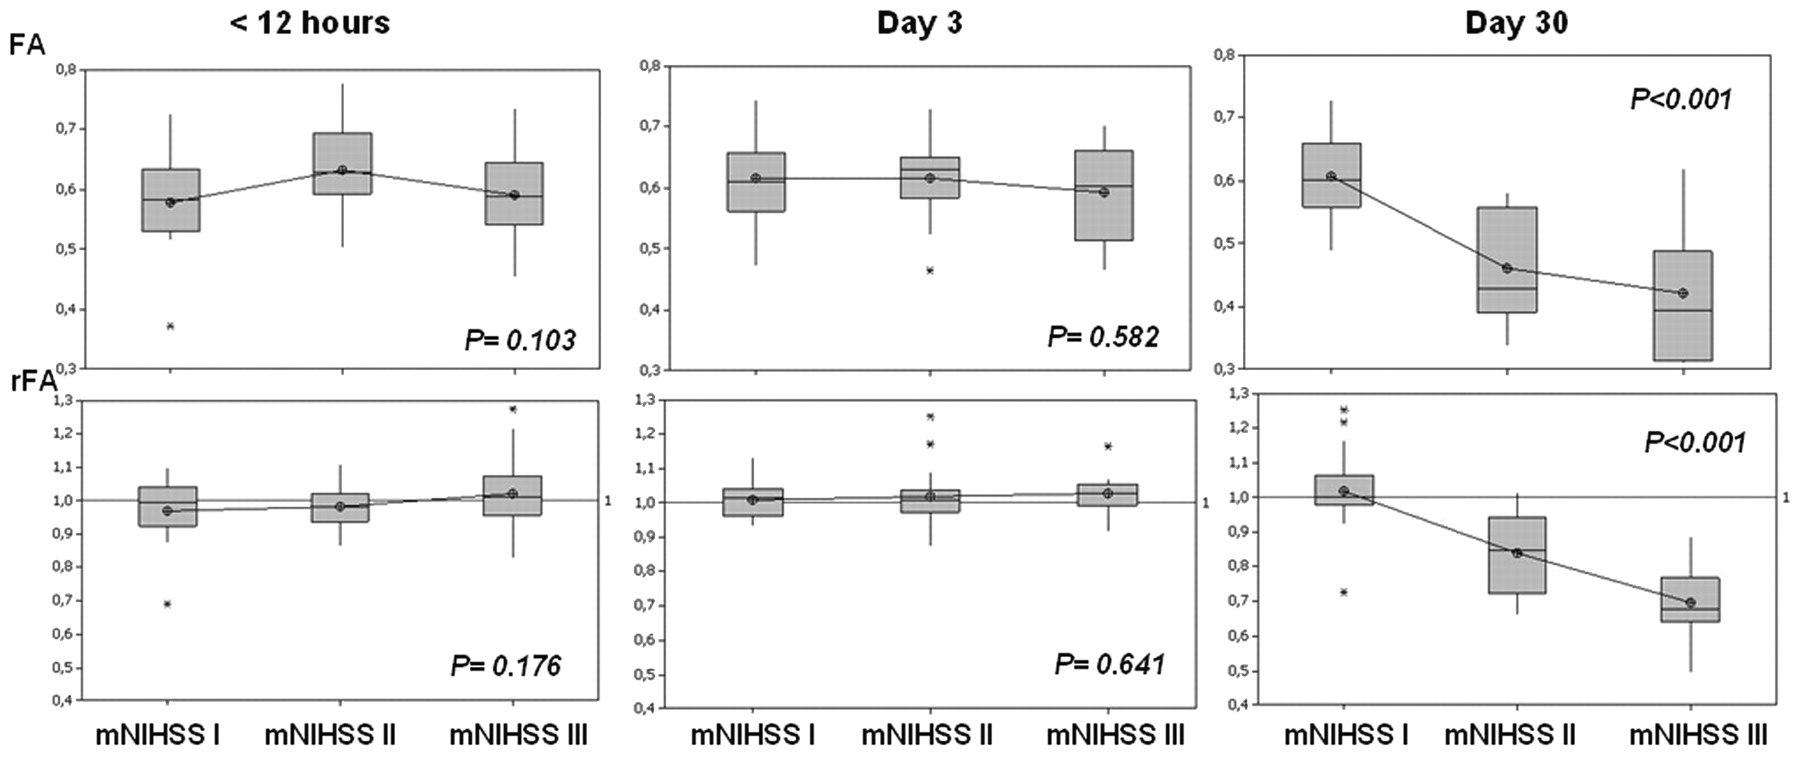
Evolution of mean FA values and rFAs between the affected and unaffected sides in the region of interest in the descending CST at the level of the rostral pons in the function of m-NIHSS categories at admission, day 3, and day 30. Boxplots show median values (horizontal line inside the box), quartiles (box boundaries), and the largest and smallest observed values (lines extending from the box) of FA and rFA. Anisotropy values are clearly lower in patients with motor deficits at 30 days; no differences were found between patients in the m-NIHSS-II and m-NHISS-III groups.

A 67-year-old man with acute right-sided striatocapsular infarction (upper left corner) who presented with severe hemiparesis (m-NIHSS, 8). Marked hyperintensity in the right descending CST on DWI at day 30 correlates with a decreased FA value and reduced brightness in the affected side, regarded as WD. Arrows indicate the affected right motor pathways at the level of the rostral pons
Correlations of FA measurements in the CST at day 30 with clinical scores and infarct volumes in patients with MCA infarction are reported in Table 3. None of the clinical scores or infarct volumes measured within 12 hours correlated with FA indexes in the CST at day 30. However, clinical severity at day 3 correlated with FA indexes at day 30, and the strongest correlation was between rFA and m-NIHSS score. Moreover, no significant differences in FA values were found between affected and unaffected CST at admission or at day 3, and these FA indexes were not correlated with motor status at 30 days (P =.292, r = 0.321; P = .231, r = 0.372, respectively). On the other hand, there was no significant correlation between acute infarct volume and the NIHSS and m-NIHSS scores at day 30 (P = .103, r = 0.472; P = .176, r = 0.485, respectively).
Correlations of affected side FA and rFA at day 30 of CST with clinical severity and infarct volume in patients with MCA strokea
Signal-intensity abnormalities on conventional MR imaging (hyperintensities) were detected in only 40% and 45.4% of affected CSTs in patients with m-NIHSS-II and m-NHISS-III at day 30, respectively (Fig 3). Changes in signal intensity were also associated with decreased FA and rFA values (P < .001). Subjects without motor deficit had no significant signal-intensity abnormalities.

rFAs between the affected and unaffected CSTs are lower in patients with motor deficits at 30 days; however, fewer than half presented with abnormal signal intensities on conventional MR imaging. The line parallel to the x-axis represents the prespecified cutoff point that discriminates patients with motor deficits on the basis of rFA. The graph shows medians and quartiles.
Discussion
This prospective study in a relatively large cohort of patients with territorial MCA infarction found significant correlations between DTI-measured WD in the CST and m-NIHSS-measured limb motor deficit 30 days after stroke onset. Decreased anisotropy distal to the infarct on the affected side of the CST, expressed as FA values measured at the rostral pons, correlated significantly with limb motor deficit at day 30.
As far as we know, no DTI data focused on a cutoff value for WD 30 days after stroke onset have been published. Care is needed when applying cutoff anisotropic values because changes in diffusion after WD depend strongly on the preexisting architecture of the white matter.15 Experimental studies suggest that the orientation of membranes continues to be the major determinant of anisotropy after WD. In fact, changes in diffusion observed in the rostral pons, where the CST intersects the transverse pontine fibers, differ substantially from changes observed in the cerebral peduncle or in the posterior limb of the internal capsule, where the CST consists of isolated and well-defined bundles of parallel fibers.16 Consequently, after white matter damage, cutoff anisotropic values at different points along the CST might differ, and further studies need to clarify this point.
We propose an rFA cutoff point that discriminates a high proportion of patients with normal motor function from those with motor deficit. We found that the rFA cutoff point discriminates these patients better than the FA cutoff point. Intraindividual evaluation by using rFA can detect damage to the CST ipsilateral to the infarct in patients with high baseline FA (patient 10, Table 2). On the other hand, the trajectory of the transverse pontine fibers can introduce error in calculating CST anisotropy measured at the rostral pons, and using rFA values minimizes this error. Finally, rFA is more applicable across centers and operators than absolute FA.
In the clinical setting, DTI enables evaluation of microstructural changes in the CST better than conventional MR imaging, quantifying the amount of damage specifically within the motor system after stroke. Although WD is associated with motor deficit, motor deficit is determined by loss of function of the motor neurons and/or axons, which may or may not be accompanied by WD.
Our study shows that imaging-based regional markers correlate with motor deficits in MCA stroke. By correlating DTI findings and clinical data, we found that motor deficits 30 days after stroke increased with decreased anisotropy in the pons. The decrease in the FA values in the affected CST becomes progressively smaller during the subacute-to-chronic stages of stroke, and previous studies have demonstrated worse outcome in patients with evident WD on conventional MR imaging techniques.8–12 Signal-intensity abnormalities related to WD are generally not detected until 4 weeks after stroke, when the main finding is a hyperintensity along the affected tracts on DWI and T2-weighted images. After assessing WD changes qualitatively on conventional images and quantitatively by using DTI, we found differences in anisotropy in patients with motor deficits who had no signal-intensity abnormalities on conventional MR imaging. Most important, most patients with motor deficits at 30 days who presented decreased FA values had no signal-intensity abnormalities on the affected side of the CST; more specifically, fewer than half presented hyperintensities on FLAIR and/or restricted diffusion on DWI. The signal-intensity change in the affected CST was strongly associated with lower FA indexes. These findings suggest that DTI is more sensitive in detecting tissue changes regarded as WD than conventional MR imaging and DWI.
In an experimental model after unilateral MCA occlusion in rats, signs of WD in the CST were detected in the brain stem in histologic stains as early as 2–7 days after the stroke.4 Within the second stage, WD decreased gradually up to 6 weeks. Other recent studies have demonstrated early signs of WD in patients with stroke within 2–3 weeks of onset by using DTI.16,24 Greater FA reduction along the CST on the affected side after cerebral infarction is associated with greater early motor deficit and worse motor recovery at 3 months.19–22 In our study, we found significant correlations between FA indexes and motor deficit only at 30 days, and the reductions in mean FA, 17% and 32% in patients with m-NIHSS-II and m-NIHSS-III respectively, are similar to other published values measured at the pons.15,18 Thomalla et al.17 found a 13% decrease in FA measured at the cerebral peduncle 2–6 months and 2–16 days after stroke.
Severe WD in the CST distal to a supratentorial infarct in the acute stage has been regarded as a predictor of worse motor outcome.17–25 Liang et al24 conducted a similar longitudinal controlled study by using serial DTI to assess both antegrade and retrograde WD in 12 patients with subcortical ischemic infarctions involving the posterior limb of the internal capsule. They found progressive decrease in FA with time starting from the first week in the region just proximal and distal to the internal capsule lesion. On the other hand, Wanatabe et al25 used serial DTI evaluations to assess WD in the CST of 16 patients with stroke (6 ischemic, 10 hemorrhagic). They found that the good recovery group had no significant change in anisotropy in the rostral pons between 2 and 3 weeks, whereas the poor recovery group had a significant decrease in anisotropy during that time. Although not specifically calculated, Fig 4 of their study shows that the 0.9 ratio is the approximate anisotropy cutoff for distinguishing the separate recovery groups 3 weeks after onset.
Recently, Kusano et al29 reported that FA indexes measured in the cerebral peduncles within 2 days after intracerebral hemorrhage onset may predict functional motor outcome. In this study, a region of interest−based analysis of the FA of the CST in the cerebral peduncles showed that FA measured in the affected side decreased by 11% compared with the unaffected cerebral peduncle. The cutoff point of the rFA for the good (m-NIHSS, 0–2) and poor (m-NIHSS scores ≥ 3) outcomes was 0.85. Despite the differences in the study design, disease, and time of evolution when the cutoff point was determined, our cutoff point of 0.925 at 30 days is very similar to theirs.
We found no earlier changes in DTI that predicted motor outcome. The 3-day follow-up included in our protocol failed to show changes in anisotropy at a point in the CST far from the infarct, specifically at the rostral pons. Placing the region of interest nearer to the infarct might find changes in FA values at day 3 that could predict poor motor outcome.
A valid surrogate functional outcome measure for stroke is needed. Clinical variables such as age and initial stroke severity measured with a neurologic deficit scale such as the NIHSS have consistently been associated with functional outcome after ischemic stroke.30 However, previous studies have demonstrated that infarct volume on conventional MR imaging correlates only modestly with functional outcome.31 We found that stroke severity at day 3 correlated negatively with rFA at day 30; however, this correlation was not found during the first 12 hours after onset. In the acute phase (<12 hours after onset), three-quarters of our patients had motor deficits, and they were moderate or severe (m-NIHSS-III) in nearly half of these patients. However, at day 3, only half of our patients had motor deficits and only 20% of these deficits were moderate or severe. These differences in motor deficits between the acute phase and day 3 are probably due to the ischemic penumbra (not evaluated in our study).
On the other hand, stroke volume measured on conventional MR imaging at day 3 and at day 30 correlated weakly with FA indexes at day 30. Volume measures do not take into account the location of the lesion or the functional pathways involved, and 2 different infarcts of the same size in different locations could have very different functional expression. Thus, rather than total stroke lesion volume, it seems much more reliable to use DTI to evaluate the extent of damage specifically within the CST to determine motor deficit and axonal injury. However, we found no evidence that stroke severity at day 3 was expressed as WD. Placing the region of interest in a region of the CST closer to the infarct might make it possible to detect changes in FA indexes earlier and to predict which patients will have worse outcomes in the chronic phase so that rehabilitation interventions can be adjusted to each patient's need from the earliest stages to use health care resources more efficiently.
One new research line aims to improve neurologic outcome through stem cell−based treatment of chronic stroke.32 Although the study of the mechanisms underlying stem cell−based treatment has focused on angiogenesis and neurogenesis, white matter reorganization may contribute to functional recovery after stroke. The earliest stem cell transplantations were carried out 4–9 weeks from onset,33 and 4 weeks was also the time when our study demonstrated CST damage in the patients with motor deficits. DTI may also be useful in determining the real state of the CST before treatment, quantifying the amount of damage specifically within the motor system after stroke, and FA indexes could be an alternative way of monitoring the changes in cerebral tissue that lead to improved outcome.
Several potential limitations to our study merit comment. First, manual region-of-interest placement is subject to operator bias, especially at day 30, when CST damage is present, and this may result in variability in location, size, and shape. Ideally, all the descending motor pathway areas should have been included to avoid underestimating the degree of DTI change and thus the degree of WD. Further studies by using automated region-of-interest analysis or voxel-based analysis may resolve this issue. Using m-NIHSS categorization does not diminish the significance of the association between decreased FA and motor deficit, though dedicated neuromotor test batteries like the Medical Research Council Scale or Motricity Index might find significant anisotropic differences between different grades of motor deficits. On the other hand, it could be interesting to determine other anisotropic parameters, like mean diffusivity or diffusion tensor eigenvalues, and to analyze whether changes in the affected tract can be detected earlier to enable better and earlier prognosis. Finally, the small number of patients with motor deficits at 30 days could be a limitation; however, our sample size seems sufficient given that the profile of patients defined by the inclusion criteria is similar, the variability in the findings for the unaffected side among all patients is low, and the normal unaffected side served as an internal control that minimized the potential variability among patients. Nevertheless, a larger sample would have increased the power of our findings.
Conclusions
In summary, the current study shows that DTI is more sensitive than conventional MR imaging in detecting WD and provides further evidence that FA could potentially be used as an imaging surrogate marker for motor deficit. To our knowledge, this is the first study to determine an anisotropic cutoff point in the evaluation of WD in patients with motor deficits 30 days after stroke. Identifying imaging biomarkers of WD represents a real challenge and could have implications for clinical decision-making. Evaluation of CST integrity by using anisotropic parameters can be useful for setting therapeutic goals and for selecting and monitoring patients with stroke for individual rehabilitation strategies.
Footnotes

-
This work was partially supported by a grant from the Spanish Ministry of Health (Fondo de Investigaciones Sanitarias, reference PI060745) and by the I-Know research project (027294-I-Know-STREP).
-
Paper previously presented in part at: International Stroke Conference, February 17–20, 2009; San Diego, California.

Indicates open access to non-subscribers at www.ajnr.org
References
- Received September 17, 2009.
- Accepted after revision December 30, 2009.
- Copyright © American Society of Neuroradiology
In this issue


Jump to section
Related Articles
Cited By...
- The role of corticospinal and extrapyramidal pathways in motor impairment after stroke
- Beyond Diffusion Tensor MRI Methods for Improved Characterization of the Brain after Ischemic Stroke: A Review
- Suspecting unwitnessed hypoglycaemia
- Basal Ganglia versus Peripheral Infarcts: Predictive Value of Early Fiber Alterations
- Predicting Motor Outcome in Acute Intracerebral Hemorrhage
- Alterations in the spinal cord and ventral root after cerebral infarction in non-human primates
- Axial diffusivity changes in the motor pathway above stroke foci and functional recovery after subcortical infarction
- Motor Recovery Prediction With Clinical Assessment and Local Diffusion Homogeneity After Acute Subcortical Infarction
- Diffusional Kurtosis Imaging and Motor Outcome in Acute Ischemic Stroke
- Detection and Predictive Value of Fractional Anisotropy Changes of the Corticospinal Tract in the Acute Phase of a Stroke
- Early Fiber Number Ratio Is a Surrogate of Corticospinal Tract Integrity and Predicts Motor Recovery After Stroke
- Predicting Future Brain Tissue Loss From White Matter Connectivity Disruption in Ischemic Stroke
- Natural History and Prognostic Value of Corticospinal Tract Wallerian Degeneration in Intracerebral Hemorrhage
- Secondary Degeneration Detected by Combining Voxel-Based Morphometry and Tract-Based Spatial Statistics in Subcortical Strokes with Different Outcomes in Hand Function
- Decreased Corticospinal Tract Fractional Anisotropy Predicts Long-term Motor Outcome After Stroke
- Different Characteristics of the Corticospinal Tract According to the Cerebral Origin: DTI Study
- The Fate of Injured Corticospinal Tracts in Patients with Intracerebral Hemorrhage: Diffusion Tensor Imaging Study
- Extent of Bilateral Neuronal Network Reorganization and Functional Recovery in Relation to Stroke Severity
- Diffusion tensor imaging, permanent pyramidal tract damage, and outcome in subcortical stroke
- Diffusion Tensor MRI Reveals Chronic Alterations in White Matter Despite the Absence of a Visible Ischemic Lesion on Conventional MRI: A Nonhuman Primate Study
- Acute Damage to the Posterior Limb of the Internal Capsule on Diffusion Tensor Tractography as an Early Imaging Predictor of Motor Outcome after Stroke