
Abstract
BACKGROUND AND PURPOSE: Stroke volume, an increasingly used end point in phase II trials, is considered stationary at least 30 days after the ictus. We investigated whether information conveyed by MR imaging measurements of the “final” infarct volume could be assessed as early as the subacute stage (days 3–6), rather than waiting for the chronic stage (days 30–45).
MATERIALS AND METHODS: Ninety-five patients with middle cerebral artery stroke prospectively included in a multicenter study underwent MR imaging during the first 12 hours (MR imaging-1), between days 3 and 6 (MR imaging-2), and between days 30 and 45 (MR imaging-3). We first investigated the relationship between subacute (FLAIR-2) and chronic volumes (FLAIR-3), by using a linear regression model. We then tested the relationship between FLAIR volumes (either FLAIR-2 or FLAIR-3) and functional disability, measured by the mRS at the time of MR imaging-3, by using logistic regression. The performances of the models were assessed by using the AUC in ROC.
RESULTS: A linear association between log FLAIR-2 and log FLAIR-3 volumes was observed. The proportion of FLAIR-3 variation, explained by FLAIR-2, was high (R2 = 81%), without a covariate that improved this percentage. Both FLAIR-2 and FLAIR-3 were independent predictors of mRS (OR, 0.79 and 0.73; 95% CI, 0.64–0.97 and 0.56–0.96; P = .026 and .023). The performances of the models for the association between either FLAIR volume and mRS did not differ (AUC = 0.897 for FLAIR-2 and 0.888 for FLAIR-3).
CONCLUSIONS: Stroke damage may be assessed by a subacute volume because subacute volume predicts the “true” final volume and provides the same clinical prognosis.
Abbreviations
- ADC
- apparent diffusion coefficient
- AUC
- area under the curve
- BI
- Barthel index
- CI
- confidence interval
- DWI
- diffusion-weighted imaging
- ECASS
- European Cooperative Acute Stroke Study
- EPITHET
- Echo-Planar Imaging Thrombolytic Evaluation Trial
- FLAIR
- fluid-attenuated inversion recovery
- ICA
- internal carotid artery
- log
- logarithmic
- MRA
- MR angiography
- mRS
- modified Rankin Scale, NIHSS =
- National Institutes of Health Stroke Scale; OR
- odds ratio
- PH
- parenchymal hematoma
- PWI
- perfusion-weighted imaging
- Q1-Q3
- first and third quartile of interquartile range
- ROC
- receiver operating characteristic analysis
- TP
- time point
- TTP
- time-to-peak
- VIRAGE
- Valeur predictive des paramètres IRM à la phase aigue de l'Accident vasculaire cerebral: application à la Gestion des Essais thérapeutiques
Infarct volume is a direct measurement of 1 of the final pathologic steps leading to the clinical deficits caused by an ischemic stroke.1 Therefore, final infarct volume derived from MR imaging represents an objective and valid measurement of stroke consequences. Infarct volume has been proposed as an alternative (surrogate end point) to classic disability or handicap scales,2,3 being able to improve the efficacy of phase II trials by increasing their statistical power and, therefore, their ability to reach conclusions about the potential benefits of therapy.4 The same marker is also frequently used in conceptual studies, particularly in penumbra proof-of-concept studies, which consider the fate of “at risk” tissue as an outcome variable.5
Nevertheless, there is currently no consensus as to the appropriate timing for final infarct volume measurements. Typically, outcome scans are performed relatively late, between 30 days6 and 90 days2,7 following the insult when the infarct volume is considered as fixed. It was recently shown that changes in volume between day 30 and day 90 were insignificant, proving that a time span of 30 days following ictus is sufficient to assess final infarct volume.8 An earlier measurement, conducted during the first week, is thought to overestimate stroke lesions due to vasogenic edema.9 Nevertheless, such early measurements, taken before the patient's discharge from the hospital, could greatly facilitate future studies and trials because this early end point could decrease the study duration, costs, and the number of patients lost to follow-up.
Our study's aim was to evaluate whether information provided by MR imaging measurements of “final” cerebral infarct volume could be assessed as early as the subacute stage (days 3–6), rather than waiting for the chronic stage (days 30–45), thereby leading to an earlier outcome marker.
Materials and Methods
Patients
A total of 95 patients with first middle cerebral artery acute ischemic stroke were included in a prospective national multicenter observational cohort study called VIRAGE. The study was approved by the institutional review board, and written informed consent was obtained from all participants. Four university hospitals in France recruited patients between September 2003 and June 2008. Primary inclusion criteria were as follows: men and women, older than 18 years, with a clinical diagnosis of minor-to-severe cerebral infarct (NIHSS scores between 4 and 20) in the left or right middle cerebral artery territory evolving for <12 hours. Exclusion criteria were the following: coma, transient ischemic attacks or lacunar syndrome, pregnant or breast-feeding women or women without a negative pregnancy test, and contraindications to MR imaging.
Patients were examined at 3 predefined TPs following the insult: TP1, < 12 hours; TP2, between day 3 and day 6; and TP3, between day 30 and day 45. MR imaging was performed at each TP. The NIHSS Score was recorded at TP1, whereas BI and mRS were assessed at TP2 and TP3. NIHSS, BI, and mRS were evaluated by neurologists with expertise in the administration of these scales, who were unaware of the volume measurements. Clinical and biologic data were collected via electronic case report forms.
MR Imaging Protocol
MR imaging studies were performed on 1.5T magnets (Intera and Achieva, Philips Healthcare, Best, the Netherlands; and Magnetom Vision, Siemens, Erlangen, Germany). Sequence parameters were standardized across centers and summarized in detail elsewhere.10 TP1 and TP2 scans included DWI (DWI-1 and DWI-2), dynamic susceptibility PWI (PWI-1 and PWI-2), time-of-flight MRA (MRA-1 and MRA-2), and FLAIR (FLAIR-1 and FLAIR-2). At chronic follow-up (TP3), FLAIR-3, and DWI-3 were analyzed. T2* gradient recalled-echo was also available at each TP.
Data Processing and Image Analysis
MR imaging studies were centralized by using an independent core laboratory (Bio-Imaging, Lyon, France), which developed dedicated software tools for randomized image-review sessions. All MR images were read at the coordinating center by investigators blinded to the clinical information. Results were automatically extracted by Bio-Imaging and then sent directly to the core statistical unit to ensure safety against post hoc changes because the data could no longer be modified after transfer.
DWI and FLAIR Volumes.
Stroke volumes were assessed by a neuroradiologist (T.T.) outlining FLAIR and DWI abnormalities at each TP. Both sequences were viewed simultaneously on a single screen, together with ADC-1 at TP1 and ADC-2 at TP2. This allowed the reader to edit lesion borders on DWI hyperintensity with decreased ADC and FLAIR hyperintensity in the corresponding topography. For TP3, FLAIR-3 and DWI-3 were shown with FLAIR-1 and DWI-1 to edit lesion borders on FLAIR-3 hyperintensity corresponding to the infarcted territory on DWI-1, with particular attention being paid to avoid replication of pre-existing chronic lesions present on FLAIR-1. If present, the volume of hemorrhagic transformation was included, and its subtype was noted according to the ECASS radiologic classification based on a T2* gradient-recalled sequence.11 The order of appearance on the screens was randomized so that volumes at TP2 were analyzed by readers blinded to the measurements at TP3. All volumes were pre-detected by using an automatic unsupervised 3D segmentation algorithm (Bio-Imaging), followed by a manual validation by the reader, by using interactive drawing tools. We previously reported a very good reproducibility (intraclass correlation coefficients between 0.86 and 0.96) for such quantitative volume measurements on the first 30 patients from the VIRAGE data base.12
PWI Analyses.
Perfusion deficit volumes were estimated by the same reader at TP1 and TP2, according to the time-to-peak maps computed by Bio-Imaging randomly displayed along with the corresponding DWI sequences. A 4-second threshold was chosen as a reliable estimate of penumbral flow,13 according to a previously described method.14
MRA Analyses.
A second reader (P.R.) reviewed all MRAs at TP1 and TP2 in a randomized order, including the native images reconstructed in 3 orthogonal planes, maximum intensity projections, and DWI-1 to indicate the infarct side. Scoring of the distal ICA and the middle cerebral artery M1 and M2 status was categorized as follows: 1 = normal, 2 = disturbed flow, 3 = occluded, and 4 = technically inadequate.
Statistical Analyses
The descriptive statistics used were mean ± SD or medians and quartiles (Q1–Q3). Volume comparisons were performed by using the nonparametric paired-sample Wilcoxon signed rank test.
To address the main issue, we first evaluated whether a subacute measure could predict the fixed (eg, chronic) volume and, second, whether a subacute measure could provide the same prognostic information on the “true” clinical outcome as a chronic measure could.
The association between the chronic volume (FLAIR-3) and the subacute volume (FLAIR-2) was first estimated by using a Spearman rank correlation coefficient. Then, for the prediction of FLAIR-3 by the measurement of FLAIR-2, a multivariable linear model was used according to a backward stepwise method,15 with the independent variables listed in Table 1. Assumptions of normality and homoscedasticity of residuals (the difference between the observed values and the values predicted by the model) were graphically checked. The adjusted coefficient of determination, R2, was used to assess the percentage of variability explained by the variables included in the model.
Independent variablesa
Last, the association between functional disability at days 30–45 and either FLAIR-2 or FLAIR-3 volumes was estimated by using multivariable logistic regression according to a backward stepwise method,15 with the independent variables listed in Table 1. For this purpose, disability was assessed by mRS dichotomized at a cutoff of 1 for 2 major reasons: First, mRS was a better tool after mild stroke (as seen in the VIRAGE population) than BI16; and second, a full recovery defined as mRS ≤ 1 was the criterion used in the main studies demonstrating the efficacy of alteplase.17,18 Results with mRS dichotomized at a cutoff of 2 were also presented as secondary analyses. The performances of the models were assessed by using the AUC in an ROC for both models.
All analyses were performed by using SAS Software, Version 9.1.3 (SAS Institute, Cary, North Carolina).
Results
Patient Characteristics and Neuroimaging Variables
Of the 95 patients, 4 were excluded from analyses because both MR imaging-2 and MR imaging-3 data were missing. Two patients were transferred to another hospital and lost to follow-up, 1 died, and 1 underwent pacemaker implantation after MR imaging-1, contraindicating other MR imaging scans. The remaining 91 patients underwent a total of 267 MR imaging examinations (91 MR imaging-1, 90 MR imaging-2, and 86 MR imaging-3). One MR imaging at TP2 was technically inadequate for FLAIR volume, due to motion artifacts. At TP3, 2 MR images were technically inadequate, 2 patients died before TP3, and 1 patient was not able to undergo MR imaging-3, due to clinical deterioration.
Table 2features the patient characteristics. Neuroimaging variables were as follows: MR imaging-1 was performed after a mean delay of 6.3 ± 3.3 hours following stroke onset (n = 91). In total, 17 patients (18.7%) were examined during the first 3 hours, 29 (31.9%) between 3 and 6 hours, and 44 (48.4%) between 6 and 12 hours. MR imaging-2 was performed after a mean delay of 4.2 ± 1.1 days (n = 90), and MR imaging-3, after a mean delay of 37.9 ± 13.5 days (n = 86). Median lesion volume significantly increased from DWI-1 (13.4 cm3) to FLAIR-2 (25 cm3, P < .05; n = 90) and then significantly regressed to FLAIR-3 (20 cm3, P < .05; n = 86). Figure 1 shows an illustrative case of the volume time course, and Table 3 provides details on volume measurements and reperfusion data. At TP2, 30 patients exhibited hemorrhagic transformation (33%). Most had hemorrhagic petechia (HI1, n = 15, and HI2, n = 8, according to the ECASS classification), and 7 had PH (PH1, n = 7, and PH2, n = 0).
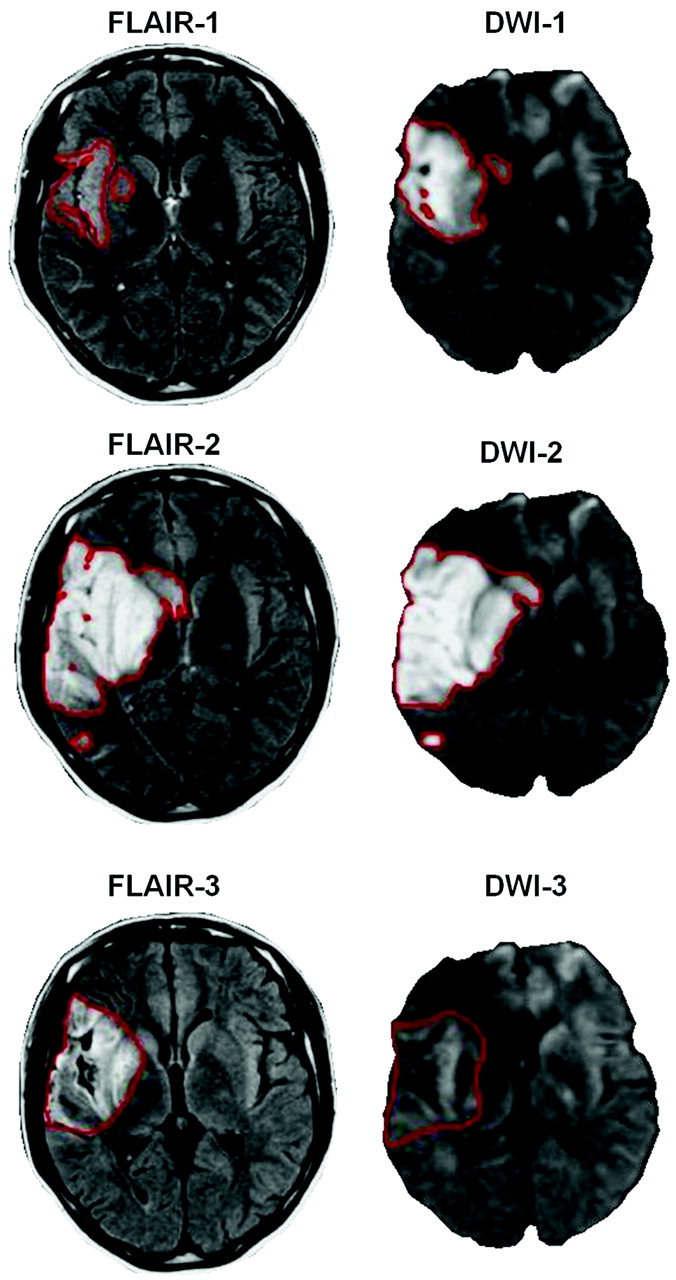
Example of time course of volumes. Axial FLAIR and axial DWI acquired within the first 12 hours following stroke onset (FLAIR-1 and DWI-1), between 3 and 6 days (FLAIR-2 and DWI-2), and between 30 and 45 days (FLAIR-3 and DWI-3). Typically, the pattern of volume change includes an increase at the subacute stage and a secondary decrease between the subacute and chronic stages.
Patient characteristics, VIRAGE study
Imaging characteristics, VIRAGE study
Relationship between Subacute and Chronic Volumes
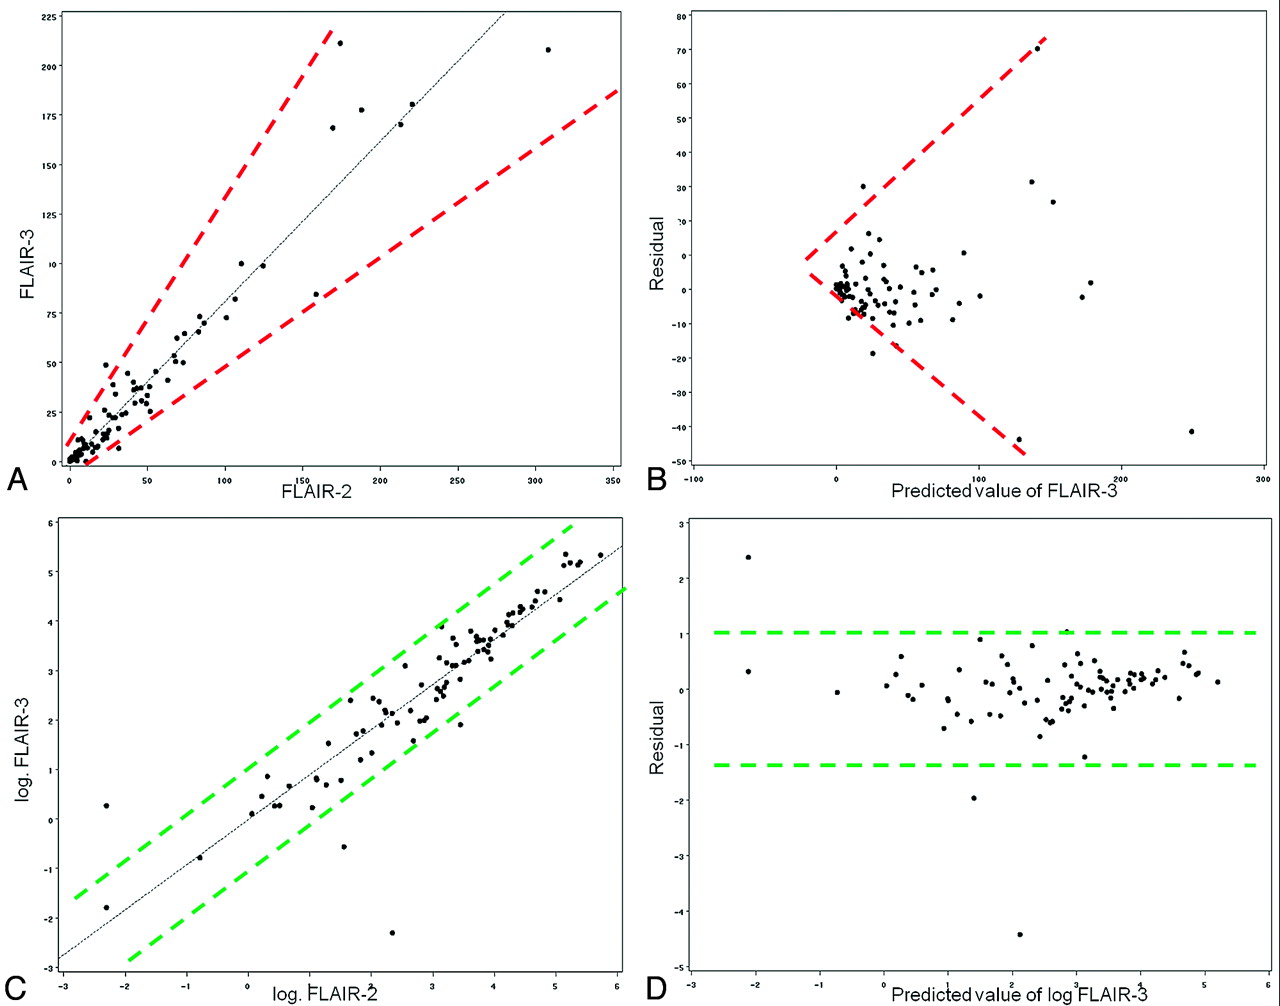
The Spearman rank correlation coefficient assessing the relationship between lesion volumes at TP2 and TP3 was high (0.95, P < .001, n = 85) between FLAIR-2 and FLAIR-3. Nevertheless, for large volumes (>100 cm3), FLAIR-2 volumes could evolve toward very different FLAIR-3 volumes (Fig 2A). In the linear regression model, this resulted in a residual dispersion for large volumes (called “heteroscedasticity”), indicating that a linear relationship between FLAIR-2 and FLAIR-3 was not verified for the entire volume range (Fig 2B).

Scatterplots of lesion volumes. A and C, The association of FLAIR-2/FLAIR-3 and log FLAIR-2/log FLAIR-3, respectively. B and D, The representations of the residuals as a function of FLAIR-3 or log FLAIR-3 predicted values. Residuals represent the difference between the observed values (FLAIR-3 in B and log FLAIR-3 in D) and the values predicted by the model. The prediction of the model is good if residuals are concentrated around zero for the entire set of predicted values. In the case of absolute values, the more the FLAIR-2 volume increases, the less efficient is the prediction of FLAIR-3 is (A, red broken lines), resulting in a residual dispersion for higher volume (>100 cm3) prediction (B, red broken lines: heteroscedasticity). After logarithmic transformation, there is no longer any dispersion for large volumes (C, green broken lines) and residuals are highly concentrated around the zero point without dispersion (D, broken dot lines: homoscedasticity).
To take this dispersion into account, we applied a logarithmic transformation to volume measurements at TP2 and TP3. In line with this hypothesis, a strong linear relationship between log FLAIR-2 and log FLAIR-3 (Fig 2C) was observed. The residuals were distributed normally, with a high concentration around zero and no major dispersion for large volumes (Fig 2D).
We next checked whether the association between FLAIR-2 (log of the volume) and FLAIR-3 (log of the volume) was still significant after the introduction of other variables (Table 1), which might modulate the apparent final infarct volume. After a backward stepwise selection of covariates, the final model amounted to a univariate relationship between log FLAIR-2 and log FLAIR-3 (β = 0.91, P < .0001, n = 85), with the R2 coefficient equal to 0.81.
Relationship between Volumes and Clinical Outcomes
Figure 3 illustrates the associations between FLAIR volumes and mRS, which were rather similar by using either FLAIR-2 or FLAIR-3 volumes.
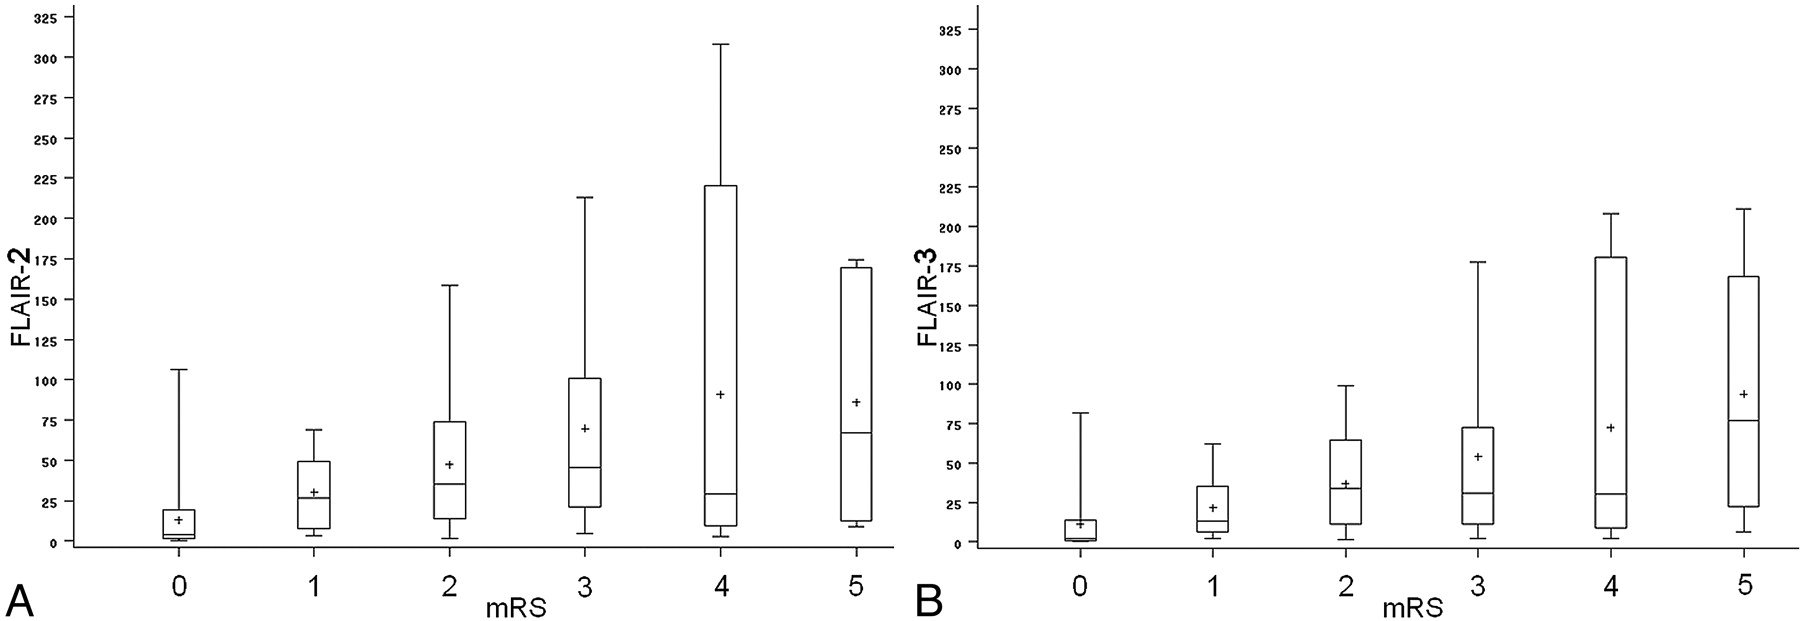
FLAIR volumes (either FLAIR-2 in part A or FLAIR-3 in part B) according to disability assessed by mRS. The cross inside the box represents the mean. The middle bar is the median. Upper and lower extremities of the box are Q1 and Q3, respectively. Maximum and minimum values are represented by extreme lines. Larger FLAIR volumes are associated with worse clinical prognosis with a similar tendency by using either FLAIR-2 or FLAIR-3.
To evaluate the association between volumes and disabilities as well as the role of potential confounders more effectively, we performed a multivariable analysis predicting mRS dichotomized at a cutoff score of 1. Final models, including either FLAIR-2 or FLAIR-3 volumes, are shown in Table 4. Age (introduced by class according to quartiles), initial NIHSS Score reperfusion, and FLAIR volumes (either FLAIR-2 or FLAIR-3) were independent predictors of mRS. However, the association of either FLAIR-2 or FLAIR-3 with disability was weak (OR, 0.79 and 0.73; 95% CI, 0.64–0.97 and 0.56–0.96; P = .026 and .023). The performances of the models were similar after introducing either FLAIR-2 (AUC = 0.897) or FLAIR-3 (AUC = 0.888) volumes.
Final models of prediction of mRS ≤1 including either FLAIR-2 volume (model 1) or FLAIR-3 volume (model 2)a
When we changed the mRS threshold from 1 to 2, FLAIR volumes remained significantly associated with mRS (OR = 0.86 and 0.83; P = .002 for FLAIR-2 and FLAIR-3, respectively), in univariate analysis. When we used the mRS threshold at a cutoff of 2, multivariate models (FLAIR volume + initial NIHSS Score + persistent occlusion) provided the same performance, introducing either FLAIR-2 (AUC = 0.870) or FLAIR-3 (AU = 0.887) volumes. With this cutoff at 2, the variable “persistent occlusion” was the stronger predictor, and FLAIR-2 and FLAIR-3 volumes did not reach significance, while FLAIR volumes were associated with the variable occlusion (median FLAIR-2 = 96.4 cm3 versus 38.7 cm3, P = .017; FLAIR-3 = 90.6 cm3 versus 27.9 cm3, P= .006 for patients with persistent occlusion versus patients without persistent occlusion).
Discussion
In this study, we found evidence for an early (<7 days) measurement of poststroke consequences because subacute volumes, even if they were overestimated by vasogenic edema, made it possible to accurately predict chronic (eg, fixed, after 30 days) volumes; subacute volumes provided the same estimation of clinical outcome as chronic volumes.
This finding could greatly improve the feasibility of phase II drug trials and proof-of-concept studies,5,7 thereby facilitating the translation from preclinical studies in which infarct volume is traditionally used as the primary end point.19 Nineteen percent of the variance of FLAIR-3 unexplained by FLAIR-2 (R2 = 81%) could be considered as an acceptable loss of information when using subacute measurements. The advantages obtained would largely compensate for the loss of information: these are decreased study duration and costs, lower likelihood of confounding events unrelated to the intervention (such as another stroke), decreased loss to follow-up, and the lack of outcome measurements possibly leading to a biased and difficult interpretation of the study results. As an example, in our study, the outcome assessment at days 30–45 led to the loss of 5 patients, compared with only 1 patient at days 3–6; up to 30% of the patients were unable to undergo a 90-day MR imaging scan in the EPITHET study.7 Earlier prognostic estimates can also assist with anticipating rehabilitation needs and can provide earlier information for patients and their relatives.
During the first week after insult, the apparent brain infarct, which is a dynamic process, has a tendency to expand, due to both vasogenic edema and increasing ischemic brain tissue injury. The subsequent decrease may be explained by a combination of edema resolution, decrease of the inflammatory process, and atrophy.9 Recently, Gaudinski et al8 demonstrated that infarct volume did not vary significantly between days 30 and 90. This finding raised the question of whether it was possible to predict this fixed stage as early as days 3–6. Following this hypothesis, we found a good correlation between subacute and chronic volumes in line with previous work,20,21 which nevertheless failed to take into account whether statistical conditions of a linear relationship were met for the full spectrum of volumes. Indeed, the estimation of FLAIR-3 was less efficient in the case of large volumes, resulting in a dispersion of the residuals. This could be accounted for by an evolution of the lesions, which was not uniform among patients, particularly in the case of large volumes in which early edema and later atrophy were predominant. We showed that a logarithmic transformation corrected this issue with a highly significant linear relation between log FLAIR-2 and log FLAIR-3, allowing us to conclude that the fixed infarct volume was predictable at days 3–6. Moreover, all covariates ceased to have an impact on volumes between TP2 and TP3, with most of the variability of FLAIR-3 explained by FLAIR-2 (R2 = 81%).
As a potential surrogate marker, infarct volumes must be correlates of the expected clinical outcomes.4 Therefore, our study dealt with the relationship between volumes and clinical outcomes. We found that FLAIR volumes were significant and independent predictors of clinical outcomes. The correlations were not very strong, a point largely reported in the literature22–24 and easy to understand, considering the numerous additional factors that can influence clinical outcomes at the disability/handicap level (On-line Fig 1).25–27 Here, other clinical (initial stroke severity, age) or neuroimaging (recanalization, reperfusion) variables were significantly associated with the outcome, in line with previous studies.25,28 The relatively weak association between infarct volumes and clinical outcomes does not necessarily discredit volume as a surrogate marker. In fact, treatment efficacy is certainly easier to demonstrate at this first hierarchical level (level of volumes in On-line Fig 1) in phase II studies, while it could be “diluted” at a higher levels (levels of disability or handicap in On-line Fig 1). An analogy could be made with multiple sclerosis. In this instance, the correlation between MR imaging−measured plaque volumes and clinical scales was even weaker, these volumes, nevertheless, being one of the most influential end points in neurologic pharmaceutical trials.29
More interesting than the radioclinical correlation per se, we evaluated the first direct comparison between volumes measured at different TPs and disability. The major result was that FLAIR-3 did not provide additional information because the strength of the association between FLAIR-3 and mRS was similar to that between FLAIR-2 and mRS. This was an additional argument in favor of not waiting longer than 1 week to assess final infarct volumes. This result was in line with a subanalysis from the EPITHET population, which found the same prognostic value for subacute or chronic volumes in predicting day 90 NIHSS scores.21 Here, we extended these data by choosing mRS, a global measurement of disability and handicap widely used in phase III trials,17,18 instead of NIHSS, which is used to measure neurologic deficits and is not necessarily correlated with an individual's functional recovery.16,30
The dataset used in this study presents some limitations. First, reperfusion and recanalization were assessed at days 3–6, which is suboptimal for this end point because numerous patients exhibit spontaneous recanalization before this time span.7 However, by choosing the “persistent occlusion” variable rather than recanalization in an effort to avoid merging early and late recanalization, we took into account this latter important factor. Second, disability scales were measured after 30–45 days, which may be too early because recovery only reaches a plateau 5–6 months after a stroke.16 Functional and global scales are more valid in the long-term assessment of stroke consequences,31 and this feature could have decreased the relationship between FLAIR volumes and mRS. Third, our patient sample was not representative of the full spectrum of patients with stroke, particularly because it included few severe strokes. This could limit the generalization of the obtained results to the entire stroke population. Nevertheless, similar characteristics, particularly initial NIHSS Score, can be found in most of the previous studies with multiple MR imaging6 or in recent therapeutic trials.18 Last, one must keep in mind that a correlation (between surrogate and clinical end points) is not sufficient for a surrogate to be valid.4,32 Proper justification for such a replacement requires that the effect of the intervention on the surrogate end point predicts the effect on the clinical outcome.4,32 It should be valid for recanalization therapy, such as fibrinolysis, which directly decreases the follow-up FLAIR lesion volume from the acute DWI-lesion volume.33 More attention should be paid to other strategies like neuroprotectors or neurotrophic factors, which could influence disability or handicap levels, while the mean volume may remain unchanged.
Conclusions
Poststroke consequences could be assessed by FLAIR volume during the first week (days 3–6) rather than waiting for the chronic stage. The current study represents the first step in the complex process of the validation of MR imaging metrics for monitoring treatment effects, but it provides encouraging results and will have to be considered in future therapeutic trials, which could include a subacute infarct volume to assess other surrogacy criteria4,32 before the definitive validation of this measure.
Acknowledgments
We thank V. Sesay from the department of neuroradiology at the University Hospital of Bordeaux, France, who supervised the VIRAGE data base. VIRAGE is a multicenter data base coordinated by the University Hospital of Bordeaux. We also thank the contributors from the University Hospitals of Grenoble (A. Jaillard and M. Hommel from the neurovascular department; J.F. Le Bas and S. Grand from the neuroradiology department), Montpellier (D. Milhaud from the neurovascular department, A. Bonafe from the neuroradiology department), and Toulouse (J.F. Albucher from the neurovascular department, C. Manelfe and C. Cognard from the neuroradiology department) who participated in patient recruitment for the VIRAGE study.
Footnotes
-
VIRAGE was part of an approved national research and clinical hospital project funded in 2003 by a public national grant.
-
Paper previously presented at: European Congress of Radiology, March 4–8, 2010; Vienna, Austria.
-
Indicates article with a supplemental on-line figure.
Indicates open access to non-subscribers at www.ajnr.org
References
- Received April 7, 2010.
- Accepted after revision July 3, 2010.
- Copyright © American Society of Neuroradiology
In this issue


Jump to section
Related Articles
Cited By...
- Assessment of three MR perfusion software packages in predicting final infarct volume after mechanical thrombectomy
- Impact of Ischemic Lesion Location on the mRS Score in Patients with Ischemic Stroke: A Voxel-Based Approach
- Association of Computed Tomography Ischemic Lesion Location With Functional Outcome in Acute Large Vessel Occlusion Ischemic Stroke
- Acute Stroke Imaging Research Roadmap III Imaging Selection and Outcomes in Acute Stroke Reperfusion Clinical Trials: Consensus Recommendations and Further Research Priorities
- Plaque Components in Symptomatic Moderately Stenosed Carotid Arteries Related to Cerebral Infarcts: The Plaque At RISK Study
- Final Infarct Volume Is a Stronger Predictor of Outcome Than Recanalization in Patients With Proximal Middle Cerebral Artery Occlusion Treated With Endovascular Therapy
- Intensive Versus Subcutaneous Insulin in Patients With Hyperacute Stroke: Results From the Randomized INSULINFARCT Trial