
Abstract
BACKGROUND AND PURPOSE: Pre-treatment ADC characteristics have been shown to predict response to bevacizumab in recurrent glioblastoma multiforme. However, no studies have examined whether ADC characteristics are specific to this particular treatment. The purpose of the current study was to determine whether ADC histogram analysis is a bevacizumab-specific or treatment-independent biomarker of treatment response in recurrent glioblastoma multiforme.
MATERIALS AND METHODS: Eighty-nine bevacizumab-treated and 43 chemotherapy-treated recurrent glioblastoma multiformes never exposed to bevacizumab were included in this study. In all patients, ADC values in contrast-enhancing ROIs from MR imaging examinations performed at the time of recurrence, immediately before commencement of treatment for recurrence, were extracted and the resulting histogram was fitted to a mixed model with a double Gaussian distribution. Mean ADC in the lower Gaussian curve was used as the primary biomarker of interest. The Cox proportional hazards model and log-rank tests were used for survival analysis.
RESULTS: Cox multivariate regression analysis accounting for the interaction between bevacizumab- and non-bevacizumab-treated patients suggested that the ability of the lower Gaussian curve to predict survival is dependent on treatment (progression-free survival, P = .045; overall survival, P = .003). Patients with bevacizumab-treated recurrent glioblastoma multiforme with a pretreatment lower Gaussian curve > 1.2 μm2/ms had a significantly longer progression-free survival and overall survival compared with bevacizumab-treated patients with a lower Gaussian curve < 1.2 μm2/ms. No differences in progression-free survival or overall survival were observed in the chemotherapy-treated cohort. Bevacizumab-treated patients with a mean lower Gaussian curve > 1.2 μm2/ms had a significantly longer progression-free survival and overall survival compared with chemotherapy-treated patients.
CONCLUSIONS: The mean lower Gaussian curve from ADC histogram analysis is a predictive imaging biomarker for bevacizumab-treated, not chemotherapy-treated, recurrent glioblastoma multiforme. Patients with recurrent glioblastoma multiforme with a mean lower Gaussian curve > 1.2 μm2/ms have a survival advantage when treated with bevacizumab.
ABBREVIATIONS:
- ADCL
- apparent diffusion coefficient in the lower Gaussian curve
- GBM
- glioblastoma multiforme
- HR
- hazard ratio
- OS
- overall survival
- PFS
- progression-free survival
- UCLA
- University of California, Los Angeles
- VEGF
- vascular endothelial growth factor
Malignant gliomas, including anaplastic astrocytomas, anaplastic oligodendrogliomas, anaplastic mixed oligoastrocytomas, and glioblastoma multiforme (GBM), account for almost 80% of malignant primary brain tumors.1 GBM, the most aggressive and malignant type of primary brain tumor, has a mean survival of only 12–14 months under the current standard of care of radiotherapy combined with concurrent temozolomide, along with adjuvant temozolomide.2,3 GBMs are highly vascular tumors, recruiting existing vasculature and generating neovasculature from excessive levels of circulating angiogenic growth factors, including vascular endothelial growth factor (VEGF). The highly vascular nature of these tumors has led to a new class of antiangogenic agents, for which there are many ongoing clinical trials in GBM.4⇓–6
Standard imaging techniques are limited in their ability to evaluate the effectiveness of antiangiogenic therapy in malignant gliomas due to a reduction in contrast enhancement. These limitations have resulted in a surge of more advanced imaging biomarkers aimed at predicting response to therapy, as summarized in various review articles.7,8 Among these new imaging biomarkers showing promise are diffusion MR imaging techniques,9⇓⇓⇓⇓⇓⇓⇓⇓–18 including ADC histogram analysis. Previous results have shown that pretreatment ADC histogram analysis performed within the contrast-enhancing tumor regions can stratify patients with recurrent GBM into high- and low-risk groups. When using a double Gaussian mixed model to represent the ADC histogram, previous studies have shown that a lower mean value of the Gaussian curve (ADCL) results in a significantly shorter progression-free survival (PFS) and overall survival (OS) in both single-institution9 and multicenter clinical trial data19 when evaluating bevacizumab in malignant gliomas. An important question remains as to whether ADC histogram analysis is a predictive biomarker specific to antiangiogenic therapy in recurrent GBM or whether it is a predictive biomarker independent of the particular treatment administered. In the current study, we performed ADC histogram analysis in patients with recurrent GBM from the University of California, Los Angeles (UCLA) treated with bevacizumab and those with recurrent GBM from the University of Toronto treated with a variety of chemotherapies and never exposed to bevacizumab, to determine whether ADC histogram analysis performed before treatment in recurrent GBM is a bevacizumab-specific or treatment-independent biomarker of treatment response.
Materials and Methods
Patients
Eighty-nine patients with recurrent glioblastoma from UCLA treated with bevacizumab and 43 with recurrent glioblastoma from the University of Toronto treated with a variety of chemotherapies and never exposed to bevacizumab were included in this retrospective study. Data acquisition was performed in compliance with all applicable regulations of the Health Insurance Portability and Accountability Act. Bevacizumab-treated patients were retrospectively selected from the UCLA neuro-oncology data base from November 15, 2005, to August 31, 2010. All UCLA patients in this study signed institutional review board–approved informed consent to have their data included in our research data base. Bevacizumab-treated patients met the following criteria: 1) had pathologically confirmed GBM with recurrence based on MR imaging, clinical data, and/or histology; 2) were regularly treated every 2 weeks per cycle with bevacizumab (5 or 10 mg/kg body weight) alone or in combination with chemotherapy (carboplatin, irinotecan, etoposide, lomustine) at either the first (63 of 89 patients), second (22 of 89 patients), or third tumor recurrence (4 of 89 patients); 3) had baseline (pre-bevacizumab treatment) standard and diffusion MR images available for analysis; and 4) had treatment with bevacizumab at least 3 months after completion of radiation therapy to reduce the probability of pseudoprogression and treatment-induced necrosis. At the last evaluation, 72 of 89 bevacizumab-treated patients with recurrent GBM were deceased.
University of Toronto, chemotherapy-treated patients (n = 43) met the following criteria: 1) had pathologically confirmed GBM with recurrence based on MR imaging, clinical data, and/or histology; 2) were never treated with bevacizumab but instead were treated with continuous temozolomide (n = 17), were rechallenged with 5 days of temozolomide per 28-day cycle (n = 5), and were treated with etoposide (n = 4) or with lomustine (n = 17) at either the first (40 of 43 patients) or second tumor recurrence (3 of 43 patients); 3) had baseline (postrecurrence, pretreatment) standard and diffusion MR images available for analysis; and 4) had treatment at least 3 months after completion of radiation therapy to reduce the probability of pseudoprogression and treatment-induced necrosis. At the time of last evaluation, 41 of 43 chemotherapy-treated patients with recurrent GBM were deceased. The local ethics committee at the University of Toronto approved this retrospective study.
Standard and Diffusion MR Imaging
Standard and diffusion MR imaging data were acquired by using either a 1.5T or 3T MR imaging scanner (Sonata/Avanto/Trio/Verio; Siemens, Erlangen, Germany) using pulse sequences supplied by the manufacturer. Standard anatomic images included axial T1-weighted fast spin-echo or MPRAGE sequences, T2-weighted fast spin-echo, and T2-weighted FLAIR images. Diffusion MR images were acquired before injection of exogenous contrast agents. DWI was obtained with TE/TR = 80–110 ms/4–10 seconds, 1 average, section thickness = 5 mm with 1-mm intersection gap, matrix size = 128 × 128, and FOV = 22–25 cm by using a monopolar spin-echo echo-planar preparation. ADC images were calculated from acquired DWI with b=1000 s/mm2 and b=0 s/mm2 images. Additionally, gadopentetate dimeglumine–enhanced (Magnevist; Bayer HealthCare, Wayne, New Jersey; 0.1 mmol/kg) axial T1-weighted images were acquired shortly after contrast injection.
ADC Histogram Analysis
Contrast-enhancing tumor regions observed on pretreatment, postcontrast T1-weighted images were segmented by using standard techniques. Briefly, tumor ROIs were isolated by manually defining the relative region of tumor occurrence, thresholding postcontrast T1-weighted images within these regions by using an empiric threshold, and then manually editing the resulting masks to exclude any nontumor tissue. ADC values were then extracted from contrast-enhancing image voxels (Fig 1). A double Gaussian mixed model was then fit to the histogram data by using nonlinear regression in GraphPad Prism, Version 4.0c (GraphPad Software, San Diego, California). The double Gaussian model was defined as
 where p(ADC) is the probability of obtaining a particular value of ADC in the histogram, f is the relative proportion of voxels represented by the lower histogram, N(μ,σ) represents a normal (Gaussian) distribution with mean μ and SD σ, ADCL represents the lower and ADCH represents the larger of the 2 Gaussian distributions (Fig 1). The accuracy of model fits were manually examined to exclude erroneous results. In some cases, nonlinear regression was rerun with different initial conditions until convergence was obtained. The mean of the lower Gaussian curve, μADCL, was used as the primary biomarker for patient risk stratification. High-risk patients were identified by μADCL ≤ 1.2 μm2/ms, whereas low-risk patients were identified by μADCL > 1.2 μm2/ms, based on empiric thresholds identified in previous studies.9,10,19,20

ADC histogram analysis in 2 representative patients with recurrent GBM. A, Postcontrast T1-weighted MR imaging. B, Apparent diffusion coefficient map. C, ADC histogram analysis of a 63-year-old patient with recurrent GBM treated with bevacizumab at first recurrence. This patient had μADCL = 0.8 μm2/ms, PFS = 17 days, and OS = 68 days from the first scanning date. D, Postcontrast T1-weighted MR imaging. E, ADC map. F, ADC histogram analysis of a 71-year-old patient with recurrent GBM treated with bevacizumab at first recurrence. This patient had μADCL = 1.4 μm2/ms and did not progress or die >1238 days after the baseline MR imaging.
Definition of Tumor Progression
For UCLA patients, tumor recurrence was confirmed by using either direct pathologic confirmation, 18F-FDOPA (3,4-dihydroxy-6-[18F]-fluoro-l-phenylalanine) PET, or unequivocal evidence on MR imaging as indicated by a board-certified neuroradiologist. For University of Toronto data, tumor recurrence was confirmed by using either direct pathologic confirmation, unequivocal evidence on MR imaging as indicated by a board-certified neuroradiologist, or neurologic deterioration consistent with growing tumor. Unequivocal evidence on MR imaging was determined by >2 sequential months of increasing contrast enhancement on postcontrast T1-weighted images, along with evidence of increasing mass effect.
Statistical Analysis
Baseline characteristics of the 2 cohorts (those treated with bevacizumab on recurrence and those never treated with bevacizumab) were compared by using a t test and log-rank test for progression-free survival and overall survival. Kaplan-Meier curves were graphed by treatment type or by ADCL group with the prespecified threshold of 1.2 μm2/ms. Log-rank analysis and Cox hazard models were used to examine the hazard ratio of the ADC characteristics in the progression-free survival or overall survival within the cohort or within the ADCL threshold. Multivariate Cox hazard models with covariates of age, treatment cohort, dichotomized ADCL threshold, and the interaction between mean ADCL and the 2 treatment cohorts were used to test the predictive classifier effect of ADCL in the bevacizumab-treated group. For all analyses, P < .05 was considered statistically significant. Statistical analyses were performed with STATA, 12 (StataCorp, College Station, Texas).
Results
No difference in age was found between the bevacizumab- and chemotherapy-treated cohorts (University of Toronto: mean, 55.3 ± 9.9 years of age; UCLA, mean = 58.0 ± 12 years of age; Student t test, P = .17). Similarly, no difference in PFS (University of Toronto: median = 76 days; UCLA: median = 127 days; log-rank, P = .20) or OS (University of Toronto: median = 250 days; UCLA: median = 304 days; log-rank, P = .62) was found between patients treated with bevacizumab at recurrence and those treated with chemotherapy and never receiving bevacizumab during their clinical history.
Consistent with previous reports,9,19 univariate log-rank analysis applied to individual Kaplan-Meier curves indicated that bevacizumab-treated patients with μADCL > 1.2 μm2/ms had a significantly longer PFS compared with bevacizumab-treated patients with μADCL ≤ 1.2 μm2/ms (Fig 2A; log-rank, median PFS = 153 days versus 85 days, HR = 0.4938, P = .0006). No difference in PFS was observed in the chemotherapy-treated group when stratified by mean ADCL (Fig 2B; log-rank, HR = 1.324, P = .3737). For patients with pretreatment tumor μADCL ≤ 1.2 μm2/ms, no difference in PFS was observed between chemotherapy or bevacizumab treatment (Fig 2C; log-rank, HR = 0.8088, P = .3675). Patients with μADCL > 1.2 μm2/ms, however, showed a significant PFS advantage when treated with bevacizumab compared with standard chemotherapies (Fig 2D; log-rank, HR = 0.4396, P = .0038). Using the lowest risk patients (bevacizumab-treated patients with μADCL > 1.2 μm2/ms) as the baseline for comparison, multivariate Cox regression suggested that both age at diagnosis and the interaction between specific treatments and mean ADCL were significant predictors of PFS (Cox model: overall P = .0094; age covariate: HR = 0.9823, P = .036; chemotherapy-treated × μADCL > 1.2 μm2/ms: HR = 2.230, P = .045), where older patients and patients with μADCL > 1.2 μm2/ms demonstrated a more favorable PFS.

Progression-free survival comparisons between treatments (bevacizumab or chemotherapy) and ADCL thresholds (μADCL > 1.2 μm2/ms or μADCL ≤ 1.2 μm2/ms) in recurrent GBM. A, Comparison of PFS between μADCL > 1.2 μm2/ms and μADCL ≤ 1.2 μm2/ms in bevacizumab-treated patients (log-rank, P = .0006). B, Comparison of PFS between μADCL > 1.2 μm2/ms and μADCL ≤ 1.2 μm2/ms in chemotherapy-treated patients (log-rank, P = .3737). C, Comparison of PFS between bevacizumab- and chemotherapy-treated patients with recurrent GBM exhibiting μADCL ≤ 1.2 μm2/ms (log-rank, P = .3675). D, Comparison of PFS between bevacizumab and chemotherapy-treated patients exhibiting μADCL > 1.2 μm2/ms (log-rank, P = .0038).
Trends in overall survival were similar to those observed with progression-free survival. Consistent with previous studies, univariate log-rank analysis of Kaplan-Meier data suggested that patients with μADCL > 1.2 μm2/ms had a significantly longer OS compared with bevacizumab-treated patients with μADCL ≤ 1.2 μm2/ms (Fig 3A; log-rank, median OS = 376 days versus 255 days, HR = 0.4883, P = .0016). No difference in OS was observed in the chemotherapy-treated group when stratified by mean ADCL (Fig 3B; log-rank, HR = 1.691, P = .0942). Unlike bevacizumab-treated patients, patients with higher mean ADCL treated with standard chemotherapy tended to have a shorter OS compared with patients exhibiting lower mean ADCL in contrast-enhancing regions before treatment. No difference in OS was observed between chemotherapy- and bevacizumab-treated patients exhibiting μADCL ≤ 1.2 μm2/ms (Fig 3C; log-rank, HR = 0.6245, P = .0516), though chemotherapy-treated patients with μADCL ≤ 1.2 μm2/ms trended toward a longer OS compared with bevacizumab-treated patients (median OS = 309 days versus 255 days). Patients with μADCL > 1.2 μm2/ms demonstrated a significantly longer OS when treated with bevacizumab compared with standard chemotherapy (Fig 3D; log-rank, HR = 1.960, P = .0254), showing almost double the median survival (median OS = 376 days versus 194 days). Again by using the lowest risk patients (bevacizumab-treated patients with μADCL > 1.2 μm2/ms) as the baseline for comparison, multivariate Cox regression suggested that mean ADCL, treatment and the interaction between specific treatments and mean ADCL were significant predictors of OS (Cox model: overall P = .047; μADCL ≤ 1.2 μm2/ms, HR = 1.976, P = .009; chemotherapy: HR = 1.714, P = .050; chemotherapy × μADCL > 1.2 μm2/ms, HR = 0.2790, P = .003).
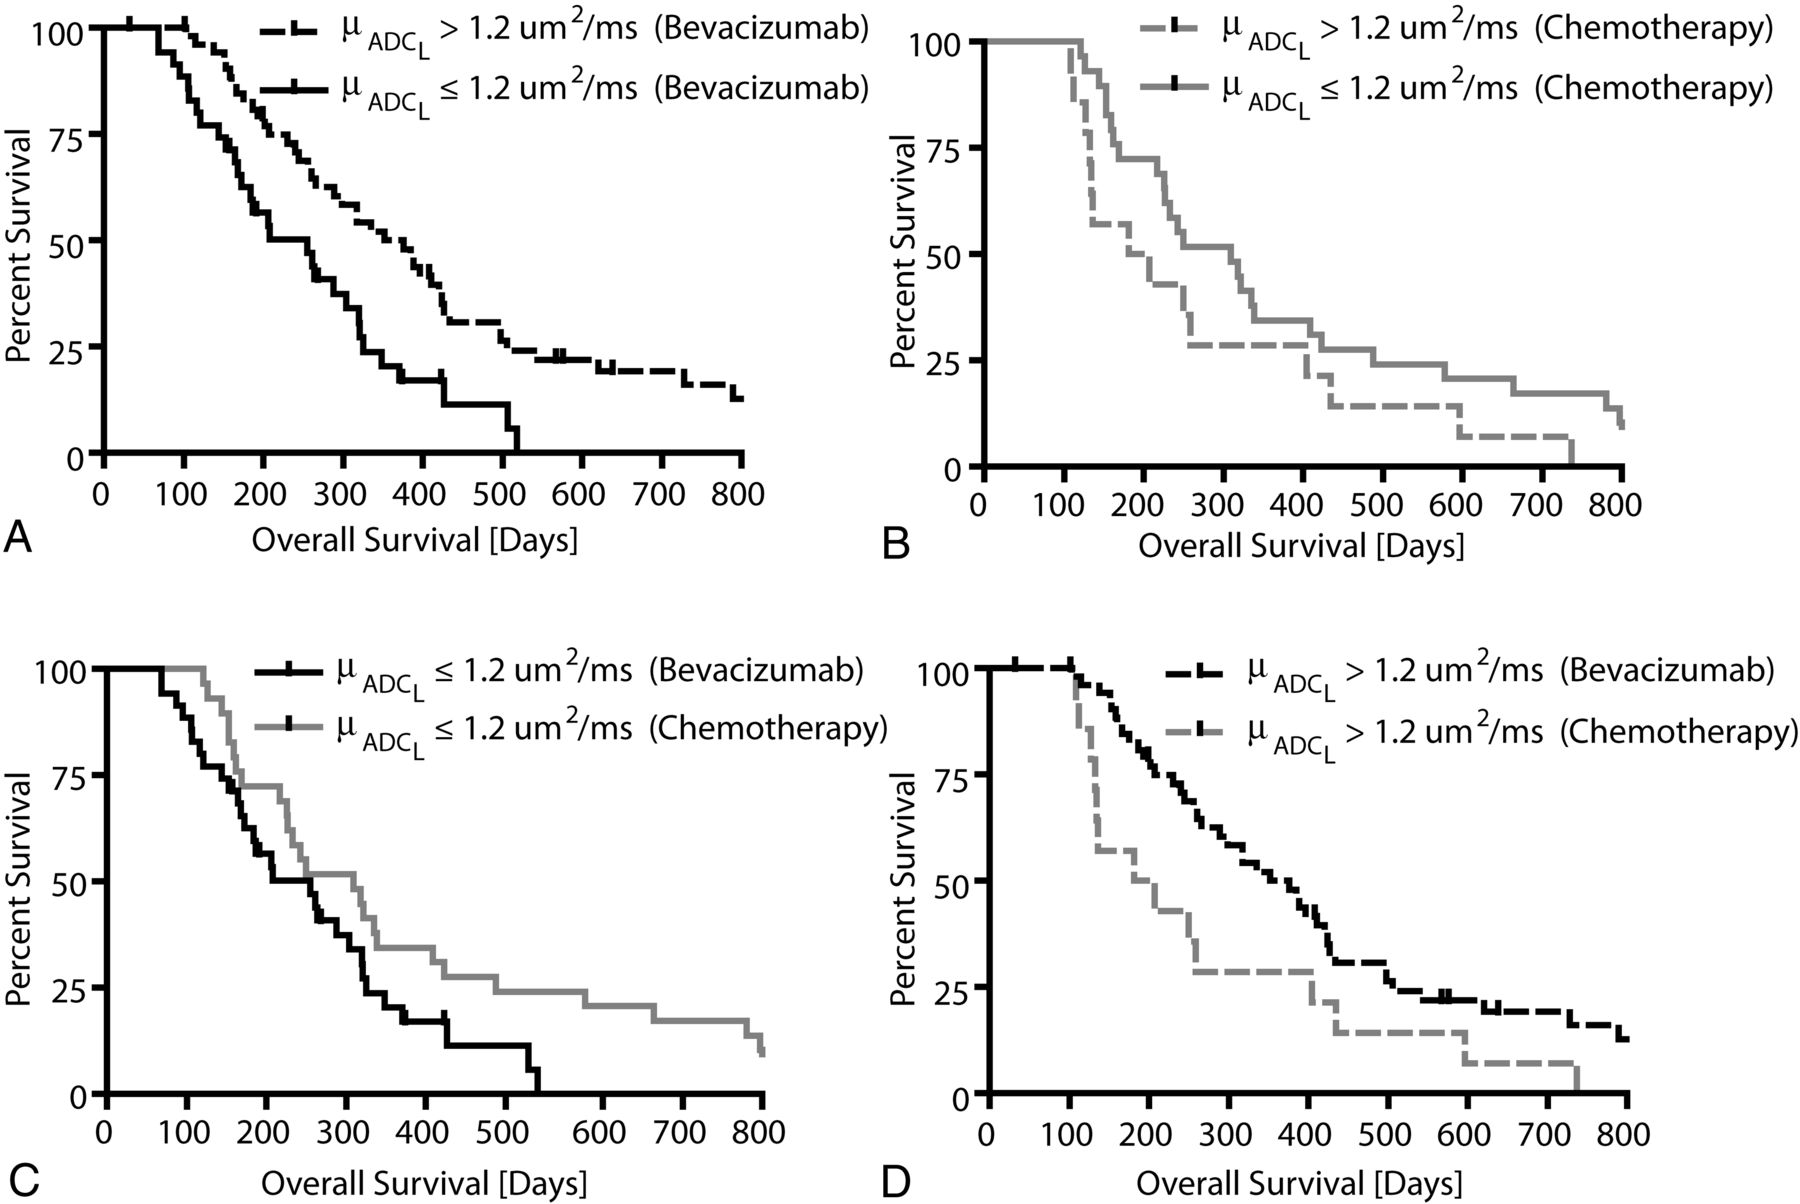
Overall survival comparisons between treatments (bevacizumab or chemotherapy) and ADCL thresholds (μADCL >1.2 μm2/ms or μADCL ≤ 1.2 μm2/ms) in recurrent GBM. A, Comparison of OS between μADCL > 1.2 μm2/ms and μADCL ≤ 1.2 μm2/ms in bevacizumab-treated patients (log-rank, P = .0016). B, Comparison of OS between μADCL > 1.2 μm2/ms and μADCL ≤ 1.2 μm2/ms in chemotherapy-treated patients (log-rank, P = .0942). C, Comparison of OS between bevacizumab- and chemotherapy-treated patients with recurrent GBM exhibiting μADCL ≤ 1.2 μm2/ms (log-rank, P = .0516). D, Comparison of OS between bevacizumab and chemotherapy-treated patients exhibiting μADCL > 1.2 μm2/ms (log-rank, P = .0254).
Discussion
Although previous studies have demonstrated the ability of pretreatment ADC histogram analysis to predict recurrent GBM response to bevacizumab in both single-9 and multicenter clinical trials,19 a significant question remained as to whether this type of analysis is a predictive biomarker, specific to bevacizumab therapy, or whether it is a prognostic biomarker independent of the type of treatment. A previous study9 did suggest that pretreatment ADC histogram analysis could predict response to recurrent GBM treated with bevacizumab, but not in matched patients with recurrent GBM treated with a non-VEGF-targeted investigative antiangiogenic agent. The patients treated with this non-VEGF-targeted investigative agent, however, were likely eventually treated with bevacizumab after tumor progression as per the standard of care for recurrent GBM in the United States. Unlike this previous investigation, the current study involved an international collaboration with a site where bevacizumab is not used routinely for recurrent GBM, allowing direct comparison of patients with recurrent GBM treated with bevacizumab with patients never exposed to bevacizumab during their clinical history. Results from the current study clearly indicate pretreatment ADC histogram analysis is a predictive imaging biomarker for bevacizumab (anti-VEGF) therapy, but not chemotherapy, within the context of recurrent glioblastoma.
Although perfusion MR imaging and MR spectroscopy have shown promise as early response biomarkers for bevacizumab once therapy has been initiated, there are currently no acceptable pretreatment clinical biomarkers for judicious preselection of patients with GBM who may maximally benefit from bevacizumab at recurrence. Results from the current study suggest that patients with recurrent GBM with a μADCL > 1.2 μm2/ms within contrast-enhancing regions have a significant survival advantage when treated with bevacizumab compared with a standard chemotherapeutic agent, demonstrating nearly double the median PFS (153 days versus 76.5 days) and OS (376 days versus 194 days). Conversely, patients with μADCL ≤ 1.2 μm2/ms do not appear to benefit from bevacizumab therapy at recurrence, and it may, in fact, perform slightly worse than standard therapies (Fig 3C). These current results, along with results from previous studies,9,19 support the use of ADC histogram analysis in recurrent GBM to guide the use of bevacizumab in second-line therapy.
The precise mechanism and biologic correlates for survival differences based on ADC histogram analysis remain controversial. In the current study, we demonstrated a decreased PFS and OS with a decrease in ADC for bevacizumab-treated patients with GBM; however, these trends may be specific to bevacizumab treatment at tumor recurrence. In a study involving newly diagnosed patients with GBM treated with bevacizumab, an ADC histogram analysis suggested that patients with μADCL >1.2 μm2/ms had a worse PFS and OS compared with patients demonstrating a tumor μADCL ≤ 1.2 μm2/ms.10 Differential gene expression analysis uncovered overexpression of various extracellular matrix genes in patients with upfront GBM with μADCL >1.2 μm2/ms,20 suggesting that an elevated ADCL within newly diagnosed tumor may be influenced by extracellular matrix reorganization due to invading tumor. The biologic basis for the clear survival advantage of high ADCL tumors treated with bevacizumab in the recurrent setting has not been validated with histology or gene-expression data and, therefore, remains speculative. The lack of response from low ADCL tumors treated with bevacizumab in the recurrent setting may suggest either a more hypoxic or hypercellular tumor, because both of these factors may influence ADC measurement. Because bevacizumab-treatment-acquired resistance may result in transformation to a more aggressive, infiltrating tumor phenotype through prolonged hypoxia,21,22 it is conceivable that a more hypoxic recurrent tumor presenting with a lower ADCL before bevacizumab therapy may represent tumors with de novo resistance to bevacizumab. Future studies aimed at eliciting the precise biologic mechanism for observed differences in survival between ADC histogram-stratified recurrent GBMs are necessary to further guide therapy and treatment recommendations.
Study Limitations
An important advantage of the proposed ADC histogram analysis techniques used in the current study is the use of standard, clinically acquired diffusion MR imaging data for subsequent analysis, allowing retrospective comparison with other techniques at different institutions and use in controlled, multicenter clinical trials. Despite this advantage, the use of standard, clinical diffusion MR imaging parameters did not allow an ideal choice of b-values used to accurately estimate ADC. Per the recommendations of the National Cancer Institute Diffusion MR Imaging Consensus Conference,23 ≥3 b-values (0 s/mm2, >100 s/mm2, and >500 s/mm2) should be used for estimation of perfusion-insensitive ADC. Additionally, the use of standard, clinical diffusion MR images in ADC histogram analysis can be confounded by other pathologies; therefore, the possibility of confounding factors should also be considered.
Another limitation to the current study was its retrospective nature and the inability to control the timing of pretreatment MR imaging acquisitions. Studies have shown that in antiangiogenic therapies, the timing of MR imaging acquisitions is particularly important for the prediction of response.24 Despite the retrospective nature of the current study, our results demonstrate that ADC maps obtained 1.5 weeks before initial treatment with bevacizumab allowed strong prediction of patient survival.
Last, patients treated with bevacizuamb were from one institution, and patients treated with chemotherapy were from a different institution; therefore, we were not able to account for potential site-specific differences in survival independent of therapy. In addition, despite similar criteria being used for determining tumor progression after therapy, tumor progression was determined at each site independently. Although the difference in progression-free and overall survival between institutions is likely to be small, this is a potential limitation to the current study.
Conclusions
Results suggest that mean ADCL extracted from ADC histogram analysis is a predictive imaging biomarker for stratifying PFS and OS in bevacizumab-treated, but not chemotherapy-treated, recurrent glioblastoma. Results suggest that patients with recurrent GBM with a mean ADCL> 1.2 μm2/ms in pretreatment contrast-enhancing tumor regions have a survival advantage when treated with bevacizumab, whereas patients with mean ADCL≤ 1.2 μm2/ms may not benefit from bevacizumab.
Footnotes
Benjamin M. Ellingson and Solmaz Sahebjam contributed equally to this manuscript.
Disclosures: Whitney B. Pope—RELATED: Consulting Fee or Honorarium: Genentech/Roche, UNRELATED: Consultancy: Amgen, Exelixis, Tocagen. Albert Lai—UNRELATED: Consultancy: Genentech/Roche,* Comments: Scientific Advisory Board. Warren P. Mason—UNRELATED: Consultancy: Roche, Comments: paid consultant for Hoffmann-La Roche, Payment for Lectures (including service on Speakers Bureaus): Roche. Timothy F. Cloughesy—RELATED: Grant: Roche,* Genentech,* Consulting Fee or Honorarium: Roche, Genentech, UNRELATED: Consultancy: Merck Serono, Merck, Appogenix, NewGen, Tocagen. Benjamin M. Ellingson—Paid consultant for MedQIA, LLC, and nonpaid consultant for Genentech, Inc. *Money paid to the institution.
This work was supported by the following: National Institutes of Health/National Cancer Institute R21CA167354 (B.M.E.); UCLA Institute for Molecular Medicine Seed Grant (B.M.E.); UCLA Radiology Exploratory Research Grant (B.M.E.); University of California Cancer Research Coordinating Committee Grant (B.M.E.); American College of Radiology Imaging Network Young Investigator Initiative Grant (B.M.E.); Art of the Brain (T.F.C.); Ziering Family Foundation in memory of Sigi Ziering (T.F.C.); Singleton Family Foundation (T.F.C.); and Clarence Klein Fund for Neuro-Oncology (T.F.C.).
Paper previously presented at: Annual Meeting of the American Society of Neuroradiology; May 18–23, 2013; San Diego, California.
Indicates open access to non-subscribers at www.ajnr.org
References
- Received June 25, 2013.
- Accepted after revision August 9, 2013.
- © 2014 by American Journal of Neuroradiology


Jump to section
Related Articles
Cited By...
- Pretreatment ADC Histogram Analysis as a Prognostic Imaging Biomarker for Patients with Recurrent Glioblastoma Treated with Bevacizumab: A Systematic Review and Meta-analysis
- MRI and 18FET-PET Predict Survival Benefit from Bevacizumab Plus Radiotherapy in Patients with Isocitrate Dehydrogenase Wild-type Glioblastoma: Results from the Randomized ARTE Trial
- Radiomics in Brain Tumor: Image Assessment, Quantitative Feature Descriptors, and Machine-Learning Approaches
- Diffusion MRI Phenotypes Predict Overall Survival Benefit from Anti-VEGF Monotherapy in Recurrent Glioblastoma: Converging Evidence from Phase II Trials
- Restriction Spectrum Imaging Improves Risk Stratification in Patients with Glioblastoma
- Early Biomarkers from Conventional and Delayed-Contrast MRI to Predict the Response to Bevacizumab in Recurrent High-Grade Gliomas