
Abstract
BACKGROUND AND PURPOSE: The morphology of the human thalamus shows high interindividual variability. Therefore, direct visualization of landmarks within the thalamus is essential for an improved definition of electrode positions for deep brain stimulation. The aim of this study was to provide anatomic detail in the thalamus by using inversion recovery TSE imaging at 7T.
MATERIALS AND METHODS: The MR imaging protocol was optimized on 1 healthy subject to segment thalamic nuclei from one another. Final images, acquired with 0.52-mm2 in-plane resolution and 3-mm section thickness, were compared with stereotactic brain atlases to assign visualized details to known anatomy. The robustness of the visualization of thalamic nuclei was assessed with 4 healthy subjects at lower image resolution.
RESULTS: Thalamic subfields were successfully delineated in the dorsal aspect of the lateral thalamus. T1-weighting was essential. MR images had an appearance very similar to that of myelin-stained sections seen in brain atlases. Visualized intrathalamic structures were, among others, the lamella medialis, the external medullary lamina, the reticulatum thalami, the nucleus centre médian, the boundary between the nuclei dorso-oralis internus and externus, and the boundary between the nuclei dorso-oralis internus and zentrolateralis intermedius internus.
CONCLUSIONS: Inversion recovery–prepared TSE imaging at 7T has a high potential to reveal fine anatomic detail in the thalamus, which may be helpful in enhancing the planning of stereotactic neurosurgery in the future.
ABBREVIATIONS:
- ACPC
- anterior/posterior commissure
- DBS
- deep brain stimulation
- D.o.e
- nucleus dorso-oralis externus
- D.o.i
- nucleus dorso-oralis internus
- IR-TSE
- inversion recovery turbo-spin-echo
- La.m
- lamella medialis
- Z.im.i
- nucleus zentrolateralis intermedius internus
MR imaging, due to its excellent soft-tissue-contrast capabilities, has become the most important imaging technique for the living brain. Nevertheless, the thalamus, characterized by its rich structural variety,1⇓–3 appears virtually isointense in routine high-resolution MR images. The lack of visible anatomic detail within the thalamus affects presurgical planning of deep brain stimulation (DBS) procedures. Considering that thalamic morphology can show significant interindividual variability,3 direct visualization of intrathalamic anatomy is necessary for a more precise patient-specific planning of brain electrode positions.
Besides the small size of some thalamic nuclei, the main reason for the lack of contrast is the similarity of MR imaging–relevant tissue parameters such as relaxation times and/or proton densities of adjacent thalamic structures. However, as long as differences in contrast-relevant tissue properties exist, their delineation by an appropriate MR imaging technique is mainly a question of SNR. Several years ago, the wide availability of 3T MR imaging scanners triggered a series of studies aiming to visualize internal substructures of the thalamus,4⇓⇓⇓⇓⇓⇓–11 extending the research done at 1.5T.12⇓⇓⇓–16 Although noticeable progress was made, the visualization of thalamic nuclei with 3T MR imaging for DBS surgery is not a clinical routine to date. It seemed reasonable to assume that the SNR boost offered by MR imaging at 7T could further improve the visualization of thalamic nuclei. Indeed, the first encouraging results have been reported by using SWI, quantitative susceptibility mapping, and MPRAGE imaging.17⇓–19 This feasibility study aims to investigate the usefulness of inversion recovery turbo-spin-echo (IR-TSE) MR imaging at 7T in revealing anatomic detail within the thalamus. This task comprises both the optimization of the MR imaging acquisition and the assignment of visualized structures to thalamic anatomy.
Materials and Methods
We examined 5 healthy subjects (2 men; 21–28 years of age) in accordance with stipulations put forth by the local ethics committee. All subjects gave written informed consent before the experiment.
MR imaging was performed at 7T (Siemens, Erlangen, Germany) with a 32-channel head coil (Nova Medical, Wilmington, Massachusetts). Each subject's head was immobilized by using cushions. Optimization of the IR-TSE protocol was done with a subject who had been specifically trained to keep his head still during prolonged scanning times. Scanning parameters of the final IR-TSE acquisitions with high in-plane resolution were the following: transversal-section orientation parallel to the anterior/posterior commissure (ACPC) plane; section thickness, 3-mm; in-plane resolution, 0.52 mm2; turbo factor, 5–7; TR, 3–3.2 seconds; TE, 10–14 ms; TI, 480–500 ms; bandwidth, 140–203 Hz/pixel; 1 section or 10 sections with 2 interleaved concatenations; averages, 2–5; scanning time, 13 minutes 45 seconds through 19 minutes 10 seconds. To estimate longitudinal relaxation time, T1, we acquired a series of the IR-TSE protocol, measuring a single section at a section position of 10 mm cranial to the ACPC plane with a TR of 3.2 seconds and a varied TI of 25, 250, 500, 750, 1000, 1250, 1500, and 2000 ms with an in-plane resolution of 0.62 mm2. The T2 map was measured at the same section position with a series of spin-echo measurements with a constant difference between the TR and TE.20
For the sake of comparison, TSE images were acquired as well with the following parameters: 2.5-mm section thickness and 0.5-mm intersection gap; 0.52-mm2 in-plane resolution; turbo factor, 5; TR, 3 seconds; TE, 15 ms; bandwidth, 131 Hz/pixel; 1 concatenation with an inferior saturation band; averages, 3; scanning time, 13 minutes 30 seconds. The other 4 subjects were imaged for the first time in a 7T scanner. To reduce the risk of motion-induced image degradation, we selected an IR-TSE protocol with a shorter scan duration and a larger voxel volume (2-mm section thickness; 0.72-mm2 in-plane resolution; turbo factor, 7; TR, 3.3 seconds; TE, 10 ms; TI, 500–700 ms; bandwidth, 186 Hz/pixel; 8 sections with 2 interleaved concatenations; averages, 2; scanning time, 10 minutes 2 seconds. To optimize the SNR of the applied sequences, we adjusted the global amplifier reference to ensure that the nominal flip angles of 90° and 180° applied in the thalamus.
The T1 map was fitted voxelwise to the signal-intensity equation: I = c {1–2 exp(−TI/T1) + exp[−(TR−TElast)/T1]}, where TElast denotes the echo time of the last echo in the echo train and c is a scaling factor. The T2 map was fitted to a single exponential decay. MR images were compared with labeled photographs and drawings in stereotactic brain atlases3,21,22 to assign visible differentiation to known thalamic anatomy. Apart from a few exceptions, we used the terminology introduced by Hassler.1
Results
Figure 1 shows axial MR images through the thalamus at a position of about 10 mm dorsal to the ACPC plane, with the corresponding section of the atlas of Schaltenbrand and Wahren21 at position H.d +7.0. At first glance, a high degree of similarity between the IR-TSE image (TI = 500 ms) and the T1 map (calculated from a series of MR images with different TIs) is noticeable. However, more striking is the richness of visible anatomic detail in the lateral thalamus. For illustrative purposes, some salient landmarks are marked in white (Fig 1, bottom row). Arrowheads point to the mamillothalamic tract, paired arrowheads indicate the stria medullaris, and arrows point to the nucleus centre médian (Ce). The bold white line connecting the mamillothalamic tract and the most anterior part of the centre médian depicts the lamella medialis (La.m). Pairs of arrows point to a hypointense band between the mamillothalamic tract and the rostral border of the thalamus, separating the nuclei lateropolaris (Lpo) and anteromedialis (A.m) thalami. This structure, not explicitly assigned in the Schaltenbrand and Wahren atlas, is identified in the atlas of Mai et al22 as the internal medullary lamina, (ie, the myelin-rich sheet that largely corresponds to the La.m in the atlas of Schaltenbrand and Wahren21). The dotted and the thin white lines in Fig 1 mark well-defined signal-intensity transitions in the lateral thalamus. According to the corresponding section in the Schaltenbrand and Wahren atlas,21 we assigned the thin line to the border between the nuclei dorso-oralis internus (D.o.i) and externus (D.o.e) and the dotted line to the boundary between the D.o.i and the nucleus zentrolateralis intermedius internus (Z.im.i). Finally, the dashed lines designate a narrow hypointense band in the posterior thalamus separated by narrow hyperintense bands from the internal capsule and the lateral thalamic nuclei. We identify this dark band as the external medullary lamina and the hyperintense band between the external medullary lamina and the internal capsule as the reticulatum thalami (Rt). Although the latter 2 bands are clearly distinguishable, at least in the posterior half of the thalamus, in the Schaltenbrand and Wahren atlas21 they are subsumed under the Rt. In contrast, Mai et al22 differentiate the external medullary lamina and Rt in the posterior thalamus (frontal sections, plates 42–49, position 26.5–36.0 mm).

Display of MR and brain atlas images. An IR-TSE MR image (left column) and a T1 map (middle column) of the thalamus of a healthy subject and the corresponding axial section from the Schaltenbrand and Wahren atlas for Stereotaxy of the Human Brain,21 including an illustrative sketch (right columns, plate LXXVIII H.d +7.0). Reproduced with permission from Thieme Medical Publishers. To facilitate comparison, the images are scaled so that thalami exhibit comparable sizes in the anteroposterior direction. The MR images were acquired with a resolution of 0.52 × 3 mm3 (left column) and 0.62 × 3 mm3 (middle column). In the bottom row, which is identical to the top row, note the following structures: Bold lines mark the lamella medialis (La.m), thin lines mark the border between the internal and external part of the nucleus dorso-oralis (D.o.i and D.o.e), dotted lines show the border between the internal parts of the nuclei dorso-oralis (D.o.i) and zentrolateralis intermedius (Z.im.i), dashed lines indicate the posterior part of external medullary lamina, arrows point to the centre médian (Ce), arrowheads indicate the mamillothalamic tract, paired arrowheads indicate the stria medullaris, and pairs of arrows indicate a myelinic sheet separating the nuclei lateropolaris (Lpo) and anteromedialis (A.m). Note the very similar contrast in the IR-TSE image (TI = 500 ms) and the T1 map.
The images in Fig 2 show axial sections through the thalamus 16, 13, 10, and 7 mm dorsal to the ACPC plane of the same subject as depicted in Fig 1 (recorded during a different session). The La.m can be clearly identified in the dorsal 3 sections, but it looks faded and weakly contoured in the most ventral section in the right image of Fig 2. The most probable reasons are intralaminar cell clusters and the larger lateromedial width of this lamina at more ventral levels.23 Only in the section 10 mm dorsal to the ACPC plane does the boundary between the D.o.i and Z.im.i appear as a well-defined edge. In the neighboring sections, gradual signal-intensity transitions, in an anteroposterior direction, of the lateral thalamus are discernible. These diffuse changes in signal intensity hamper the demarcation of distinct thalamic structures. At the present stage, we cannot definitively state whether partial voluming is the main reason or whether a smooth transition of the MR relevant tissue properties of neighboring thalamic compartments impedes the formation of a distinct boundary. Images of the same anatomic location for the 4 other measured subjects are shown in Fig 3. At the reduced in-plane resolution of 0.72 mm2 and a section thickness of 2 mm, the boundary between the D.o.i and Z.im.i, the boundary between the D.o.i and D.o.e, and the La.m can be assigned in a reliable manner in almost all cases. The subject in Fig 3A seems to have a relatively slim D.o.e. Also of note is the rather diffuse appearance of the D.o.i/Z.im.i boundary in the left hemisphere in Fig 3A, -C.

Axial MR images of the thalamus at different positions. Sections are located 16, 13, 10, and 7 mm dorsal to the ACPC plane (from left to right) and acquired with an IR-TSE sequence (TI = 480 ms and 0.52 × 3 mm3 resolution). In the bottom row, which is identical to the top row, the L.am is indicated by dashed lines.
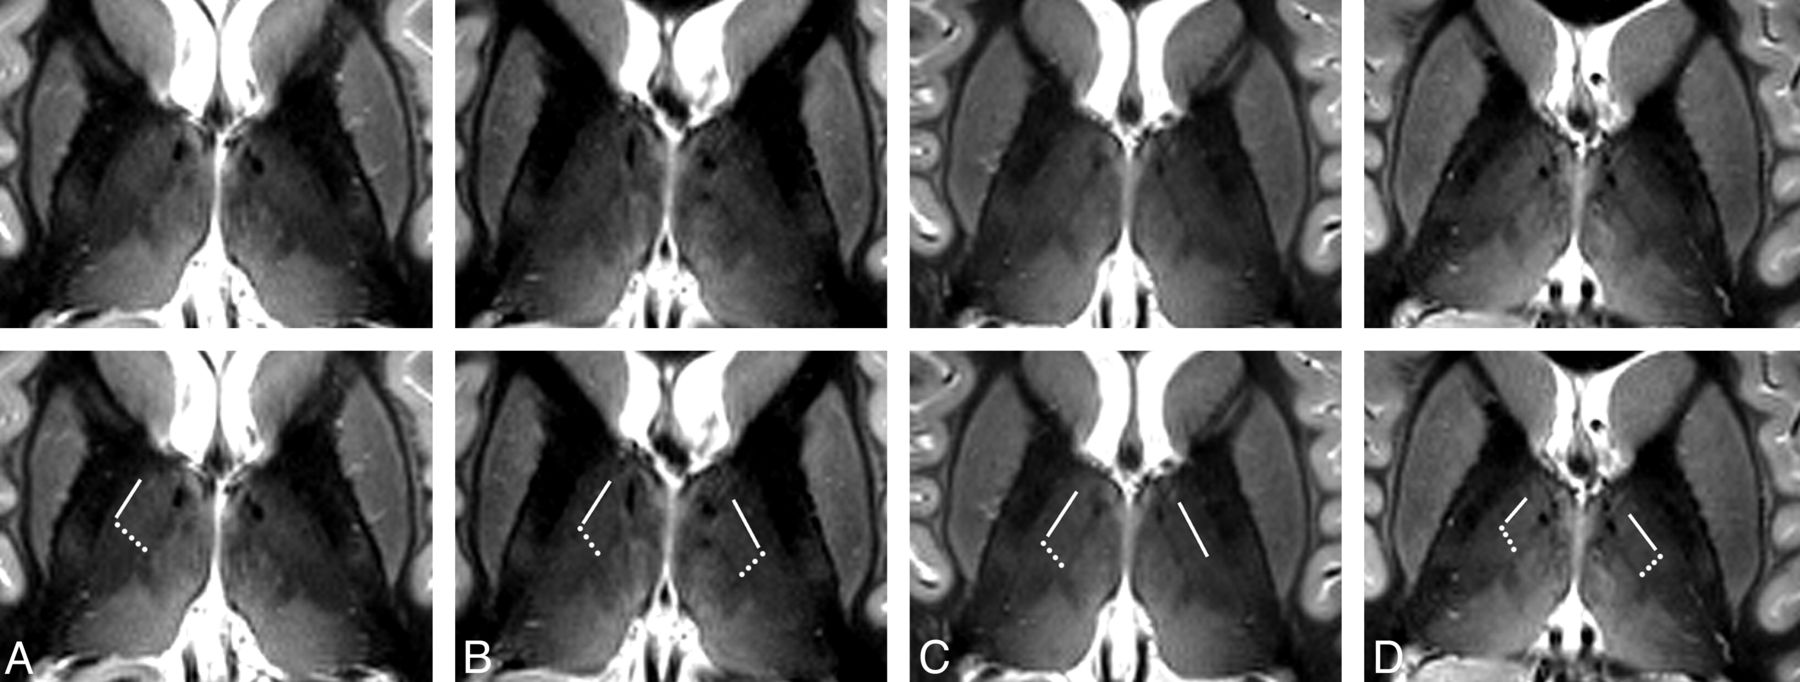
Axial MR images of different subjects. Axial sections through the thalamus in a plane approximately 10 mm dorsal to the ACPC plane of 4 different subjects (A–D) acquired with an IR-TSE sequence (TI = 500 ms and 0.72 × 2 mm3 resolution). In the bottom row, which is identical to the top row, lines mark the border between the anatomic subfields D.o.i and D.o.e and dotted lines show the border between the subfields D.o.i and Z.im.i. In the left hemispheres in A and C, diffuse-appearing boundaries are not marked. At this coarser in-plane resolution, the L.am appears more blurred than in Figs 1 and 2. Some images show blood flow artifacts in the medial thalamus (see also Fig 5).
Figure 4 shows the IR-TSE images of 2 of the subjects, acquired with TIs of 650 and 700 ms to substantiate that visualization of the D.o.e is definitely not the result of artifacts. The pronounced reversal in image intensity between the D.o.e and the internal capsule caused by different TIs proves that MR relaxation properties can be harnessed to delineate subfields of the nucleus dorso-oralis (D.o). Figure 5 shows side-by-side transversal IR-TSE and TSE images of the investigated section position. Despite the prominent vessels (arrows in Fig 5), there is hardly any contrast inside the lateral thalamus in the TSE image. In addition, the La.m and the centre médian are not visible in the TSE image. Due to a slightly different windowing of the IR-TSE image in Fig 5 compared with Fig 1, the corticospinal tract is unambiguously identified as the pale area in the posterior third quarter of the posterior limb of the internal capsule.24 This brightening, also conspicuous in the examples in Fig 3, is caused by longer T1 and T2 relaxation times of the large axons with thick myelin sheaths in the corticospinal tract. The On-line Table shows T1 and T2 times measured in 1 subject, along with On-line Fig 1 showing marked regions of interest. The applied phase-encoding in the anteroposterior direction is necessary for the removal of flow artifacts caused by CSF pulsation in the third ventricle. However, at the same time, it is the reason for occasionally observed bright spots in medial thalamic fields. These artifacts arise from branches of thalamic veins and are indicated by the arrowheads on the IR-TSE image of Fig 5.

Accentuation of the external part of the D.o.e. Axial sections through the thalamus in a plane approximately 10 mm dorsal to the ACPC plane of 2 different subjects acquired with an IR-TSE sequence (0.72 × 2 mm3 resolution) at different inversion times highlight the visualization of the external part of the dorso-oralis nucleus. The D.o.e is the elongated band between the arrow and the arrowhead. In the images with a TI of 650 ms (top row), the D.o.e exhibits intermediate intensity between the medially located more hyperintense D.o.i and the laterally located hypointense internal capsule. The appearance changes at a TI of 700 ms (bottom row). At this inversion time, the D.o.e appears as a hypointense band between the hyperintense D.o.i and internal capsule.

Comparison between IR-TSE (left column) and TSE (right column) images. The sections are located approximately 10 mm dorsal to the ACPC plane. The MR images were acquired with a resolution of 0.52 × 3 mm3 (IR-TSE, TI = 500 ms) and 0.52 × 2.5 mm3 (TSE). In the bottom row, which is identical to the top row, arrows point to vessels, and arrowheads, to bright spots. The latter are flow artifacts in the medial thalamus originating from branches of thalamic veins. Note the nearly complete lack of contrast inside the lateral group of thalamic nuclei, the very faint appearance of the external medullary lamina, and the pronounced appearance of vessels in the TSE image.
To understand why IR-TSE is beneficial compared with proton-density-weighted TSE imaging as a method of differentiating the D.o.i from the Z.im.i, we modeled the contrast behavior of the 2 applied MR sequences. The determined T1 times in the Z.im.i and D.o.i are 1.13 and 1.20 seconds, respectively. This difference is clearly visible in the T1 map of Fig 1. No signal difference is discernible in the T2 map (not shown). The graphs in Fig 6 show the calculated contrast (difference in signal intensity expressed in multiples of ρZ.im.i) between the Z.im.i and D.o.i versus the proton-density ratios ρD.o.i/ρZ.im.i for the IR-TSE sequence with a TI of 500 ms (solid lines) and for the TSE sequence (dashed lines). The contrast of the IR-TSE protocol is only moderately influenced by small changes of relative water content. On the other hand, the contrast of the TSE protocol is sensitive to slight changes of the proton-density ratio and even vanishes for ρD.o.i/ρZ.im.i close to 1.01. Thus, the lack of contrast between the nuclei D.o.i and Z.im.i in the TSE example of Fig 5 may suggest an approximately 1% higher proton density in the D.o.i compared with the Z.im.i.

MR contrast for IR-TSE and TSE imaging in thalamic subfields. The solid and the dashed lines show the calculated contrast between the nuclei Z.im.i and D.o.i versus the proton-density ratios ρD.o.i/ρZ.im.i for the IR-TSE and the TSE sequences, respectively. Note the relative low dependence of the IR-TSE contrast on variations of the proton-density ratio.
Discussion
The comparison of MR images with photographs and drawings of stereotactic atlases revealed that the Schaltenbrand and Wahren atlas21 seems to be the most suitable one. Its myelin-stained plates appear similar to the presented MR images with hypointense myelin-rich and more hyperintense myelin-poor tissues. Furthermore, the overlayable transparencies with drawn borders of the different thalamic compartments based on their cytoarchitecture notably facilitate anatomic assignment. The remarkable Morel atlas3 shows photographs of the variety of applied stainings only exemplarily. For image comparison and assignment, however, we rate camera lucida drawings less suitable than labeled photographs of stained sections. Unfortunately, the atlas of Mai et al22 presents only coronal views in high magnification with elaborate anatomic labeling but no sagittal and axial ones.
Despite the high degree of differentiation, the proposed assignment of areas with specific MR imaging contrast to anatomically described tissues remains somewhat ambiguous. One possible reason for discrepancies is the markedly different nature of the images under consideration. MR images integrate tissue properties over the applied section thickness and in-plane voxel resolution. In contrast to the presented MR images with 2- to 3-mm section thickness and 0.52-0.72 mm2 in-plane resolutions, photographs in brain atlases based on much thinner histologic sections show the distribution of different tissue compartments for the specified position with extremely high resolution. Consequently, the MR images are more similar to an average of neighboring sections in anatomic atlases than to the MR imaging equivalent of 1 specific section. This observation complicates anatomic assignment, especially if anatomy changes considerably over short distances in a direction orthogonal to the sections. One example is the nucleus zentrolateralis intermedius. Because it is a thin layer between the larger ventral and dorsal intermediate nuclei,1 we cannot exclude the observation that the field here assigned to Z.im.i belongs to one of the latter subfields. Nevertheless, we decided to adopt the labeling of the atlas photograph with the best correspondence to the MR image.
Besides the Schaltenbrand and Wahren atlas,21 the partition of the lateral thalamus parallel to the La.m and internal capsule appears even more conspicuous in the myelin staining in Fig 46 in the work of Hirai and Jones.25 Here the nuclei are named ventral lateral anterior (VLa) and ventral lateral posterior (VLp). For an elaborate analysis of which nuclei as defined by Hassler1 correspond to the nomenclature of Hirai and Jones and a critical view on Hassler's very large number of subdivisions, we refer to the tables and discussions given elsewhere.23,25⇓⇓–28
To successfully delineate the anatomic subfields in the lateral dorsal thalamus, T1-weighting is essential. Ultimately, an inversion recovery approach proved to be most suitable. The popularity of gradient echo imaging at 7T17⇓–19 is driven, to a high degree, by the possibility of covering the whole brain in a couple of minutes in compliance with specific absorption rate regulations. The applied IR-TSE sequence, with adiabatic inversion and full 180° refocussing pulses, allows us to measure only a small brain slab within legal specific absorption rate limits. The resulting 8–10 possible sections are sufficient to cover the region of interest. To measure the planned number of sections, occasionally, we were forced by the specific absorption rate limit to increase the TR from the nominal 3 seconds up to 3.3 seconds. Whereas the concomitant slight increase in contrast is welcomed, the prolonging of scanning time is disadvantageous. For IR-TSE imaging, the application of specific absorption rate–reducing techniques is possible yet untested for the presently proposed application.
Unlike the specific absorption rate, CSF pulsation is a serious obstacle. Sharp and contrast-rich images can be reliably acquired in dorsal thalamic regions where the rather small flow distortions are controllable by an appropriately chosen phase-encoding direction. However, in a manner strongly dependent on the subject, IR-TSE images around the ACPC plane can be heavily distorted by flow artifacts arising from the strong pulsatile CSF flow in the third ventricle. Often these cannot be suppressed sufficiently by the flow compensation options of the product TSE sequence. Moreover, flow-synchronous triggering is far from simple—if not impossible—for inversion recovery–prepared MR images. Currently, CSF pulsation artifacts are the reason why only images of the dorsal aspect of the thalamus are described here.
In this regard, 3 recent studies explicitly described the delineation of thalamic nuclei at 7T.17⇓–19 Abosch et al17 and Deistung et al18 presented promising images directly dorsal to the ACPC plane. Whereas Abosch et al did not show sections located more dorsally, images presented by Deistung et al showed no indication of parcellation in the dorsal aspect of the lateral thalamus. Also the La.m appears as a rather broad and diffuse band in the quantitative susceptibility map, notwithstanding the extremely high 0.43-mm3 spatial resolution of the underlying MR images. The white matter–nulled MPRAGE images of Tourdias et al19 explicitly indicated the nuclei ventral lateral anterior and posterior in the dorsal thalamus; however, they did not depict a structure similar to the D.o.i/Z.im.i boundary shown here. The coarser appearance of the La.m and of boundaries between the nuclei in their axial images is probably a consequence of the isotropic 1-mm3 resolution. All these points are not criticism. We just intended to underline the importance of determining the most suitable MR imaging approach to distinguish a particular thalamic nucleus from adjacent tissues.
Target definition is a core element in the complex process necessary for precise stereotactic implantation of brain electrodes. More precise localization of the supposed optimal target for therapeutic interventions cannot balance the impact of other sources of error such as image resolution or the mechanical accuracy of stereotactic systems. However, it reduces the total error of the procedure and thus promotes a more comprehensive understanding of therapeutic outcomes. In that regard, 2 recent studies29,30 investigated possible issues for neurosurgical targeting due to higher geometric distortions at 7T. Without dissent, they reported relatively small distortions in the central brain regions and concluded that targeting is feasible with 7T imaging. Without question, the assumed advantage of the clear visualization of intrathalamic anatomy for DBS planning has yet to be validated. We expect that among others, the La.m, the boundary between the nuclei D.o.i and Z.im.i, the boundary between the nuclei D.o.i and D.o.e, and the dorsal aspect of the centre médian are valuable landmarks. Because the boundary between the D.o.i and Z.im.i is located only a few millimeters dorsal to the anterior margin of the nucleus ventrointermedius internus, it has the potential to promote a more accurate DBS planning in patients with tremor. The successful transfer of the imaging protocol to patient scanning is strongly bound to an effective suppression of any head movement. A thorough comparison of the recorded images of the subject trained to keep his head very still, on the one hand, with the images of the other 4 subjects, on the other hand, suggests that residual head motion may explain the sometimes less compelling visualization of subfields in the lateral thalamus. Methods of mitigating these artifacts used in routine MR imaging investigations of patients with motor disorders, such as the use of sedative medications or MR imaging–compatible stereotactic head frames, are not, in our view, feasible options in a 7T context. Instead, prospective motion-correction technologies31 that do not require a tight fixation of the head present a promising alternative. Moreover, prospective correction of microscopic head motion has already been demonstrated to be fully compatible with 7T MR imaging.32
Conclusions
This feasibility study demonstrates that IR-TSE-based MR imaging at 7T can reveal a high degree of anatomic detail in the dorsal thalamus. Even if none of the here-visualized subfields are currently a relevant DBS target, the more general hope for the future is that precise visualization of well-defined internal thalamic landmarks will improve the definition of target point coordinates for stereotactically guided implantation of DBS electrodes.
Footnotes
Disclosures: Jürgen Voges—UNRELATED: Consultancy: Medtronic, Sapiens, Grants/Grants Pending: German Research Foundation,* Payment for Lectures (including service on Speakers Bureaus): Medtronic, St. Jude Medical. Lars Buentjen—UNRELATED: Payment for Lectures (including service on Speakers Bureaus): lectures on spinal cord stimulation (St. Jude Medical) and occipital nerve stimulation (St. Jude Medical), Payment for Development of Educational Presentations: See above, Travel/Accommodations/Meeting Expenses Unrelated to Activities Listed: Neuropathic Pain Congress (St. Jude Medical), workshops on spinal cord stimulation (St. Jude Medical, Boston Scientific, Medtronic). *Money paid to the institution.
This work was supported by the German Research Foundation (SFB 779, TP A2 and A11).
Indicates open access to non-subscribers at www.ajnr.org
REFERENCES
- Received December 9, 2013.
- Accepted after revision March 1, 2014.
- © 2014 by American Journal of Neuroradiology


