
Abstract
BACKGROUND AND PURPOSE: Dynamic contrast-enhanced MR imaging parameters can be biased by poor measurement of the vascular input function. We have compared the diagnostic accuracy of dynamic contrast-enhanced MR imaging by using a phase-derived vascular input function and “bookend” T1 measurements with DSC MR imaging for preoperative grading of astrocytomas.
MATERIALS AND METHODS: This prospective study included 48 patients with a new pathologic diagnosis of an astrocytoma. Preoperative MR imaging was performed at 3T, which included 2 injections of 5-mL gadobutrol for dynamic contrast-enhanced and DSC MR imaging. During dynamic contrast-enhanced MR imaging, both magnitude and phase images were acquired to estimate plasma volume obtained from phase-derived vascular input function (Vp_Φ) and volume transfer constant obtained from phase-derived vascular input function (Ktrans_Φ) as well as plasma volume obtained from magnitude-derived vascular input function (Vp_SI) and volume transfer constant obtained from magnitude-derived vascular input function (Ktrans_SI). From DSC MR imaging, corrected relative CBV was computed. Four ROIs were placed over the solid part of the tumor, and the highest value among the ROIs was recorded. A Mann-Whitney U test was used to test for difference between grades. Diagnostic accuracy was assessed by using receiver operating characteristic analysis.
RESULTS: Vp_ Φ and Ktrans_Φ values were lower for grade II compared with grade III astrocytomas (P < .05). Vp_SI and Ktrans_SI were not significantly different between grade II and grade III astrocytomas (P = .08–0.15). Relative CBV and dynamic contrast-enhanced MR imaging parameters except for Ktrans_SI were lower for grade III compared with grade IV (P ≤ .05). In differentiating low- and high-grade astrocytomas, we found no statistically significant difference in diagnostic accuracy between relative CBV and dynamic contrast-enhanced MR imaging parameters.
CONCLUSIONS: In the preoperative grading of astrocytomas, the diagnostic accuracy of dynamic contrast-enhanced MR imaging parameters is similar to that of relative CBV.
ABBREVIATIONS:
- DCE
- dynamic contrast-enhanced
- Ktrans_Φ
- volume transfer constant obtained from phase-derived vascular input function
- Ktrans_SI
- volume transfer constant obtained from magnitude-derived vascular input function
- rCBV
- relative CBV
- SI
- signal intensity
- VIF
- vascular input function
- Vp
- plasma volume
- Vp_Φ
- plasma volume obtained from phase-derived vascular input function
- Vp_SI
- plasma volume obtained from magnitude-derived vascular input function
Conventional MR imaging by using gadolinium contrast enhancement has been reported to have high sensitivity but low specificity in the preoperative grading of gliomas.1⇓⇓–4 The accuracy of conventional imaging might be improved by adding perfusion-weighted imaging. In clinical practice, DSC imaging remains the most commonly used perfusion technique and provides semiquantitative measurements such as relative CBV (rCBV), which can be influenced by the presence of susceptibility artifacts and contrast leakage from tumor vessels.5,6
Dynamic contrast-enhanced (DCE)-MR imaging is an alternate technique that can potentially provide absolute values of plasma volume (Vp) and a measurement of vascular permeability referred to as the volume transfer constant (Ktrans). This technique generally involves additional measurements and postprocessing steps. Measurements of precontrast tissue T1 and the vascular input function (VIF) in the brain are usually needed for proper quantification of DCE-MR imaging.7,8 Recently, some authors have suggested that measuring changes in the phase of the MR signal rather than its magnitude following gadolinium injection might provide a more accurate VIF because phase change inside the vessel is linearly related to the concentration of contrast agent.9⇓⇓–12 While measurement of precontrast tissue T1 is typically included in DCE-MR imaging studies, an additional measurement of tissue T1 postinjection (“bookend” method) might also improve the reproducibility of perfusion values in gliomas.13,14
To our knowledge, there have been few comparative studies between DCE and DSC imaging in patients with gliomas.15,16 The main objective of our study was to compare the diagnostic accuracy of DCE-MR imaging with DSC-MR imaging in the preoperative grading of astrocytomas at 3T by using a high-relaxivity agent. For DCE-MR imaging analysis, we performed 2 different methods: 1) using phase-derived VIF with bookend T1 measurements; and 2) using magnitude-derived VIF without T1 mapping.
Materials and Methods
Patient Population
All examinations were conducted in accordance with the guidelines for human research of The Ottawa Hospital, and written informed consent was obtained from all participating subjects. From March 1, 2011, to December 31, 2013, 70 consecutive patients presenting to our institution with a newly diagnosed brain lesion compatible with a glioma were asked to participate in this study. Following surgical resection or biopsy, histopathologic diagnosis was provided by an experienced neuropathologist by using the 2007 World Health Organization classification. Thirteen patients were excluded due to the absence of a histopathologic diagnosis or the presence of an alternate histopathologic diagnosis: no biopsy (n = 2), inconclusive biopsy (n = 1), oligodendrogliomas (n = 2), metastatic disease (n = 2), lymphomas (n = 2), glioneuronal tumors (n = 2), meningioma (n = 1), and neurosarcoidosis (n = 1). Nine patients with astrocytomas were subsequently excluded for technical reasons: inadequate bolus injection of contrast (n = 4), hemorrhage within glioblastoma causing extensive susceptibility artifacts (n = 3), dynamic acquisition not centered over the tumor (n = 1), and inadequate VIF for the DCE acquisition (n = 1).
MR Imaging Acquisition Protocols
Conventional MR imaging was performed on a 3T scanner (TimTrio; Siemens, Erlangen, Germany) by using axial T1 precontrast (TR = 280 ms, TE = 2.51 ms, thickness = 3 mm), axial FLAIR (TR = 9710 ms, TE = 93 ms, TI = 2580 ms, thickness = 3 mm), axial T2 (TR = 6910 ms, TE = 97 ms, thickness = 3 mm), axial T1 Volume Interpolated Breathhold Examination (VIBE) postcontrast (TR = 8.48 ms, TE = 3.21 ms, flip angle = 12°, thickness = 1 mm), and coronal T1 postcontrast (TR = 280 ms, TE = 2.51 ms, thickness = 4 mm) images.
DCE-MR imaging was performed by using a 3D FLASH sequence (TR = 6.5 ms, TE = 1.7/3.9 ms, flip angle = 30°, thickness = 5 mm, 18 sections, temporal resolution = 3.5 seconds, duration = 440 seconds). This pulse sequence generated phase images in addition to the standard magnitude images. Both before and after the dynamic scan, two 3D Volume Interpolated Breathhold Examination (VIBE) sequences with different flip angles (TR = 20 ms, TE = 1.22 ms, flip angle = 4° and 25°, thickness = 5 mm, 18 sections) were acquired, which enabled calculation of T1 maps.
In patients weighing between 50 and 100 kg, a fixed preloaded dose of 0.05 mmol (equivalent to 5 mL) of gadobutrol (Gadavist 1.0; Bayer Schering Pharma, Berlin, Germany) was injected at 2 mL/s for DCE imaging. This also served to decrease the T1 effects before a second injection of 0.05 mmol of contrast was performed for the DSC perfusion imaging. In patients weighing <50 kg or >100 kg, we used a dose of 0.05 mmol/kg.
The second injection of contrast agent was given 10 minutes after the first injection at 4 mL/s. DSC imaging was performed by using a T2* EPI gradient recalled-echo sequence (TR = 2380 ms, TE = 54 ms, flip angle = 90°, thickness = 5 mm, 18 sections, temporal resolution = 2.5 seconds, duration = 125 seconds).
Postprocessing of DCE Images
Two methods were used to process the DCE images.
Phase-Derived Vascular Input Function with Bookend T1 Correction.
Voxelwise maps of tissue contrast concentration with time were calculated by using pre- and post-DCE T1 maps combined with the tissue signal intensity-versus-time curve.14 Phase analysis was used to estimate the arterial input function from 1 section where the superior sagittal sinus ran approximately parallel with the main magnetic field and perpendicular to the section. A small ROI (2–4 pixels) was drawn at the center of the superior sagittal sinus, and the mean phase was measured as a function of time. The phase-versus-time curve was converted to a gadolinium-versus-time curve, which was then saved in a text file. This step was performed off-line by using in-house software written in IDL (Exelis Visual Information Solutions, Boulder, Colorado) and is described in previous articles.10,13 The gadolinium-versus-time curve was imported as the arterial input function in kinetic modeling analysis software (nordicICE software, Version 2; NordicNeuroLab, Bergen, Norway) for a voxel-by-voxel estimation of plasma volume obtained from the phase-derived vascular input function (Vp_Φ) and the volume transfer constant obtained from phase-derived vascular input function (Ktrans_Φ). Postprocessing parameters were the following: noise level = 0, spatial smoothing = off, vascular deconvolution = on, normalize kinetic parameters = on, auto-detect arterial input function tissue delay = on, hematocrit correction factor = 0.45.
Magnitude-Derived Vascular Input Function with No T1 Correction.
DCE magnitude images were processed directly in nordicICE to generate maps of plasma volume obtained from magnitude-derived vascular input function (Vp_SI) and volume transfer constant obtained from magnitude-derived vascular input function (Ktrans_SI). The signal intensity (SI) was converted to percentage change in signal intensity (relSI) by using the expression: relSI(t) = 100 × (S(t) − So)/So, where S is the SI at time t and So is the baseline SI. The relative change in 1/T1 was estimated from this relative change in signal intensity, which is assumed to be linearly related to 1/T1 changes. The VIF was selected from a small ROI placed in the superior sagittal sinus directly from the DCE images. Signal conversion was set as SI to relSI(%). Remaining postprocessing parameters were similar as for the analysis with phase-derived vascular input function and bookend T1 correction.
Postprocessing of DSC Images
DSC images were processed by using singular value decomposition and deconvolution as implemented in nordicICE. MR signal intensity was converted to a T2 relaxation rate. An automated algorithm selected the most suitable pixels for VIF in a manually defined ROI covering the middle cerebral artery contralateral to the tumor. The SI was converted to relative change in R2 (ie, R2* = 1/T2*) by using the standard expression: delR2(t) = −ln(S(t)/So)/TE, where S is the SI at time t and So is the baseline SI. Corrected rCBV maps were generated. Correction for leakage in rCBV calculations was done by using preinjection of contrast agent and linear fitting to estimate the T1 contamination caused by extravasation of contrast agent.5 Postprocessing parameters were set in nordicICE as the following: noise level = 0, spatial smoothing = min, temporal smoothing = min, signal conversion SI to delR2, vascular deconvolution = on, apply contrast agent leakage correction = checked, detect both T1 and T2 leakage values = checked.
Image Interpretation
Two fellowship-trained neuroradiologists blinded to the histopathologic diagnosis examined the structural images to determine the preoperative grade of the tumor. We used radiologic criteria described by Asari et al17 for grade II (nonenhancing mass, no central necrosis, absent or mild edema), grade III (enhancing mass, no central necrosis, mild or moderate edema), and grade IV gliomas (enhancing mass, with cyst or necrosis, moderate or severe edema). Axial T1-weighted postcontrast images were coregistered to the parametric maps. Because areas of highest values could vary between different parametric maps, a medical student traced 2 sets of ROIs: 1) 1 large “large tumor” ROI over the solid component of the tumor for the section where the tumor was largest (identical ROIs for all maps); and 2) 4 small “hot spot” ROIs (35 mm2) over the areas of highest values, which could vary in location between maps. For each parametric map, the mean pixel value inside each of the 5 ROIs was calculated. For the 4 small hot spot ROIs, the 3 ROIs with the smallest values were discarded. Thus, for each parametric map, we recorded 2 values: 1 large tumor value and 1 hot spot value. All ROIs were verified by a neuroradiologist to ensure that inadvertent placement on an adjacent vessel or on hemorrhage was avoided. For DSC images, corrected rCBV values in tumors were normalized to the contralateral white matter.
Statistical Analysis
All data were analyzed by using MedCalc for Windows (Version 12; MedCalc Software, Mariakerke, Belgium). There were 5 components to the statistical analysis: 1) calculation of sensitivity and specificity for each reader by using the conventional, nondynamic contrast-enhanced MR images to grade gliomas; 2) assessment of interreader reliability by using the κ statistic; 3) tests for differences in hot spot DSC- and DCE-derived parameters, according to grades by using Kruskal-Wallis and Mann-Whitney U tests; 4) assessment of the diagnostic accuracy for each parameter in grading gliomas by using receiver operating characteristic analysis; and 5) correlation analysis between large tumor DSC- and DCE-derived parameters by using a Spearman rank correlation coefficient.
Results
Participants
From March 2011 to December 2013, we prospectively recruited 70 patients with a mass suspicious for glioma. Forty-eight patients (25 men, 23 women) with a new histopathologic diagnosis of astrocytomas and adequate DCE and DSC images were included in the study. The mean age was 57 years (95% CI, 53–62 years). There were 9 patients with grade II astrocytomas, 11 patients with grade III (including 3 oligoastrocytomas), and 28 patients with grade IV. Thirty-two patients (5 grade II, 8 grade III, and 19 grade IV) received steroids before MR imaging. The median time between imaging and surgery was 6 days. Thirteen patients underwent a surgical biopsy (5 grade II, 3 grade III, and 5 grade IV), and 35 patients underwent a surgical resection.
Accuracy of Conventional Imaging for Distinguishing Low- from High-Grade Gliomas
For the differentiation of low- (grade II) and high-grade gliomas (grades III and IV), the sensitivity of contrast-enhanced MR imaging (95% for both readers) was higher than the specificity (56% for reader 1 and 67% for reader 2). The interreader agreement was moderate (weighted κ = 0.56; 95% CI, 0.37–0.75).
DSC- and DCE-Derived Parameters according to Tumor Grades
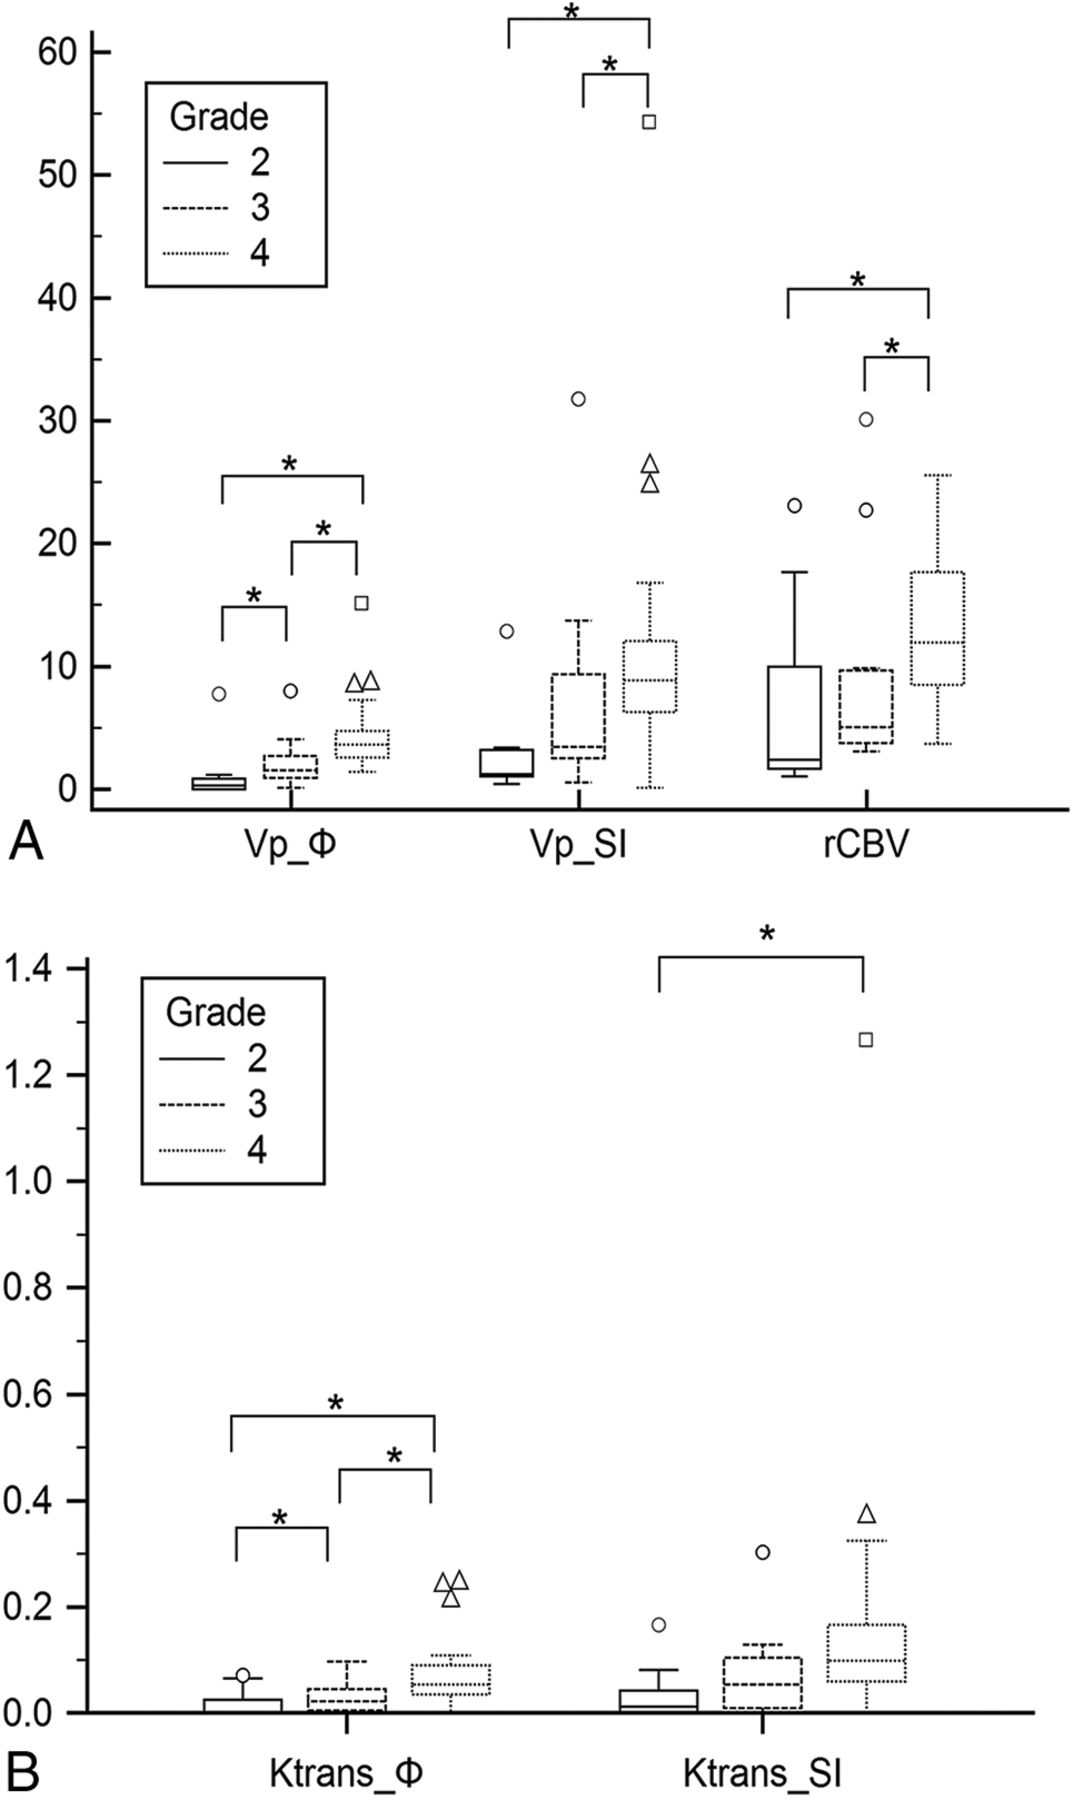
Tumor grade is a factor influencing DSC- and DCE-derived parameters according to the Kruskal-Wallis test of independent samples (P < .05). Post hoc pair-wise comparisons according to the Mann-Whitney U test showed that median Vp_Φ and Ktrans_Φ parameters were lower for grade II compared with grade III astrocytomas (P < .05, On-line Table, Figure 1). Median rCBV, Vp_SI, and Ktrans_SI values for grade II were not significantly different from those of grade III astrocytomas (P = .08, P = .15, and P = .11 respectively; On-line Table, Figure 1).

A, Boxplot graph of parameters Vp_Φ (milliliters/100 g), Vp_SI (milliliters/100 g), and rCBV (unitless) according to grades. B, Boxplot graph of parameters Ktrans_Φ (minute−1) and Ktrans_SI (minute−1) according to grades. The asterisk indicates P < .05.
Among grade III astrocytomas, median Vp_Φ, Ktrans_Φ, and Ktrans_SI values were lower for the 7 pure astrocytomas than for the 4 astrocytomas with an oligoastrocytic component (P < .05). No statistically significant difference was found for median rCBV and Vp_SI values between the 2 groups (P = .07).
When comparing grade III with grade IV astrocytomas, median Vp_Φ, Vp_SI, rCBV, and Ktrans_Φ values were significantly lower for grade III compared with grade IV (P < .05), while Ktrans_SI values were not significantly different between the 2 groups (P = .056).
Accuracy of DSC- and DCE-Derived Parameters for Distinguishing Astrocytoma Grades
In differentiating low- from high-grade astrocytomas, the accuracy of Vp_Φ, Vp_SI, and Ktrans_Φ (area under the curve = 0.88, 0.81, and 0.84, respectively) seems to be a higher than that of Ktrans_SI and rCBV (area under the curve = 0.77 and 0.78), but this did not reach a statistically significant difference (Table 1). When we excluded patients with grade III oligoastrocytomas, the accuracy of various parameters was not affected. In differentiating grade III from grade IV gliomas, there was no significant difference in the accuracy among parameters (Table 2). When we excluded patients with grade III oligoastrocytomas, the specificity of each parameter was increased.
Diagnostic accuracy of DSC- and DCE-derived parameters in differentiating high- and low-grade astrocytomas using hot spot ROIsa
Diagnostic accuracy of DSC- and DCE-derived parameters in differentiating between grade III and grade IV astrocytomas using hot spot ROIsa
Correlation Analysis between DSC- and DCE-Derived Parameters
There was a moderate correlation between rCBV and Vp_Φ mean values obtained from large tumor ROI (r = 0.54, P < .05, Table 3). There was a weaker correlation between rCBV and Vp_SI (r = 0.44, P < .05). There was a good correlation between Vp_Φ and Vp_SI (r = 0.77, P < .05) and between Ktrans Φ and Ktrans_SI (r = 0.82, P < .05).
Spearman coefficients of rank correlation (ρ) between DSC- and DCE-derived parameters obtained from identical large tumor ROIsa
Discussion
Conventional imaging is not always accurate in differentiating low- from high-grade gliomas, particularly in the presence of a nonenhancing or poorly enhancing tumor.
DSC and DCE perfusion imaging have been reported to help in the preoperative grading of gliomas. In the differentiation between low- (2) and high-grade (III and IV) astrocytomas and between grade III and IV astrocytomas, we have found that the diagnostic accuracies of DCE-derived Vp and Ktrans were similar to those of DSC-derived rCBV regardless of the choice of the VIF from magnitude or phase images. The diagnostic accuracies of DCE-derived parameters in this study were in the range of previously published data from 2 studies, 1 by using a hot spot method and 1 by using histogram analysis.13,18 The accuracy of DSC-derived rCBV in this study was also similar to that in previous studies using hot spot analysis.1,19
Using the bookend T1 mapping and phase-derived VIF, we also found that DCE-derived Vp and Ktrans were lower for grade II than for grade III astrocytomas. This difference could not be observed when we used a simpler DCE method by using MR signal intensity only. In our study, this difference was due to the presence of oligoastrocytomas among grade II tumors because no difference was found when comparing grade II with grade III pure astrocytomas. To our knowledge, the higher Ktrans and Vp values seen in oligoastrocytomas relative to pure astrocytomas have not been previously reported with DCE imaging. It is known that DSC-derived rCBV is higher for oligoastrocytic and oligodendroglial tumors than for grade II and III astrocytic tumors.20,21 This finding can be explained by the cortical location and the presence of a “chicken wire” type of vascularity in oligodendrogliomas.21
In our study, the correlation between DSC-derived rCBV and DCE-derived Vp was weak by using magnitude-derived VIF and moderate by using phase-derived VIF. It is possible that DCE-derived Vp and DSC-derived Vp are measuring slightly different vascular processes. Because we used a T2*-weighted DSC imaging, rCBV is probably more sensitive than Vp to the presence of large blood vessels in tumor. Further studies with histopathologic correlation are needed. Measurement bias is another possible factor that could explain a weak correlation between the 2 methods. For DSC-MR imaging, although we used a prebolus injection and performed a linear fitting to reduce T1 and residual T2 effects, this process might not completely overcome the decreased T2* effect from contrast leakage into the extravascular compartment. For DCE-MR imaging, Vp values have lower coefficients of variation by using the phase method with bookend T1 measurements than values obtained with magnitude-derived VIF. This could explain why a better correlation was found between Vp and CBV by using the phase method. Ludemann et al16 compared DCE- and DSC-derived CBV values in intra-axial tumors with no baseline T1 measurements and found a borderline correlation (P value between 0.1 and 0.05). Haroon and al15 found a good correlation (r = 0.667, P < .05) between DSC- and DCE-derived CBV in intra-axial tumors by using a method with baseline T1 calculation.
Both DSC and DCE techniques provide similar measurements of angiogenesis, which can help in the preoperative grading of gliomas. There are certain advantages and disadvantages for each technique. DSC perfusion imaging can provide semiquantitative measurements of rCBV from the whole brain with high temporal resolution and a short acquisition time (<2 minutes). The single-shot gradient-echo EPI sequence, which is the standard sequence for DSC perfusion, can have susceptibility artifacts at tissue interfaces. Three patients in our study had to be excluded due to the presence of significant intratumoral hemorrhage causing susceptibility artifacts and obscuring adjacent enhancing tumor tissue. Tumors located in the brain stem and near the skull base might also be obscured. Susceptibility artifacts are more important at 3T but can be reduced by the use of a spin-echo EPI sequence, which we did not use in our study. Another limitation is that rCBV is dependent on field strength, sequence parameters, and relaxivity of the contrast agent used.22,23 A preinjection of contrast is also desirable to decrease T1 effects that could arise from contrast extravasation and could cause an underestimation of rCBV.5
DCE imaging can provide absolute measurements of plasma volume and Ktrans, which could be useful as biomarkers for angiogenesis. However, it cannot provide the same spatial coverage and temporal resolution compared with DSC imaging. There is usually a compromise to be made between sufficient temporal resolution and adequate spatial coverage for DCE acquisition protocols. Another common limitation of DCE imaging is the difficulty in obtaining an accurate VIF. This limitation can be overcome by using phase images to derive the VIF.9⇓⇓⇓–13 Phase measurements are less biased by intensity changes from inflow and relaxation effects. Magnitude-derived vascular input functions can underestimate the contrast concentration measurement during the first pass (if >5 mmol/L), especially when a high-relaxivity agent is used.9
One limitation of our study is the estimation of the precontrast T1 map by using a variable flip angle technique with only 2 flip angles. This approach is sensitive to B1 variation and could introduce errors in the conversion of DCE signal to concentration. However, the estimation of both pre- and postcontrast T1 maps can reduce errors in the conversion of signal-to-contrast concentration.24 A modified look-locker inversion recovery technique would have improved T1 mapping (data not shown), but this sequence was not available at the beginning of our study. Another limitation of the study is the small sample size, which might not provide enough power to reveal a statistically significant difference in the diagnostic accuracies between DSC and DCE parameters in differentiating low- from high-grade gliomas. The initial sample size calculation for our study was based on the recruitment of 35 patients with high-grade and 15 patients with low-grade gliomas. However, we could only enroll 9 patients with biopsy-proved low-grade gliomas, decreasing the power of our study. A third limitation is the possibility of inaccurate histopathologic grading due to sampling error in the 13 patients who had a only biopsy and not a surgical resection.
Conclusions
In differentiating between low- and high-grade astrocytomas and grade III and IV astrocytomas, we found that DCE-derived Ktrans and Vp parameters have the same diagnostic accuracy as DSC-derived rCBV.
Acknowledgments
We acknowledge William Petrcich, MS, and Betty Anne Schwarz, MS, RN, who provided statistical and administrative support for this study.
Footnotes
Disclosures: Thanh Binh Nguyen—RELATED: Grant: Bayer HealthCare,* Comments: investigator-initiated research grant; Consulting Fee or Honorarium: Bayer HealthCare, Comments: for attendance of advisory panel; Support for Travel to Meetings for the Study or Other Purposes: Bayer HealthCare, Comments: reimbursement for travel expenses; UNRELATED: Grants/Grants Pending: Brain Tumour Foundation of Canada*; Payment for Development of Educational Presentations: Bayer HealthCare. Kirstin Perdrizet—RELATED: Grant: Mach-Gaensslen Research award, Comments: research award granted to me during the summer as an undergraduate research student. Kathryn Bezzina—RELATED: Grant: Mach-Gaensslen of Canada, Comments: 2013 grant recipient as part of Summer Studentship Program. Carlos H. Torres—RELATED: Bayer HealthCare,* Comments: researcher-initiated grant. Santanu Chakraborty—RELATED: Grant: Bayer HealthCare*; UNRELATED: Grants/Grants Pending: GE Healthcare.* Brandon Zanette—RELATED: Grant: Bayer HealthCare, Comments: Part of my graduate student stipend was paid for from an investigator-initiated research grant from Bayer HealthCare. *Money paid to the institution.
This work was supported by an investigator-initiated research grant from Bayer HealthCare, who did not have any input in the formulation of this paper.
Paper previously presented as an abstract at: American Society of Neuroradiology Annual Meeting and the Foundation of the ASNR Symposium, May 17–22, 2014; Montreal, Quebec, Canada.
REFERENCES
- Received November 14, 2014.
- Accepted after revision March 24, 2015.
- © 2015 by American Journal of Neuroradiology


Jump to section
Related Articles
Cited By...
- Structural and practical identifiability of contrast transport models for DCE-MRI
- Volumetric Measurement of Relative CBV Using T1-Perfusion-Weighted MRI with High Temporal Resolution Compared with Traditional T2*-Perfusion-Weighted MRI in Postoperative Patients with High-Grade Gliomas
- Blood-Brain Barrier Permeability in Patients With Reversible Cerebral Vasoconstriction Syndrome Assessed With Dynamic Contrast-Enhanced MRI
- Addition of Amide Proton Transfer Imaging to FDG-PET/CT Improves Diagnostic Accuracy in Glioma Grading: A Preliminary Study Using the Continuous Net Reclassification Analysis
- 3D Pseudocontinuous Arterial Spin-Labeling MR Imaging in the Preoperative Evaluation of Gliomas
- Discrimination between Glioma Grades II and III Using Dynamic Susceptibility Perfusion MRI: A Meta-Analysis
- Correlation of Tumor Immunohistochemistry with Dynamic Contrast-Enhanced and DSC-MRI Parameters in Patients with Gliomas