
Abstract
BACKGROUND AND PURPOSE: CSF volumes in the basal cistern and Sylvian fissure are increased in both idiopathic normal pressure hydrocephalus and Alzheimer disease, though the differences in these volumes in idiopathic normal pressure hydrocephalus and Alzheimer disease have not been well-described. Using CSF segmentation and volume quantification, we compared the distribution of CSF in idiopathic normal pressure hydrocephalus and Alzheimer disease.
MATERIALS AND METHODS: CSF volumes were extracted from T2-weighted 3D spin-echo sequences on 3T MR imaging and quantified semi-automatically. We compared the volumes and ratios of the ventricles and subarachnoid spaces after classification in 30 patients diagnosed with idiopathic normal pressure hydrocephalus, 10 with concurrent idiopathic normal pressure hydrocephalus and Alzheimer disease, 18 with Alzheimer disease, and 26 control subjects 60 years of age or older.
RESULTS: Brain to ventricle ratios at the anterior and posterior commissure levels and 3D volumetric convexity cistern to ventricle ratios were useful indices for the differential diagnosis of idiopathic normal pressure hydrocephalus or idiopathic normal pressure hydrocephalus with Alzheimer disease from Alzheimer disease, similar to the z-Evans index and callosal angle. The most distinctive characteristics of the CSF distribution in idiopathic normal pressure hydrocephalus were small convexity subarachnoid spaces and the large volume of the basal cistern and Sylvian fissure. The distribution of the subarachnoid spaces in the idiopathic normal pressure hydrocephalus with Alzheimer disease group was the most deformed among these 3 groups, though the mean ventricular volume of the idiopathic normal pressure hydrocephalus with Alzheimer disease group was intermediate between that of the idiopathic normal pressure hydrocephalus and Alzheimer disease groups.
CONCLUSIONS: The z-axial expansion of the lateral ventricle and compression of the brain just above the ventricle were the common findings in the parameters for differentiating idiopathic normal pressure hydrocephalus from Alzheimer disease.
ABBREVIATIONS:
- AC
- anterior commissure
- AD
- Alzheimer disease
- BVR
- brain to ventricle ratios
- CVR
- convexity cistern to ventricle ratio
- iNPH
- idiopathic normal pressure hydrocephalus
- PC
- posterior commissure
- SPACE
- sampling perfection with application-optimized contrasts by using different flip angle evolution
Idiopathic normal pressure hydrocephalus (iNPH) has been diagnosed with several highly sensitive radiologic findings since the evidence-based guidelines for the diagnosis and management of iNPH were announced.1⇓⇓⇓⇓⇓⇓⇓⇓⇓–11 Due to the expansion of the lateral ventricles toward the vertex, upward displacement of the superior parietal lobule and decrease of the subarachnoid space at part of the high parietal convexity area are specific morphologic features for iNPH, called “disproportionately enlarged subarachnoid-space hydrocephalus (DESH).”1 As an alternative to the Evans index, we recently proposed that the “z-Evans index,” which was defined as the maximum z-axial length of the frontal horns of the lateral ventricles to the maximum cranial z-axial length, was useful for iNPH diagnosis.12 iNPH occurs in the elderly population prone to many types of comorbidities including Alzheimer disease (AD).13⇓⇓⇓⇓⇓⇓⇓–21 Therefore, differential diagnosis between iNPH and AD with brain atrophy is important, though the quantitative rating system on MR imaging to distinguish iNPH from AD with brain atrophy has not yet been established, to our knowledge.
A new automated segmentation technique by using a simple threshold algorithm has been developed, taking advantage of the high sensitivity to detect CSF on the T2-weighted 3D spin-echo sampling perfection with application-optimized contrasts by using different flip angle evolution (SPACE) sequence.12,22⇓–24 The aim of the present study was to establish a novel representative characteristic of CSF volume and distribution, which can differentiate iNPH from AD.
Materials and Methods
Study Population
The study design and protocol were approved by the ethics committee for human research at our hospital. We have prospectively collected intracranial CSF volume data by using a T2-weighted 3D-SPACE sequence on 3T MR imaging since November 2013. Details of the clinical data collections, image acquisition, and segmentation and quantification of the ventricular and subarachnoid space were described in our prior publication.12 In brief, 112 participants underwent an MR imaging examination for CSF volume analysis after written informed consent. Of them, 82 patients underwent a CSF tap test, which consisted of removing ≥30 mL of CSF via a lumbar tap for evaluating the improvement in their symptoms. On the basis of the response to the CSF tap test, 40 patients were diagnosed with iNPH, 14 were diagnosed with secondary NPH that developed after subarachnoid hemorrhage or trauma, 3 were diagnosed with congenital/developmental etiology, and the responses of the other 25 patients were judged as negative to the CSF tap test. Patients diagnosed with secondary NPH or congenital/developmental etiology NPH were excluded from this study.
All patients were diagnosed with or without AD by neurologists on the basis of their symptoms, MR imaging, and SPECT, according to the updated recommendations from the National Institute on Aging–Alzheimer's Association workgroups.25 Ten of 40 patients diagnosed with iNPH had a comorbidity of AD, whereas 11 of 18 patients who had a history of AD underwent the CSF tap test and were judged as nonresponders and were not diagnosed with iNPH. Additionally, 26 participants 60 years of age or older were recruited as control subjects because they did not have any symptoms of short-stepped gait and/or cognitive impairment and were confirmed as not having ventriculomegaly, disproportionately enlarged subarachnoid space hydrocephalus, or fluid collection such as subdural hematoma on MR imaging. Some of them had small vascular lesions such as small unruptured intracranial aneurysms.
Measurement of CSF Volume and Linear Indices
All MR imaging examinations were performed with a 64-channel 3T MR imaging system (Magnetom Skyra; Siemens, Erlangen, Germany). The sagittal source images of T2-weighted 3D-SPACE were automatically processed to create 3D volume-rendering reconstruction and multiplanar reconstruction images by using an independent 3D volume analyzer workstation (SYNAPSE 3D; Fujifilm Medical Systems, Tokyo, Japan). Next, the ventricles and subarachnoid spaces were semi-automatically segmented. The subarachnoid spaces were divided into the upper and lower parts in a horizontal section on the anterior/posterior commissure plane at the level of the junction point of the vein of Galen and the straight sinus. In addition, the subarachnoid spaces were segmented in 3D into the following 4 parts: frontal convexity, parietal convexity, Sylvian fissure and basal cistern, and posterior fossa. The borderline between the frontal and parietal convexity–subarachnoid spaces was defined as the central sulcus.
Maximum widths of the lateral ventricles and brain substances just above the lateral ventricles were measured on the reference coronal planes at the anterior commissure (AC) and posterior commissure (PC), perpendicular to the anterior/posterior commissure plane (Fig 1). Brain to ventricle ratios (BVR) were calculated as the maximum width of the brain divided by the maximum width of the lateral ventricles at the anterior and posterior commissure levels, respectively. In addition, 3D volumetric convexity subarachnoid space to ventricle ratio-1 (CVR-1) was defined as the volume of the upper part of the subarachnoid space divided by the total ventricular volume, and CVR-2 was defined as the volume of the frontal and parietal convexity subarachnoid space divided by the total ventricular volume.
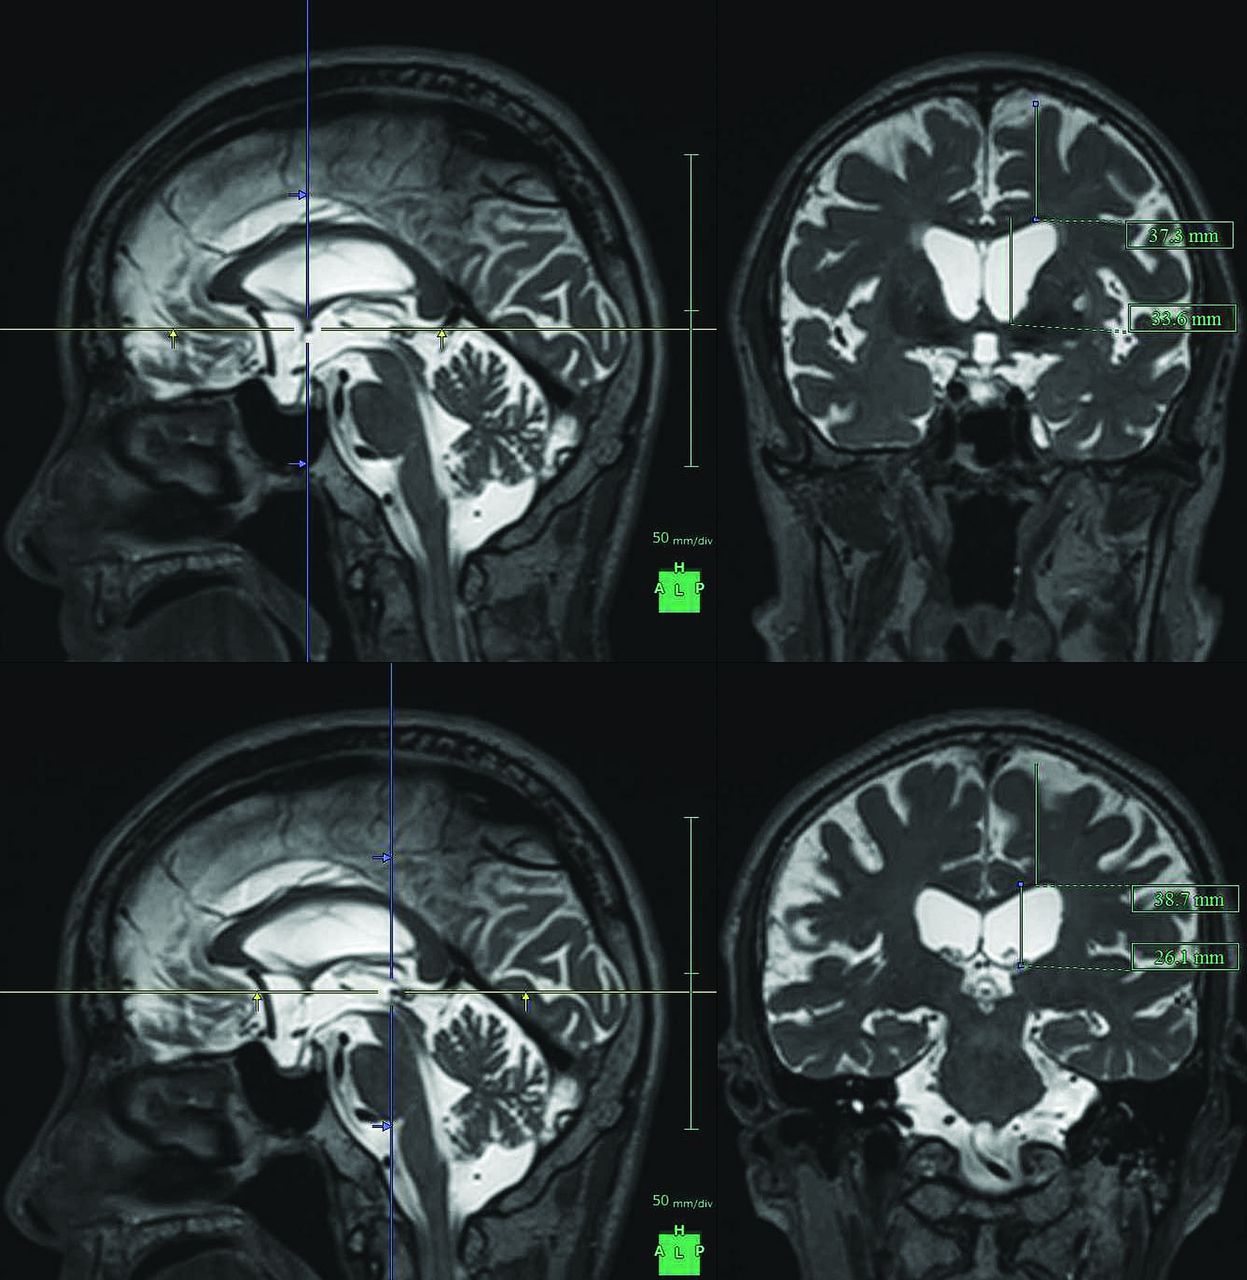
Maximum widths of the lateral ventricles and brain substances just above the lateral ventricles. The figures show the multiplanar reconstruction images on the T2-weighted 3D SPACE sequence. The crosses of the blue and yellow lines on the left figures indicate the points of the anterior commissure (upper) and posterior commissure (lower), and the right figures show the coronal planes at the blue lines of the left figures.
Statistical Analysis
Mean values and SDs for age and several parameters were calculated and compared among the 4 groups by the Mann-Whitney–Wilcoxon test. Sex difference was compared by the χ2 test. Statistical significance was assumed at P < .05. These parameters were calculated as the area under the receiver operating characteristic curves to evaluate the optimal thresholds to maximize the sum of sensitivities and specificities for differentiating iNPH or iNPH with AD from AD or control groups. All missing data were treated as deficit data that did not affect other variables. Statistical analysis was performed by using R software (Version 3.0.1; http://www.R-project.org).
Results
Clinical Characteristics
Eighty-four patients (mean age, 77.2 ± 6.8 years; range, 62–89 years; 49 men, 35 women) met our inclusion criteria. Among them, 30 patients were categorized into the iNPH group; 10, into the iNPH with AD group; 18, into the AD group; and 26, into the control group. The mean ages were not statistically different among the 4 groups (Table 1). The mean values of the z-Evans index and callosal angle in the iNPH or iNPH with AD group were significantly different from those in the AD group, whereas those of the Evans index were not significantly different (Table 2). The area under the receiver operating characteristic curves of the z-Evans index, callosal angle, and Evans index for distinguishing iNPH from AD were 0.769, 0.753, and 0.647, respectively. The mean widths of the ventricles at the AC and PC levels in the iNPH or iNPH with AD group were significantly enlarged concurrent with the thinning of the brain parenchyma, compared with those in the AD or control group. However, the widths of the ventricles and the brain substances just above the ventricles at the anterior and posterior commissure levels in the iNPH with AD and AD groups ranged between those in the iNPH and control groups (On-line Figure). The widths of the ventricles were significantly associated with the widths of the brain substances just above the ventricles at the anterior and posterior commissure levels, respectively. Therefore, we checked the distribution of BVR at the anterior and posterior commissure levels. The scatter diagrams in Fig 2 reveal that the BVR at the AC level had a complete linear association with the BVR at the PC level. Furthermore, the receiver operating characteristic curves revealed that both BVR at the AC and PC levels were useful indices for the differential diagnosis of iNPH or iNPH with AD from AD (Fig 2).
Clinical characteristics of the study population
Mean values and SDs for measurements
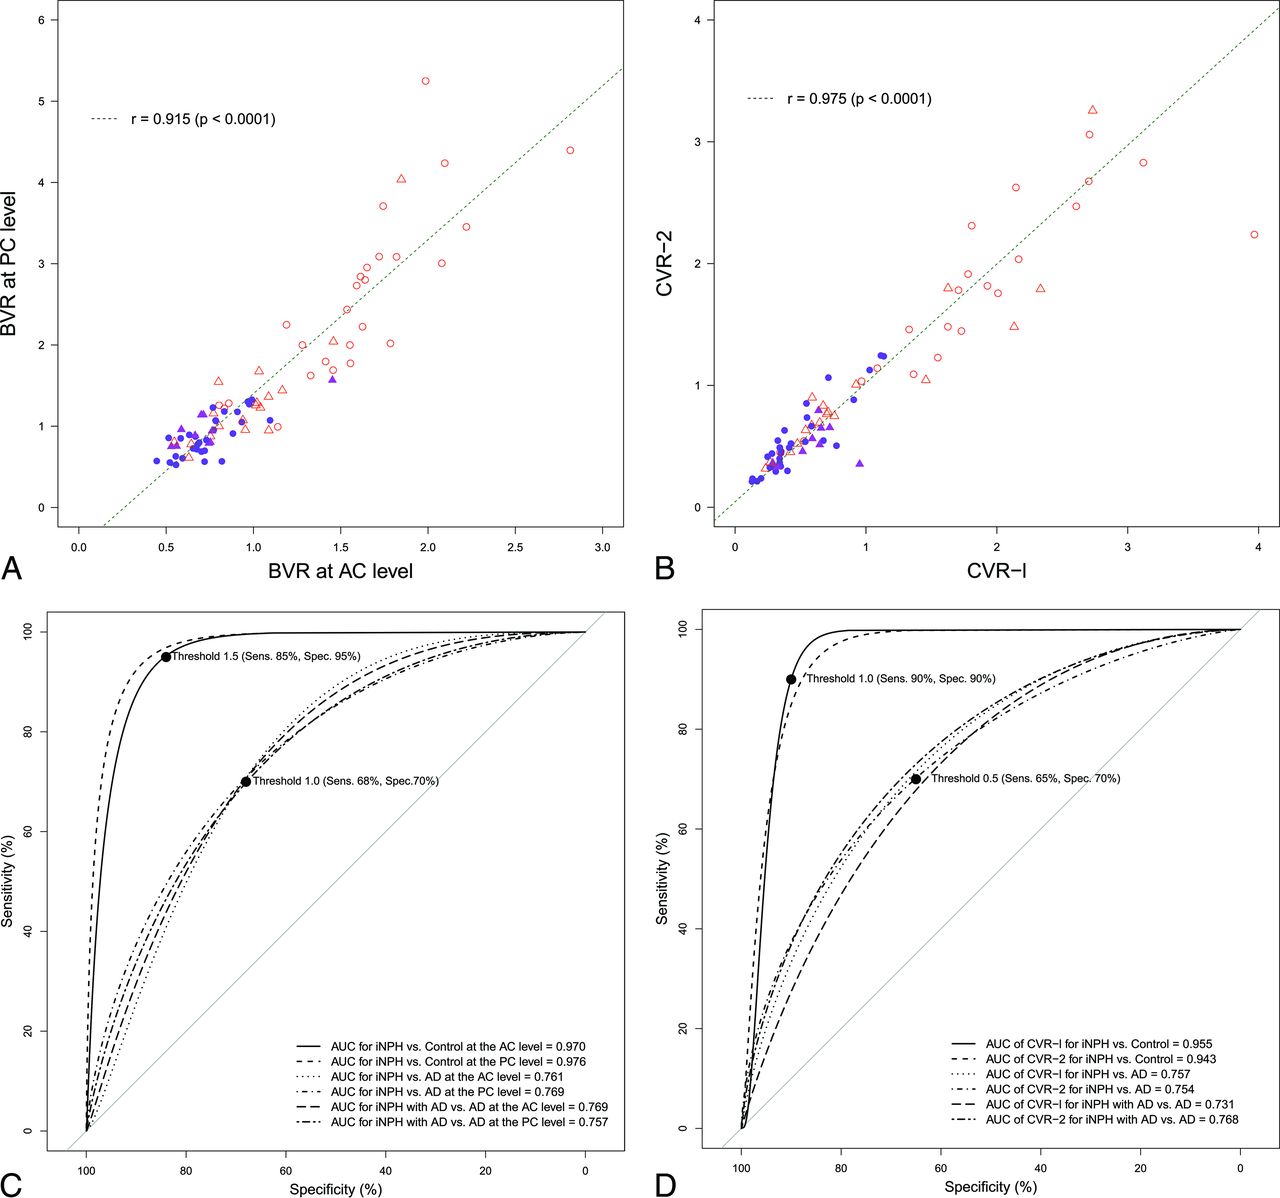
Scatterplots and receiver operating characteristic curves for the differential diagnosis of idiopathic normal pressure hydrocephalus and Alzheimer disease. The left upper diagram (A) shows the scatterplot and linear regression for the correlation between the BVR at the anterior level (x-axis) and those at the posterior commissure level (y-axis). The right upper diagram (B) shows the scatterplot of the 3D volumetric convexity subarachnoid space to ventricle ratio-1 (CVR-1) and CVR-2. The purple circle indicates iNPH, the purple triangle indicates iNPH concurrent with Alzheimer disease, the open red triangle indicates AD, and the open red circle indicates control. The lower diagram shows the receiver operating characteristic graph curves of BVR (left, C), CVR-1, and CVR-2 (right, D) for the differential diagnosis of iNPH or iNPH with AD from AD or controls. The x-axis shows specificity, and the y-axis shows sensitivity. The black marks indicate the point of the maximum area under the receiver operating characteristic curve and optimal thresholds (sensitivity and specificity). The maximum areas under the receiver operating characteristic curves for each comparison are displayed in the lower graph.
Volumetric Comparison
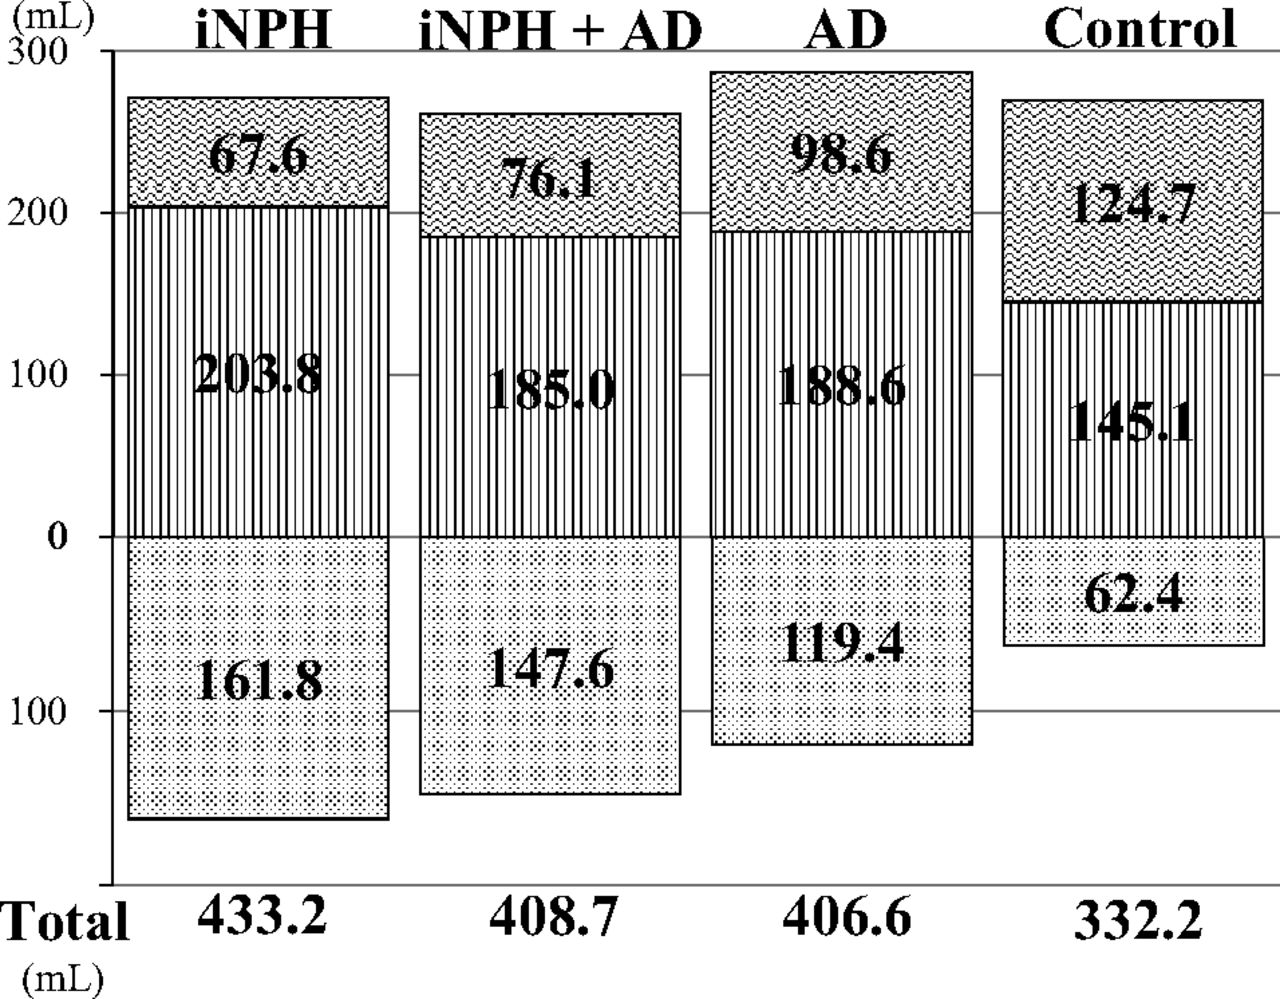
The total ventricle size in the iNPH group was the largest among the 4 groups, whereas the mean volume of the upper part of the total subarachnoid spaces was the smallest (Fig 3). The mean volumes of the total intracranial CSF spaces in the iNPH with AD and AD groups were almost the same (408.7 and 406.6 mL), but the CSF distribution was quite different between these 2 groups. Although the mean volumes of the total subarachnoid spaces were not significantly different among the 4 groups, the distribution of the 4 segmented subarachnoid spaces was notably different, as shown in Fig 4. The most distinct characteristics of the CSF distribution in the iNPH and iNPH with AD groups were the significant small volumes of the frontal and parietal convexity subarachnoid spaces and the upper part of the subarachnoid spaces, compared with the AD group. Conversely, the basal cistern and Sylvian fissure in the iNPH, iNPH with AD, and AD groups had similar mean volumes that were significantly larger (>30 mL) than those in the control group. Therefore, we evaluated the distribution of the CVR-1 and CVR-2 as combined 3D volumetric parameters (Fig 2). The areas under the receiver operating characteristic curve and the sensitivities and specificities of the CVR-1 and CVR-2 for the differential diagnosis of iNPH or iNPH with AD from AD or controls were similar to those of the BVR at the AC and PC levels.

Mean volumes of the total ventricle and total subarachnoid space. The mean volumes of the total ventricle are displayed in a downward direction (dotted pattern). The mean volumes of the total subarachnoid spaces are displayed after division of the upper (vertical striped pattern) and lower parts (wave pattern) in a horizontal section on the anterior/posterior commissure plane at the level of the junction point of the vein of Galen and straight sinus.
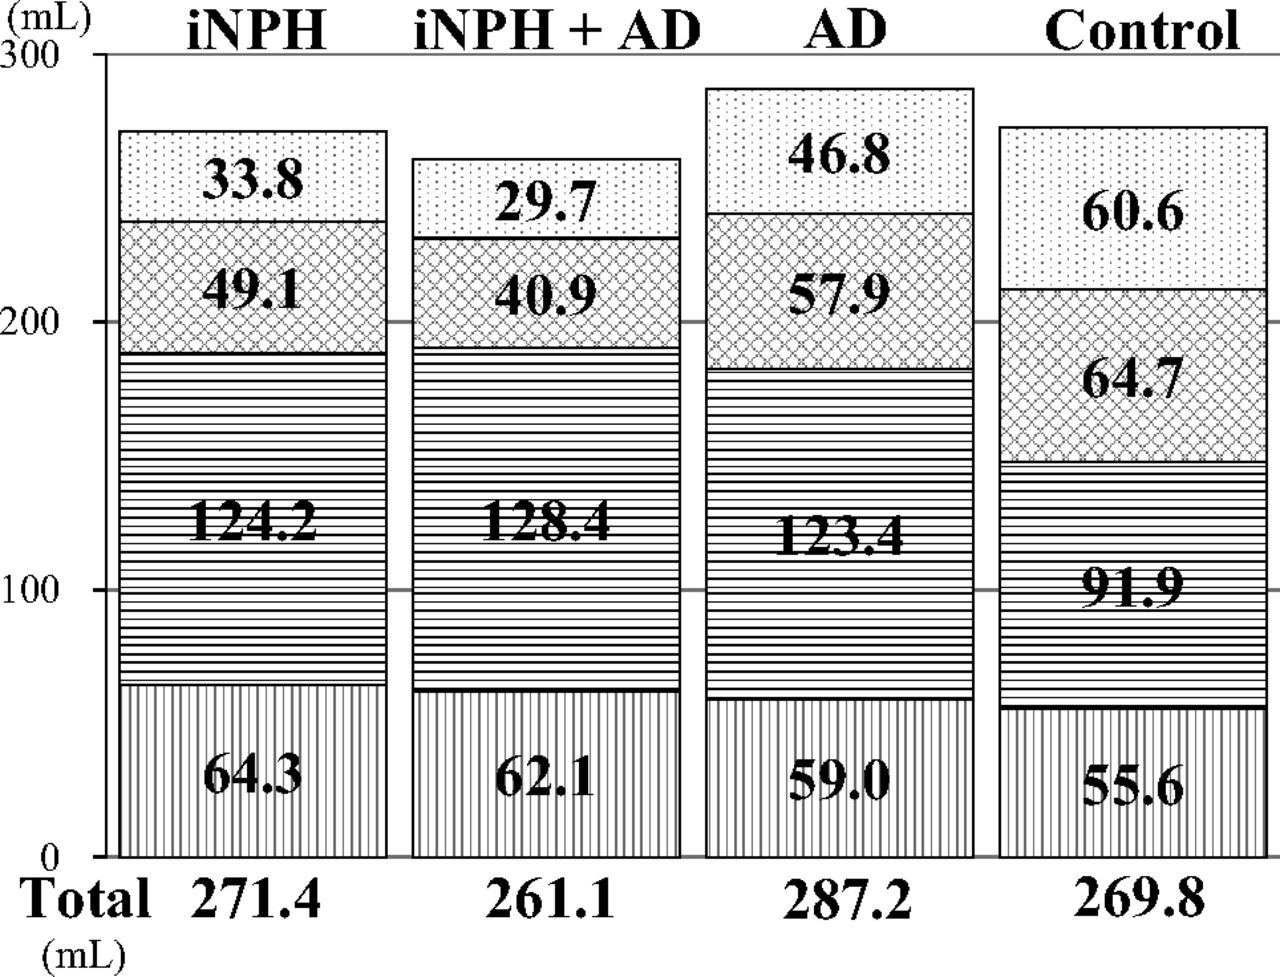
The mean volumes of the segmented parts of the subarachnoid spaces. The vertical-striped pattern indicates the subarachnoid space in the posterior fossa. The horizontal-striped pattern indicates the subarachnoid space in the basal cistern and Sylvian fissure, the checked pattern indicates the subarachnoid space in the frontal convexity subarachnoid space, and the dotted pattern indicates the subarachnoid space in the parietal convexity subarachnoid space.
Discussion
This study has shown that there is a significant difference in the ventricular size and distribution patterns of the subarachnoid spaces in iNPH versus AD. Patients with iNPH had enlarged ventricles and decreased convexity subarachnoid spaces compared with those with AD. Previous volumetric analyses had reported that the combined parameters of ventricular size and cortical thickness or high parietal CSF spaces more clearly distinguished iNPH from AD rather than a single parameter.5,7,10,11 Therefore, we checked the CVR-1 and CVR-2, as combined 3D volumetric parameters, which were similar to the area under the receiver operating characteristic curves for distinguishing iNPH from AD as previously reported.7,10 However, the volumetric analysis is difficult to perform in routine clinical use because it is time-consuming and involves complex 3D imaging techniques. Therefore, we have provided the BVR at the anterior and posterior commissure levels as novel combined 2D parameters. We checked these at the 2 points because there was no previous study to evaluate whether the anterior or the posterior brain was strongly compressed by the lateral ventricles in patients with iNPH.
This study revealed that the areas under the receiver operating characteristic curve and the threshold of the BVR at the AC level for distinguishing iNPH from AD were equal to those at the PC level. Therefore, we concluded that the brain compression due to enlarged ventricles in patients with iNPH was similar at the anterior and posterior parts of the brain. However, the volumes in the parietal convexity subarachnoid spaces were smaller than those of the frontal convexity subarachnoid spaces in iNPH or iNPH concurrent with AD. We confirmed that the z-Evans index and callosal angle were also useful single parameters, which had an accuracy equal to that of the combined parameters such as the CVRs and BVR, for the differential diagnosis of iNPH or iNPH concurrent with AD from AD.
AD is known to be the most common comorbidity in patients with iNPH in the pathogenesis of CSF stagnation13,14,17⇓⇓⇓–21 that might cause an obstacle to clearance of neurotoxic molecules such as amyloid-β peptide or tau.26⇓⇓–29 Nevertheless, previous studies of quantitative CSF measurements for the differential diagnosis of NPH excluded the patients diagnosed with concurrent NPH and AD from volumetric analysis. Therefore, a question could be raised about how the ventricular size or distribution of the subarachnoid spaces in concurrent cases with iNPH and AD was comparable with that in a pure iNPH or AD case. Thus, the cases with concurrent iNPH and AD had the largest volume of the basal cistern and Sylvian fissure and the smallest volume of the frontal and parietal convexity subarachnoid spaces among the 3 groups, though their ventricular volume was intermediate between that in iNPH and AD groups. These findings help in understanding the cause and process of concurrent expansion of the ventricles and basal cistern and Sylvian fissure in iNPH. Our results support the view that CSF moves freely and rapidly between ventricles and cisterns. One animal model provided evidence concerning a novel CSF pathway via the choroidal fissure between the ambient cistern and the temporal horn of the lateral ventricles, besides the direct traditional CSF pathway via the foramina of the fourth ventricle.30
Our study had some limitations. First, we used semi-automatic threshold-based segmentation methods by using a T2-weighted sequence. The T2-weighted sequence has an advantage of high-signal intensity for CSF analysis, instead of relatively poor contrast between gray matter and white matter. Conversely, voxel-based morphometry by using a T1-weighted sequence and statistical parametric mapping technique is needed for spatial normalization as a first step. However, ventricular size in iNPH would be too large and the distribution of the subarachnoid spaces would be too different for normalization by using templates of the standard brain atlas. Second, AD diagnosis was not confirmed pathologically by brain biopsy in this study. The prevalence of Alzheimer pathology at biopsy in patients with iNPH was reported higher than the prevalence in patients clinically diagnosed with AD.13,14,18⇓–20 Additional information about CSF biomarkers or amyloid imaging could increase the diagnostic accuracy of AD.15,27,28 In addition, the present results might pave the way for the investigation of the pathophysiologic mechanisms of the development of iNPH frequently concurrent with AD.
Conclusions
This study revealed that CVR-1, CVR-2, and BVR at the AC and PC levels were useful indices for the differential diagnosis of iNPH from AD, similar to z-Evans index and callosal angle. The common finding in these parameters was the z-axial expansion of the bilateral ventricles. Furthermore, the distribution of the subarachnoid spaces in the iNPH concurrent with AD group was the most different from that in controls, compared with iNPH or AD. These novel findings may contribute to future studies on the mechanisms underlying the concurrent progression of iNPH and AD.
Acknowledgments
We thank the radiology staff of the Rakuwakai Otowa Hospital.
Footnotes
Disclosures: Masatsune Ishikawa—UNRELATED: Grants/Grants Pending: Japan's Ministry of Health, Labour and Welfare, Comments: Normal Pressure Hydrocephalus Center; Consulting Fee or Honorarium: Johnson and Johnson, Medtronic, Nihon-Medi-Physics, Comments: Honoraria as a speaker at seminars.
Drs Yamada and Ishikawa have made substantial contributions to the intellectual content of the article, have approved the final manuscript, and agree with submission to this journal. Dr Yamada is the corresponding author for this study and the principal investigator. He is responsible for data management, accuracy of statistical analysis, conduct of the research, and drafting of the manuscript.
REFERENCES
- Received November 9, 2015.
- Accepted after revision December 7, 2015.
- © 2016 by American Journal of Neuroradiology


Jump to section
Related Articles
Cited By...
- CSF circulation and dispersion yield rapid clearance from intracranial compartments
- Variability of Normal Pressure Hydrocephalus Imaging Biomarkers with Respect to Section Plane Angulation: How Wrong a Radiologist Can Be?
- Quantification of Oscillatory Shear Stress from Reciprocating CSF Motion on 4D Flow Imaging