Abstract
BACKGROUND AND PURPOSE: Hyperattenuated cerebral areas on postinterventional CT are a common finding after endovascular stroke treatment. There is uncertainty about the extent to which these hyperattenuated areas correspond to hemorrhage or contrast agent that extravasated into infarcted parenchyma during angiography. We evaluated whether it is possible to distinguish contrast extravasation from blood on MR imaging.
MATERIALS AND METHODS: We examined the influence of iodinated contrast agents on T1, T2, and T2* and magnetic susceptibility in a phantom model and an ex vivo animal model. We determined T1, T2, and T2* relaxation times and magnetic susceptibility of iopamidol and iopromide in dilutions of 1:1; 1:2; 1:4; 1:10; and 1:100 with physiologic saline solution. We then examined the appearance of intracerebral iopamidol on MR imaging in an ex vivo animal model. To this end, we injected iopamidol into the brain of a deceased swine.
RESULTS: Iopamidol and iopromide cause a negative susceptibility shift and T1, T2, and T2* shortening. The effects, however, become very small in dilutions of 1:10 and higher. Undiluted iopamidol, injected directly into the brain parenchyma, did not cause visually distinctive signal changes on T1-weighted spin-echo, T2-weighted turbo spin-echo, and T2*-weighted gradient recalled-echo imaging.
CONCLUSIONS: It is unlikely that iodinated contrast agents extravasated into infarcted brain parenchyma cause signal changes that mimic hemorrhage on T1WI, T2WI, and T2*WI. Our results imply that extravasated contrast agents can be distinguished from hemorrhage on MR imaging.
ABBREVIATIONS:
- GRE
- gradient recalled-echo
- SE
- spin-echo
Hyperattenuated cerebral areas appear on non-contrast-enhanced CT performed shortly after neurointerventional stroke treatment in up to 86% of cases (On-line Fig 1).1 These postinterventional cerebral hyperattenuations resemble parenchymal hemorrhage but are not space-occupying. There is uncertainty about the true nature of postinterventional cerebral hyperattenuation, specifically the extent to which postinterventional cerebral hyperattenuations correspond to hemorrhage or extravasation of iodinated contrast agent into infarcted parenchyma.1⇓⇓–4
In theory, hemorrhage can be distinguished from iodinated contrast agents via MR imaging, given that blood degradation products are paramagnetic and cause specific changes on T2WI and T2*WI, whereas iodine is diamagnetic. However, it has been shown in phantom models that at a field strength of 1.5T, side chains of iodinated contrast agents cause T1 and T2 shortening, which theoretically may mimic the imaging characteristics of intracellular methemoglobin present in early subacute intracerebral hemorrhage.5,6 Furthermore, the influence of iodinated contrast agents on susceptibility and T2*WI sequences, which are commonly used in hemorrhage diagnosis, has not been investigated yet, to our knowledge. Hence, we examined the influence of 2 common iodinated contrast agents on magnetic susceptibility and T1, T2, and T2* relaxation in a phantom model and an ex vivo animal model to elucidate whether iodinated contrast agents can be distinguished from blood on MR imaging.
Materials and Methods
Phantom Model
We determined relaxation times (T1, T2, and T2*) of undiluted and diluted iopamidol (300 mg/mL, Imeron; Bracco, Milan, Italy) and iopromide (Ultravist 300 mg/mL; Bayer HealthCare, Berlin, Germany). Dilutions in physiologic saline solution of 1:2, 1:4, 1:10, and 1:100 were used, with iodine concentrations in postinterventional cerebral hyperattenuations expected to be in the lower range of our tested concentrations. An additional probe containing physiologic saline was measured as a reference (On-line Fig 2). The phantom experiments were conducted on MR imaging scanners with field strengths of 1.5T (Magnetom Symphony; Siemens, Erlangen, Germany) and 3T (Magnetom Trio; Siemens).
At 1.5T, a 2-point method based on a standard multisection multiecho gradient recalled-echo (GRE) MR imaging sequence was used for estimation of the T1 relaxation time.7 For mapping of the T2 decay constant, we used a turbo spin-echo sequence with a multiecho acquisition. At 3T, a high-accuracy Look-Locker type T1 mapping sequence (T1 mapping with partial inversion recovery) was used.8 T2 mapping was performed by using a multiecho spin-echo sequence; T2* decay was monitored with a multiecho gradient-echo sequence at both field strengths.
To estimate the magnetic susceptibility of the contrast agents, we measured the test vials with concentrations of 1:1, 1:2, 1:4, and 1:10 in a custom-built cylindric phantom, with the tubes embedded in distilled water and oriented parallel to the magnetic field. The field distribution was estimated on the basis of the phase data of a multiecho gradient-echo acquisition (TR = 60 ms, TE1 = 3 ms, ΔTE = 4 ms [8 echoes], flip angle = 14°, 1-mm isotropic resolution) on a 3T scanner. The processing of the phase data included threshold-based and manual masking, unwrapping and linear regression in a time domain, and background field correction with in-house software.9 The susceptibility distribution inside the tube, χ, is assumed to be constant and can hence be estimated by a single-value minimization of the difference between the measured field and the field generated by dipole convolution:
 The difference was evaluated in a region, mw, surrounding the test tube, which was distinctly smaller than the phantom to avoid effects from imperfect background field removal in the outer regions.
For visual assessment of signal changes, 2 neuroradiologists (O.N., S.D.), blinded to the sequences, compared the signal intensity of every tube containing iodinated contrast agent with the signal intensity of saline solution (isointense, hypointense, hyperintense) in randomized order by using the following clinical sequences—a 1.5T scanner: T1WI spin-echo (SE) (TR, 350 ms; TE, 7.8 ms); T2WI TSE (TR, 5350 ms; TE, 120 ms); and T2*WI GRE (TR, 326.2 ms; TE, 13.8 ms); a 3T scanner: T1WI SE (TR, 600 ms; TE, 8.7 ms); T2WI TSE (TR, 4800 ms; TE, 05 ms); and T2*WI GRE (TR, 1100 ms; TE, 19.9 ms). Agreement between observers was evaluated by using a Spearman rank correlation coefficient test.
Ex Vivo Animal Model
We examined the visual aspects of intracerebral iopamidol on MR imaging in an ex vivo animal model. Because the porcine brain is resistant to ischemic stroke, the brain of a recently deceased swine served as a model for infarcted brain parenchyma. Five milliliters of iopamidol was injected into the brain parenchyma of a recently deceased male Landrace swine (weight, 60 kg) via cranial trepanation. CT and MR imaging were performed immediately before and after injection of iopamidol into the brain parenchyma. Injection of iopamidol took place 60 minutes after cardiac arrest. CT and MR imaging were performed 1 minute and 9 minutes, respectively, after injection of iopamidol. CT scans were obtained on a 16-section CT scanner (Somatom Definition AS; Siemens). CT scans were acquired by using our standard spiral brain sequence (120 kV, 248 mA, H30 kernel) and were evaluated in the axial plane after multiplanar reconstruction (3-mm sections). MR imaging was performed by using a 1.5T MR imaging scanner (Intera; Philips Healthcare, Best, Netherlands). MR imaging comprised axial T1-weighted SE (TR, 350 ms; TE, 7.8 ms), T2-weighted TSE (TR, 5350 ms; TE, 120 ms), and T2*-weighted GRE (TR, 326.2 ms; TE, 13.8 ms) imaging with a section thickness of 3 mm. Two independent neuroradiologists evaluated all sections for visibility of iopamidol by using a tripartite visibility score (no visibility, poor visibility, good visibility). Agreement between observers was evaluated by using a Spearman rank correlation coefficient test.
Results
Phantom Model
Iopamidol and iopromide cause T1, T2, and T2* shortening (On-line Fig 2). Detailed results of our relaxometry measurements are summarized in the On-line Table. Both contrast agents show very similar negative magnetic susceptibility shifts, which are reflected by comparable values of −0.74 ppm for iopamidol and −0.76 ppm for iopromide as estimated by linear regression (On-line Fig 3).
Shortening effects of both contrast agents on T1-weighted SE imaging were visible in all dilutions regardless of field strength (total agreement; Spearman ρ not calculable). However, this effect was subtle in dilutions of 1:4 and higher. Shortening effects of both contrast agents on T2-weighted TSE imaging were visible in dilutions of up to 1:4, while dilutions of 1:10 and higher were not distinguishable from physiologic saline solution, regardless of field strength (total agreement; Spearman ρ = 1.0; P < .001). T2* shortening was not visible on T2*-weighted GRE imaging regardless of field strength (total agreement; Spearman ρ not calculable).
Ex Vivo Animal Model
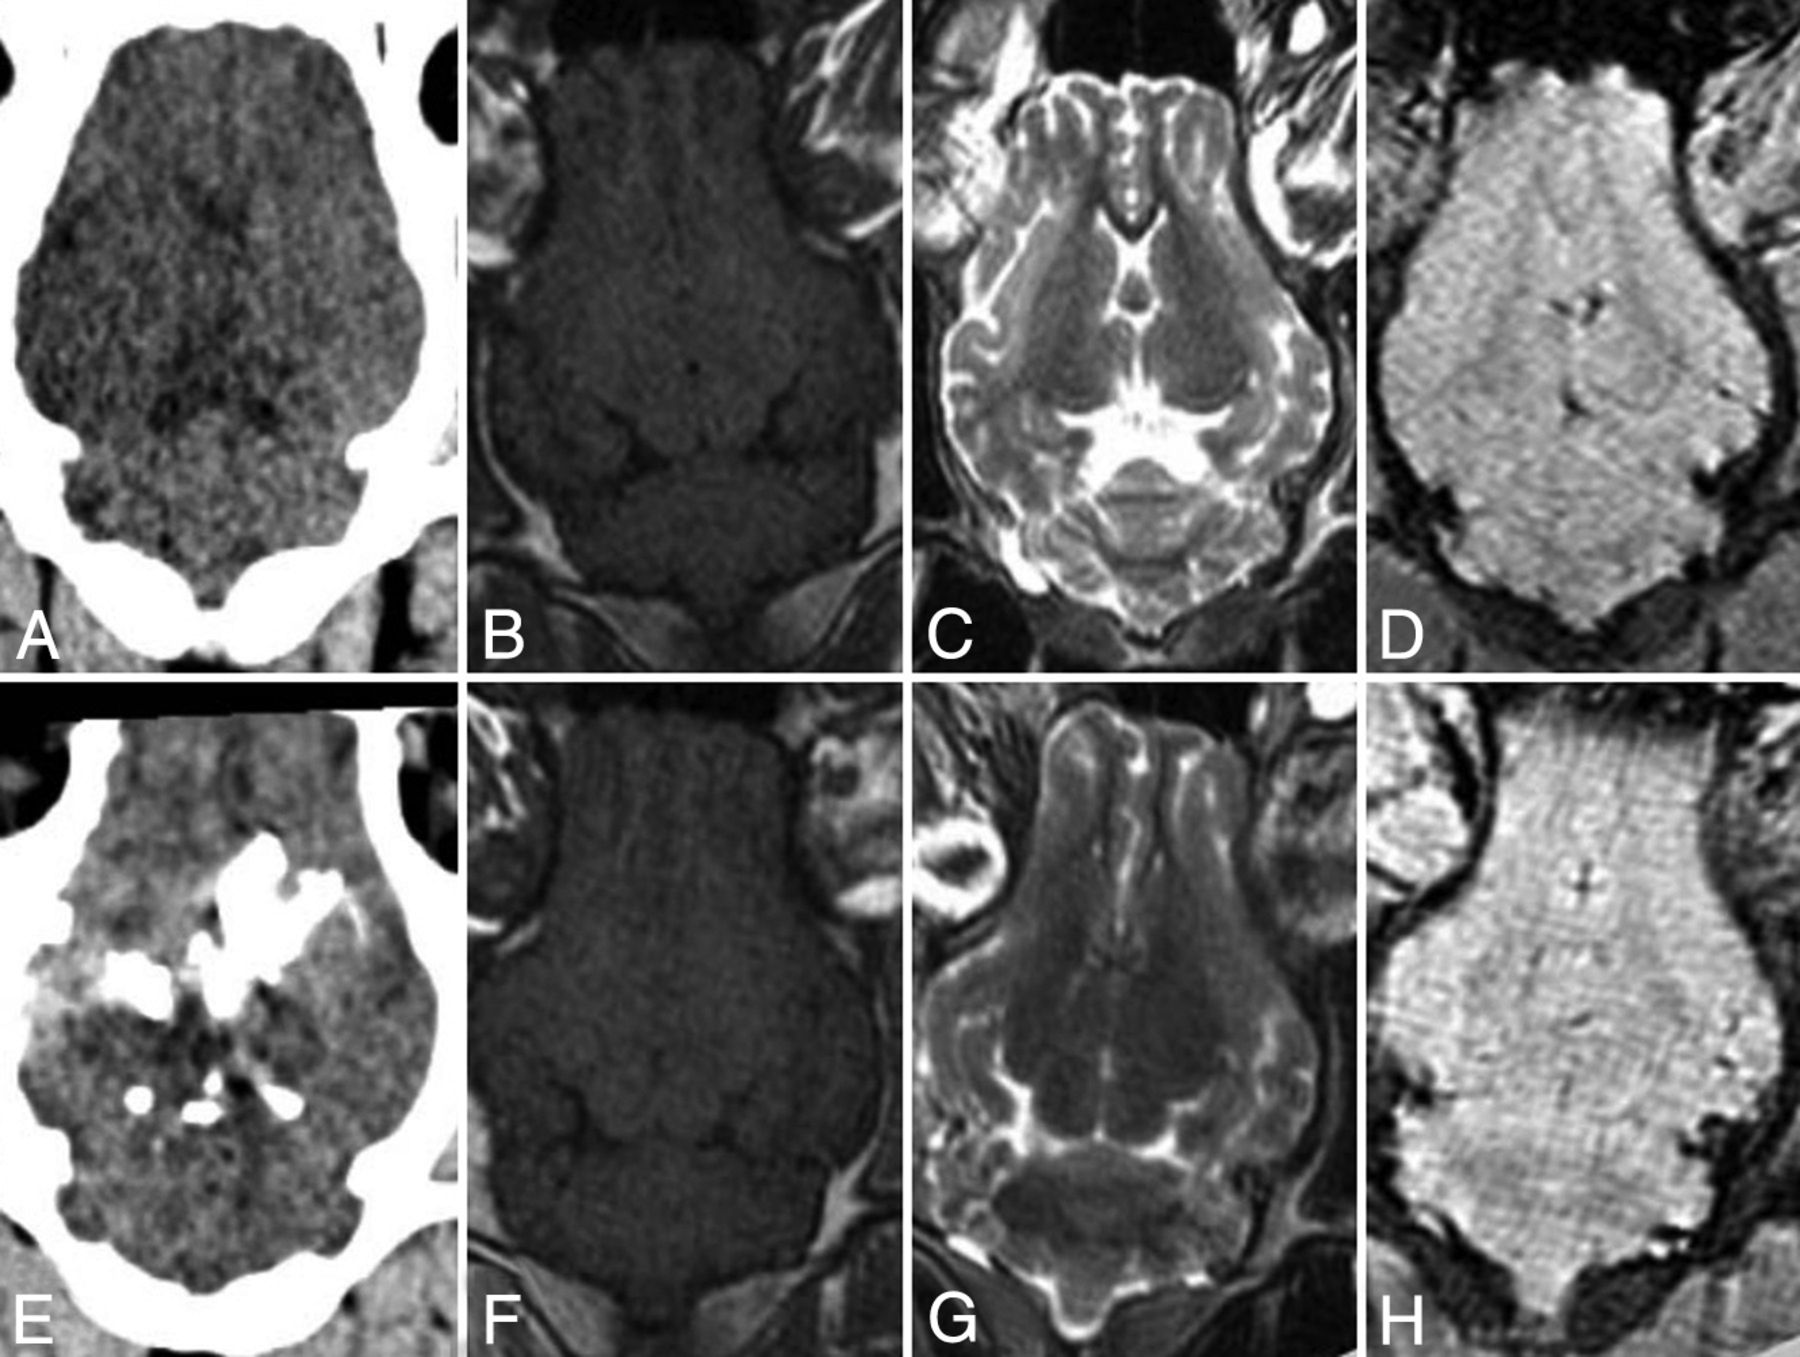
Undiluted iopamidol injected directly into the brain parenchyma was clearly visible on CT but did not cause visually distinctive signal changes on T1-weighted SE, T2-weighted TSE, and T2*-weighted GRE imaging (Figure). Concerning this outcome, there was total agreement (100%) between both observers (Spearman ρ not calculable). Small amounts of iopamidol, injected into the lateral ventricles and the subarachnoid space unintentionally, were visible on CT but not on MR imaging.

Ex vivo animal model. Porcine brain (Landrace, 60 kg) before (upper row) and after (lower row) direct injection of 5 mL of iopamidol. From left to right: axial CT (A and E) and T1-weighted (B and F), T2-weighted (C and G), and T2*-weighted (D and H) MR imaging. While the injected iodinated contrast agent is clearly visible on CT (E), there are no visually distinctive signal changes on MR imaging (F–H). Compared with the in vitro model, in which pure iopamidol causes visually distinctive signal changes (On-line Fig 2), the lack of signal changes in the ex vivo model could be attributed to rapid dilution of the injected contrast agent and/or the different magnetic environment where the contrast agent is located.
Discussion
When there are hyperattenuated areas on CT after neurointerventional stroke treatment, one of the most important issues is to determine whether there is underlying hemorrhage, because the presence of hemorrhage has crucial implications for further treatment decisions, such as the administration of anticoagulants. Discriminating between hemorrhage and contrast agent with the help of conventional CT is usually based on thresholds and cutoffs, assuming that hemorrhage persists after 24 hours and does not exceed 90 HU.2 However, systematic studies, which aimed to validate the value of attenuation cutoffs or the 24-hour cutoff, are lacking to date.2 Thus such cutoffs and thresholds may only serve as a rule of thumb, on which clinically relevant decisions should not be based.2
Recent studies dealing with dual-energy CT imply that it is possible to distinguish contrast extravasation from hemorrhage by using this method.1,3 However, the limited availability of these scanners remains a relevant hurdle in daily clinical practice. In most institutions, MR imaging may be the technique of choice because it is widely available and hemorrhage causes specific signal changes on MR imaging. However, it has been shown in phantom models that T1 and T2 shortening caused by iodinated contrast agents may theoretically mimic the appearance of intracellular methemoglobin, which is present in early subacute intracerebral hematomas within 3–7 days after hemorrhage.5,6 Because many MR imaging examinations are performed within this time period, the differentiation between hemorrhage and extravasated contrast agent may thus be complicated.
Our results confirm that iodinated contrast agents in fact cause visually distinctive T1 and T2 shortening in phantom models (On-line Fig 2).5,6 Nevertheless, our data and data from the literature also imply that this effect is negligible when contrast agents are diluted.5 In accordance with the results from the phantom models, even pure iopamidol that was injected directly into the brain parenchyma in an ex vivo animal model did not cause visually distinctive signal changes on T1 SE, T2 TSE, and T2* GRE imaging (Figure). Most interesting, our phantom model has shown that the tested contrast agents at high concentrations produce a negative susceptibility shift that is relatively strong compared with contrast within brain tissue, which typically ranges up to 0.1 ppm. Phase imaging and quantitative susceptibility mapping in patients with stroke might thus reveal a large accumulation of iodinated contrast agent. However, given that iodinated contrast agents are always diluted in large amounts of blood during angiography, signal changes caused by iodinated contrast agents are most likely negligible on MR imaging (On-line Fig 1).
Limitations
Investigating only 2 iodinated contrast agents and performing only 1 animal ex vivo experiment are major limitations of our study. It is also uncertain whether iodinated contrast agent injected into the brain parenchyma has the same effect on MR imaging as contrast agent accumulated through a damaged blood-brain barrier. Future systematic studies with more adequate stroke models (for example canines) may help to further elucidate in vivo MR imaging characteristics of iodinated contrast agents. Despite the limitations of our study, our experiments may serve as sufficient proof-of-principle, given that results from prior studies and theoretic considerations do not imply that extravasated iodinated contrast agents cause clinically relevant signal changes in MR imaging.
Conclusions
Our results imply that it is unlikely that iodinated contrast agents, which are extravasated into infarcted brain parenchyma during angiography, cause signal changes that mimic intracellular methemoglobin on T1-weighted, T2-weighted, and T2*-weighted MR imaging. Extravasated contrast agents can be distinguished from hemorrhage on MR imaging with sequences that are common in clinical practice.
Footnotes
Disclosures: Martin Wiesmann—UNRELATED: Consultancy: Stryker Neurovascular, Silk Road Medical; Payment for Lectures (including service on Speakers Bureaus): Bracco, Siemens, Stryker Neurovascular; Payment for Development of Educational Presentations: Abbott, ab medica,* Acandis,* Bayer,* Bracco,* B. Braun,* Codman Neurovascular,* Covidien,* Dahlhausen,* MicroVention,* Penumbra,* phenox,* Philips Healthcare,* Siemens,* Silk Road Medical,* St. Jude,* Stryker Neurovascular*; Travel/Accommodations/Meeting Expenses Unrelated to Activities Listed: Covidien.* *Money paid to the institution.
References
- 1.
- 2.
- 3.
- 4.
- 5.
- 6.
- 7.
- 8.
- 9.
- 10.
- Received October 9, 2015.
- Accepted after revision January 14, 2016.
- © 2016 by American Journal of Neuroradiology