
Abstract
BACKGROUND AND PURPOSE: Preoperative hemodynamic impairment in the affected cerebral hemisphere is associated with the development of cerebral hyperperfusion following carotid endarterectomy. Cerebral oxygen extraction fraction images generated from 7T MR quantitative susceptibility mapping correlate with oxygen extraction fraction images on positron-emission tomography. The present study aimed to determine whether preoperative oxygen extraction fraction imaging generated from 7T MR quantitative susceptibility mapping could identify patients at risk for cerebral hyperperfusion following carotid endarterectomy.
MATERIALS AND METHODS: Seventy-seven patients with unilateral internal carotid artery stenosis (≥70%) underwent preoperative 3D T2*-weighted imaging using a multiple dipole-inversion algorithm with a 7T MR imager. Quantitative susceptibility mapping images were then obtained, and oxygen extraction fraction maps were generated. Quantitative brain perfusion single-photon emission CT was also performed before and immediately after carotid endarterectomy. ROIs were automatically placed in the bilateral middle cerebral artery territories in all images using a 3D stereotactic ROI template, and affected-to-contralateral ratios in the ROIs were calculated on quantitative susceptibility mapping–oxygen extraction fraction images.
RESULTS: Ten patients (13%) showed post-carotid endarterectomy hyperperfusion (cerebral blood flow increases of ≥100% compared with preoperative values in the ROIs on brain perfusion SPECT). Multivariate analysis showed that a high quantitative susceptibility mapping–oxygen extraction fraction ratio was significantly associated with the development of post-carotid endarterectomy hyperperfusion (95% confidence interval, 33.5–249.7; P = .002). Sensitivity, specificity, and positive- and negative-predictive values of the quantitative susceptibility mapping–oxygen extraction fraction ratio for the prediction of the development of post-carotid endarterectomy hyperperfusion were 90%, 84%, 45%, and 98%, respectively.
CONCLUSIONS: Preoperative oxygen extraction fraction imaging generated from 7T MR quantitative susceptibility mapping identifies patients at risk for cerebral hyperperfusion following carotid endarterectomy.
ABBREVIATIONS:
- CEA
- carotid endarterectomy
- OEF
- oxygen extraction fraction
- QSM
- quantitative susceptibility mapping
- ROC
- receiver operating characteristic
Cerebral hyperperfusion following carotid endarterectomy (CEA) has been defined as a substantial increase in ipsilateral cerebral blood flow well above the metabolic demands of brain tissue following surgical repair of carotid stenosis.1,2 Cerebral hyperperfusion syndrome after CEA is a complication of cerebral hyperperfusion;3 its characteristic features include unilateral headache, pain in the face or eyes, seizures, and focal symptoms secondary to intracerebral hemorrhage or cerebral edema.1⇓⇓–4 Intracerebral hemorrhage has a low incidence (1%), but patients with this condition have a poor prognosis.5 Moreover, several studies have found that post-CEA hyperperfusion, even when asymptomatic, causes slight but diffuse damage to the ipsilateral cerebral cortex and white matter.3,6,7 This damage that occurs after CEA hyperperfusion is a principal cause of the postoperative cognitive impairment observed in 10% of patients following CEA.3,6,7
Cerebrovascular autoregulatory mechanisms operate through dilation of precapillary resistance vessels that maintain CBF when reductions in cerebral perfusion pressure occur, and this is referred to as stage 1 ischemia.3,8⇓–10 However, the autoregulatory mechanism provides insufficient compensation for severe decreases in cerebral perfusion pressure, which then leads to decreased CBF, referred to as misery perfusion or stage 2 ischemia.3,8⇓–10 Thus, misery perfusion, which is defined as marginally sufficient cerebral blood supply relative to cerebral metabolic demand, is a situation with severely impaired cerebral hemodynamics.8 This condition occurs in patients with chronic steno-occlusive diseases of the internal carotid artery.8
The risk factors for cerebral hyperperfusion include high-grade stenosis, poor collateral blood flow, contralateral carotid occlusion, and long-standing hypertension, and they often result in impaired cerebral hemodynamics.11⇓⇓–14 When normal perfusion pressure is rapidly restored after CEA, hyperperfusion may occur in regions of the brain with impaired autoregulation due to chronic ischemia. This hypothesis is like the “normal perfusion pressure breakthrough” theory of Spetzler et al.13,15 Indeed, preoperative misery perfusion in the affected cerebral hemisphere is reportedly associated with the development of cerebral hyperperfusion following CEA or carotid stent placement for cervical ICA stenosis.16,17
Misery perfusion is principally detected as an increased oxygen extraction fraction (OEF) on positron-emission tomography.8 Several approaches have been attempted to measure OEF by using MR imaging techniques.18 In general, these techniques use blood oxygen level–dependent effects induced by differences in magnetic susceptibility between oxy- and deoxyhemoglobin to quantify oxygenation in venous structures and/or brain parenchyma.19⇓–21 Quantitative susceptibility mapping (QSM) is a postprocessing technique for quantifying the magnetic susceptibility of venous structures and brain parenchyma from T2*-weighted magnitude/phase images, which can be easily obtained by commercial scanners.22 Indeed, a recent study has introduced an OEF measurement method based on the QSM technique and has demonstrated that cerebral OEF images generated from QSM at 7T MR imaging correlate with OEF images on PET and provide high sensitivity and high specificity for detecting misery perfusion in the middle cerebral artery territory in patients with unilateral chronic ICA or MCA steno-occlusive disease.23
The purpose of the present study was to determine whether preoperative OEF imaging generated from 7T MR QSM could identify patients at risk for cerebral hyperperfusion following CEA.
Materials and Methods
Study Design
The present study was a prospective observational study. The protocol of this study was reviewed and approved by the institutional ethics committee at Iwate Medical University, and written, informed consent was obtained from all patients or their next of kin before the patient's participation.
Patient Selection
Patients with the following conditions who underwent CEA of the carotid bifurcation in our institution were included in the present study: 1) unilateral ICA stenosis of ≥70% as per the North American Symptomatic Carotid Endarterectomy Trial24 on angiography/arterial catheterization without occlusion or severe (≥70%) stenosis in the contralateral ICA; 2) useful preoperative residual function (modified Rankin Scale score, 0–2); and 3) no ipsilateral carotid territory ischemic symptoms or ipsilateral carotid territory ischemic symptoms for >6 months before presentation (defined as asymptomatic),3 or ipsilateral carotid territory ischemic symptoms between 2 weeks and 6 months before presentation (defined as symptomatic).3 Patients who did not undergo 7T MR imaging preoperatively were excluded.
Preoperative OEF Imaging Generated from MR QSM
A 7T MR imaging scanner (Discovery MR950; GE Healthcare, Milwaukee, Wisconsin) with quadrature transmission and 32-channel receive head coils was used. Source data of QSM were obtained with a 3D spoiled gradient-recalled acquisition technique with the following scanning parameters: TR, 30 ms; TE, 15 ms; flip angle, 20°; FOV, 256 mm; acquisition matrix size, 512 × 256; section thickness, 2 mm; number of sections, 160; reconstruction voxel size after zero-fill interpolation, 0.5 mm3; and scan time, 3 minutes 25 seconds.23 Magnitude and real/imaginary phase images were regenerated from this acquisition.
QSM images were generated from the source images with an in-house program with a multiple dipole-inversion combination with k-space segmentation25 and regularization-enabled sophisticated harmonic artifact reduction for phase data methods,26 as described previously.23 A 2D Gaussian low-pass filter with a kernel size of 60% of the total image power in each section was applied to extract iron deposition in deep nuclei, hemosiderin deposition, dural sinuses, and large venous structures; and a 2D Gaussian high-pass filter of 2% was applied to extract small venous structures.23 Subsequently, small venous structures were determined by multiplying the Gaussian high-pass-filter–processed binary images and the logical negations of Gaussian low-pass-filter–processed binary images under the threshold for binarization of ≥2 SDs.23
The OEF maps with voxels of interest of 25 mm3 were generated from the processed QSM images according to a previous study.22,23 In brief, the susceptibility difference between venous structures and surrounding brain tissues, Δχ, is expressed by the following equation:
 where Δχdo is the difference in the susceptibility per unit hematocrit between fully deoxygenated and fully oxygenated blood [0.18 ppm (cgs) was used],27 Hct is hematocrit (0.45 was used), Yv is venous oxygen saturation, and Pv is a correction factor for partial volume effects that was defined as approximately 7.0 according to the previous study.23 On the other hand, OEF is defined as (Ya − Yv)/Ya, where Ya is arterial oxygen saturation and can be estimated as 1 − Yv under usual conditions in which Ya is nearly 100%.28 Hence, the OEF can be calculated with the following equation:
Detection of Cerebral Hyperperfusion following CEA
To detect cerebral hyperperfusion following CEA, quantitative brain perfusion SPECT was performed with iodine 123 N-isopropyl-p-iodoamphetamine (123I-IMP) within 14 days before and immediately after CEA. The 123I-IMP SPECT study was performed as described previously.29 Patients with post-CEA hyperperfusion also underwent a third 123I-IMP SPECT in the same manner 3 days after CEA. The quantitative CBF images were calculated according to the 123I-IMP-autoradiography method.29
Imaging Data Analysis
All QSM-OEF and brain perfusion SPECT images were transformed into the standard brain size and shape by linear and nonlinear transformation using Statistical Parametric Mapping 12 (http://www.fil.ion.ucl.ac.uk/spm/software/spm12) for anatomic standardization.3,30 Thus, all the subjects' brain images had the same anatomic format. Then, a 3D stereotactic ROI template was used to automatically place 318 constant ROIs in both the cerebral and cerebellar hemispheres.3,31 The ROIs were grouped into 10 segments (callosomarginal, pericallosal, precentral, central, parietal, angular, temporal, posterior, hippocampus, and cerebellum) in each hemisphere by arterial supply. Of these 10 segments, 5 (precentral, central, parietal, angular, and temporal) were combined to define an ROI perfused by the MCA (Fig 1).3
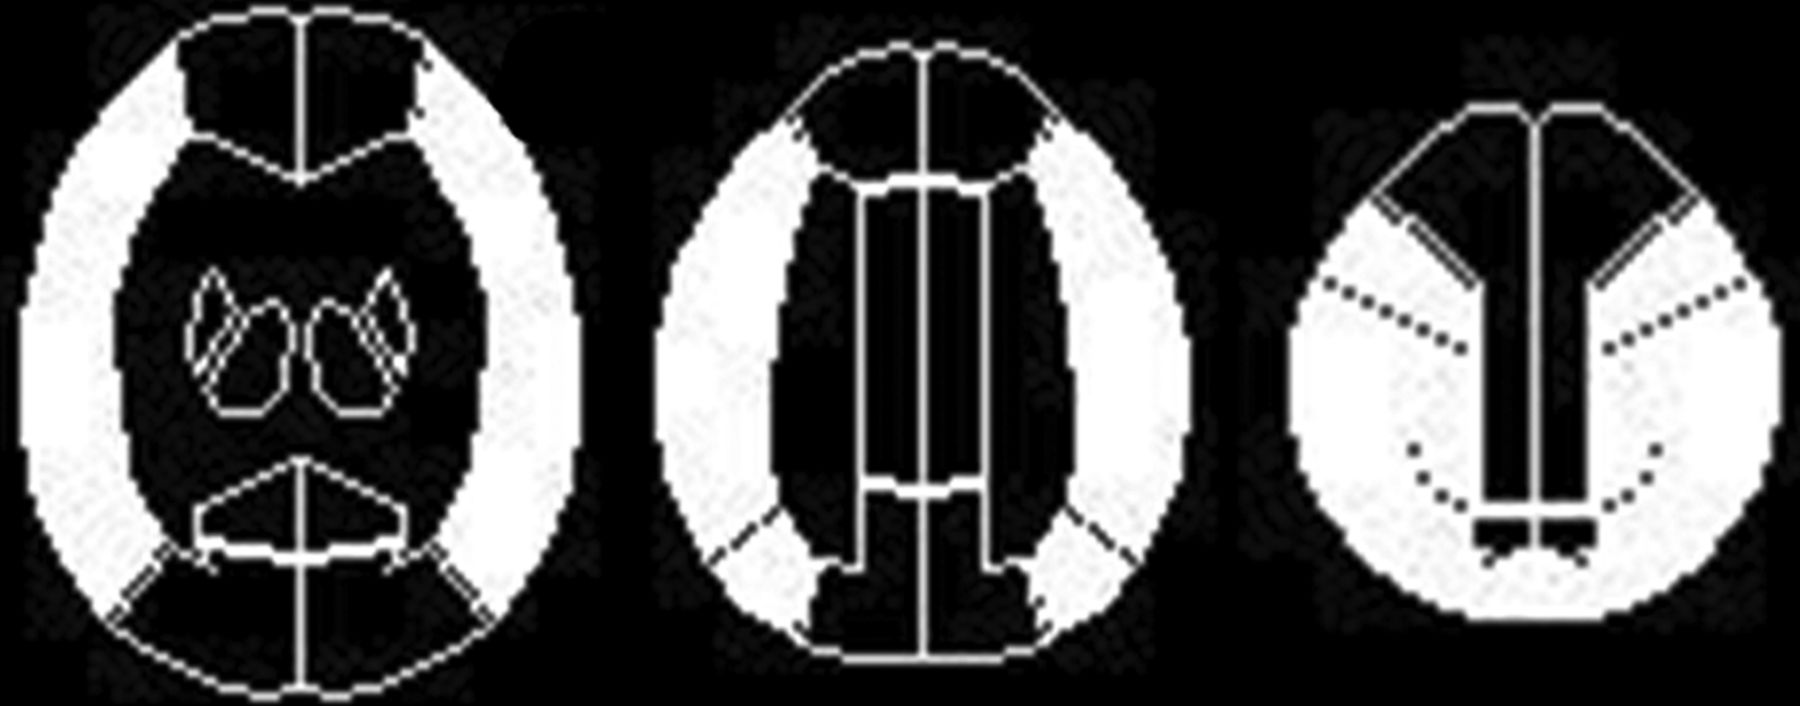
Diagrams showing some ROIs of a 3D stereotactic ROI template on MR quantitative susceptibility mapping–oxygen extraction fraction images and brain perfusion single-photon emission CT images. The white ROIs indicate the bilateral cortical territories perfused by the bilateral middle cerebral arteries.
For QSM-OEF images, the mean value of all pixels was calculated in the bilateral MCA ROIs. For each patient, the asymmetry ratio in the MCA ROI (QSM-OEF ratio) was calculated as the value in the cerebral hemisphere ipsilateral to the side of surgery divided by the value in the contralateral cerebral hemisphere.
For brain perfusion SPECT images, the mean value of all pixels in the MCA ROI in the cerebral hemisphere ipsilateral to the CEA was calculated before and after the operation. For each patient, post-CEA hyperperfusion was defined as a quantitative CBF increase of ≥100% (ie, doubling) compared with preoperative values in an MCA ROI ipsilateral to the side of surgery.3,13
Pre-, Intra-, and Postoperative Management
Antiplatelet therapy was given to all patients until the morning of the day of CEA, and surgery was performed with the patient under general anesthesia.3 A heparin bolus (5000 IU) was administered before ICA clamping.3 An intraluminal shunt was placed on the basis of the findings of intraoperative electroencephalography with a 12-channel montage.3,32
In all patients with post-CEA hyperperfusion on brain perfusion SPECT performed immediately after the operation, arterial blood pressure was intensively controlled between 100 and 140 mm Hg by intravenous antihypertensive drugs.3 If the CBF decreased and the hyperperfusion had resolved on brain perfusion SPECT performed on the third postoperative day, pharmacologic blood pressure control was stopped.3 However, if the hyperperfusion continued, the systolic arterial blood pressure was controlled to <140 mm Hg.3 If a patient developed hyperperfusion syndrome, a propofol coma was induced.3 Hyperperfusion syndrome was diagnosed with the following criteria: 1) seizure, alteration in consciousness level, and/or focal neurologic signs such as motor weakness that newly developed or worsened between 24 hours and 30 days after the operation; and 2) the presence of hyperperfusion on brain perfusion SPECT.3
Statistical Analysis
Data are expressed as means ± SD. The relationship between each variable including the QSM-OEF ratio and the development of cerebral hyperperfusion defined by brain perfusion SPECT was evaluated by univariate analysis with the Mann-Whitney U test or the χ2 test. Multivariate statistical analysis of factors related to the development of cerebral hyperperfusion was also performed with a logistic regression model. Variables with P < .2 on univariate analyses were included in the final model. Differences were considered significant with P < .05. The accuracy of the QSM-OEF ratio for predicting the development of cerebral hyperperfusion was evaluated by receiver operating characteristic (ROC) curve analyses when the relationship between the 2 parameters was significant. Exact 95% confidence intervals of sensitivity, specificity, and positive and negative predictive values were computed with binomial distributions.
Results
During the 33-month period of the study, 111 patients satisfied the inclusion criteria and were scheduled to undergo 7T MR imaging preoperatively. However, 25 patients did not undergo 7T MR imaging because they had implantable electronic devices or implantable metals such as coronary artery stents, pacemakers, or broken bone fixtures, which are contraindications for 7T MR imaging. In another 5 patients, 7T MR imaging was canceled half-way through scanning due to the development of headache, vertigo, or claustrophobia. The remaining 81 patients successfully underwent 7T MR imaging. However, data that were sufficient to generate OEF maps were not obtained in 7T MR imaging of 4 patients due to motion artifacts, and these 4 patients were excluded from the analysis. Seventy-seven patients were thus enrolled in the present study.
The mean age of the 77 patients (70 men, 7 women) was 70 ± 7 years (range, 52–86 years). There were 73 patients with hypertension, 37 patients with diabetes mellitus, and 64 patients with dyslipidemia. Fifty-one patients had ipsilateral carotid territory symptoms, and 26 patients showed asymptomatic ICA stenosis. The overall average degree of ICA stenosis was 87% ± 9% (range, 70%–99%). The mean duration of ICA clamping was 36 minutes (range, 25–56 minutes). An intraluminal shunt was placed in 3 patients.
Ten patients (13%) fulfilled the CBF criteria for post-CEA hyperperfusion on the quantitative brain perfusion SPECT images obtained immediately after surgery; 8 of these patients showed no hyperperfusion on the SPECT performed on the third postoperative day, and they all had uneventful postoperative courses. However, in the remaining 2 patients with cerebral hyperperfusion immediately after CEA, a progressive increase in CBF was seen on the third postoperative day; they developed cerebral hyperperfusion syndrome with hemiparesis on the side contralateral to the side of surgery or aphasia with onset 5 and 8 days after the operation, respectively. Propofol coma was induced in these 2 patients, and they eventually showed full neurologic recovery after termination of the propofol coma.
Fig 2 shows the relationship between the QSM-OEF ratio and the development of cerebral hyperperfusion defined by brain perfusion SPECT. The QSM-OEF ratio was significantly greater in patients with cerebral hyperperfusion (1.176 ± 0.090) than in those without it (1.027 ± 0.102, P = .0001). The Table shows the results of univariate analyses of other factors related to the development of post-CEA hyperperfusion. None of the variables were significantly associated with the development of post-CEA hyperperfusion. After closely related variables were eliminated in univariate analyses, the following variables (P < .2), the QSM-OEF ratio and the degree of ICA stenosis, were included in the logistic regression model for multivariate analysis. On multivariate analysis, a high QSM-OEF ratio was significantly associated with the development of post-CEA hyperperfusion (95% CI, 33.5–249.7; P = .002).

Relationship between the preoperative QSM-OEF ratio and the presence or absence of postoperative hyperperfusion. Arrows indicate patients with cerebral hyperperfusion syndrome. The dashed horizontal line denotes the cutoff point lying closest to the left upper corner of the ROC characteristic curve for predicting the development of postoperative hyperperfusion.
Risk factors for the development of post-CEA hyperperfusion
Fig 3 shows the ROC curve of the QSM-OEF ratio, which can be used to assess its ability to predict the development of post-CEA hyperperfusion. The area under the ROC curve was 0.882 (95% CI, 0.788–0.944). Sensitivity, specificity, and positive and negative predictive values for the QSM-OEF ratio at the cutoff point (1.116) lying closest to the left upper corner of the ROC curve for the prediction of the development of post-CEA hyperperfusion were 90% (95% CI, 71–100), 84% (95% CI, 75–92), 45% (95% CI, 23–67), and 98% (95% CI, 95–100), respectively (Figs 2 and 3).

ROC curve used to assess the accuracy of the QSM-OEF ratio for predicting the development of postoperative hyperperfusion. AUC indicates area under the ROC curve.
Representative images of the preoperative QSM-OEF maps and the pre- and postoperative quantitative brain perfusion SPECT from a patient with post-CEA hyperperfusion are shown in Fig 4.

A 77-year-old man with symptomatic left internal carotid artery stenosis (85%) who developed cerebral hyperperfusion syndrome with right-sided hemiparesis and aphasia with onset 5 days after the operation. A, Preoperative QSM-OEF images show elevation of the values in the left cerebral cortex compared with those in the right cerebral cortex. B, Brain perfusion single-photon emission CT images before the operation show hypoperfusion in the left cerebral hemisphere (upper row) where hyperperfusion developed immediately after the operation (lower row).
Discussion
The present study demonstrated that preoperative OEF imaging generated from 7T MR QSM could identify patients at risk for cerebral hyperperfusion following CEA.
The benefits and drawbacks of the method used in the present study for OEF estimation have already been discussed in the literature.23 Briefly, the present QSM-based method has several advantages, such as use of a conventional sequence; short acquisition time; no need for any challenge, contrast agent, or other invasive procedures; sufficient spatial resolution with whole-brain coverage; and robustness to low perfusion status, suggesting high ease of use in clinical practice and clinical studies for patients with cerebrovascular and other neurologic disorders.23 Zhang et al19 have recently demonstrated that QSM can be used with perfusion measurements of pre- and post-caffeine vasoconstriction to map the cerebral metabolic rate of oxygen and OEF. However, this method needs a caffeine challenge and 2 MR images. It also uses arterial spin-labeling MR perfusion imaging to obtain CBF data. This perfusion imaging depends on the arterial transit time.33 With the postlabeling delay of 1.5 seconds used in the study by Zhang et al, slow flow through collateral vessels in the cerebral hemisphere with ICA steno-occlusive disease is often underestimated, resulting in overestimation of OEF.33
On the other hand, as drawbacks, the present method is highly dependent on the algorithms for generating QSM images and for estimating OEF values.23 Several algorithms for QSM generation have been proposed, and they vary in terms of preservation of small venous structures, which appears crucial to obtain accurate OEF values.23 The software for estimating OEF values from QSM images are in-house programs that need further revisions to distribute as free software programs.23 Further optimization of the algorithm and parameters, as well as publication of the program, is needed for wide adoption of the QSM-OEF method.23
Various mechanisms to explain the development of post-CEA hyperperfusion have been proposed.4,13 When there is severe ICA stenosis and deficient collateral circulation, hemispheric perfusion pressure is severely decreased distal to the ICA stenosis, which may reduce perfusion pressure below the compensatory capacity of autoregulatory mechanisms, causing maximal dilation of resistance vessels and misery perfusion. When normal perfusion pressure is restored following CEA, it may take several days for chronically impaired autoregulatory mechanisms to adjust to the new steady-state, resulting in temporary ongoing hyperperfusion. In the present study, a high QSM-OEF ratio was found to be the only independent predictor of post-CEA hyperperfusion, which supports the theory that hyperperfusion occurs due to loss of normal vasoconstriction secondary to chronic cerebral ischemia and dysfunctional autoregulatory mechanisms.
In the present study, the optimal cutoff point of the QSM-OEF ratio on the ROC curve to predict the development of post-CEA hyperperfusion was 1.116. According to a previous study comparing QSM-OEF with PET-OEF,23 this value corresponded to the mean + 2.9 SD of the QSM-OEF ratio obtained from healthy subjects. With this cutoff point, the QSM-OEF ratio provided a sensitivity of 90% and a negative-predictive value of 98% for predicting the development of post-CEA hyperperfusion. This high sensitivity and high negative predictive value suggest that the QSM-OEF ratio is suitable as a screening test for preoperative prediction of post-CEA hyperperfusion. On the other hand, among the present results, there was a patient with false-negative findings with post-CEA hyperperfusion despite the absence of preoperatively increased QSM-OEF in the affected hemisphere (QSM-OEF ratio of 1.009). These findings in this patient suggest that loss of normal vasoconstriction and maladaptive autoregulatory mechanisms causing post-CEA hyperperfusion rarely develop in cerebral hemodynamic conditions other than with misery perfusion. A previous study demonstrated that post-CEA hyperperfusion can occur even in patients with stage 1 ischemia, in which precapillary resistance vessels are dilated to maintain CBF in the context of reductions in cerebral perfusion pressure, though the OEF was not yet elevated.3 Because QSM-OEF imaging theoretically does not detect stage 1 ischemia, this imaging can provide false-negative results.
In this study, the QSM-OEF ratio showed a relatively low positive predictive value (45%) for the development of post-CEA hyperperfusion. It has been reported that most patients with preoperatively impaired cerebral hemodynamics and significantly decreased perfusion in the ipsilateral cerebral hemisphere during ICA clamping in CEA developed post-CEA hyperperfusion; this finding suggests that in addition to the impaired cerebrovascular autoregulation due to chronic ischemia, intraoperative acute global ischemia is involved in the pathogenesis of post-CEA hyperperfusion.34 This may explain the low positive predictive value for the prediction of post-CEA hyperperfusion when only preoperative measurements of cerebral hemodynamics, such as the QSM-OEF ratio, are used.34
Regarding management for cerebral hyperperfusion after CEA, several investigators have noted the following: 1) Two-thirds of patients with cerebral hyperperfusion on brain perfusion imaging performed immediately after surgery develop intracerebral hemorrhage within 15 days after the operation if intensive blood pressure control is not started immediately afterwards,5 and this intensive blood pressure control prevents the development of intracerebral hemorrhage due to cerebral hyperperfusion;5,13 2) carotid artery stenosis and other vascular atherosclerotic diseases, including coronary artery disease or lower extremity atherosclerotic occlusive disease, often coexist, and the intensive blood pressure control (eg, intentional hypotension) for such patients induces ischemic events involving the other atherosclerotic steno-occlusive lesions, suggesting that only patients who are preoperatively determined to have a high risk of cerebral hyperperfusion or are identified as having cerebral hyperperfusion on brain perfusion imaging done immediately after surgery should undergo intensive blood pressure control to minimize the risk of hypotension-induced ischemic events;13 and 3) an intraoperative administration of a free radical scavenger, edaravone, significantly prevents the development of cerebral hyperperfusion itself,35 thus reducing the incidence of postoperative cognitive impairment, as well as postoperative intracerebral hemorrhage.36
On the basis of these previous findings and the present data, we propose a practical clinical algorithm to manage cerebral hyperperfusion: A patient scheduled to undergo CEA first undergoes preoperative OEF imaging generated from MR QSM. If the QSM-OEF ratio is high (>1.116), the patient is determined to have a high risk for cerebral hyperperfusion and undergoes an intraoperative administration of edaravone, brain perfusion imaging immediately after the operation, and/or postoperative intensive blood pressure control, because patients without a high QSM-OEF ratio rarely experience postoperative cerebral hyperperfusion.
In the present study, a 7T scanner that yields profound susceptibility effects was used to improve the accuracy for estimating misery perfusion. Against our expectations, however, a recent study has demonstrated that QSM-OEF at 7T MR imaging achieved only a slight improvement in the correlation coefficient, and the sensitivity/specificity of OEF obtained with 15O-PET included substantial systematic biases in terms of the agreements compared with that at 3T MR imaging.22,23 This issue can be mainly attributed to the relatively low spatial resolution of the source images at 7T MR imaging, which was comparable with that at 3T MR imaging.22,23 Although the blood oxygen level–dependent effect is much stronger at 7T MR imaging than at 3T MR imaging, susceptibility information of minute venous structures at 7T MR imaging was presumably overlooked due to the low resolution of the images.23 Thus, whereas the use of a 7T scanner in the present study is a significant limitation on the availability of QSM-OEF, the same results as in the present study could probably be obtained with QSM-OEF at 3T MR.
Conclusions
The present study demonstrated that preoperative OEF imaging generated from 7T MR QSM could identify patients at risk for cerebral hyperperfusion following CEA. Use of 7T MR imaging for humans is currently limited. However, 7T MR imagers will be applied to patients in clinical practice soon, as has occurred for 3T MR imaging. The present results suggest that imaging of cerebral hemodynamics on 7T MR imaging may be useful for predicting the development of brain adverse events following surgical interventions.
Footnotes
Disclosures: Ikuko Uwano—UNRELATED: Grants/Grants Pending: SENSHIN Medical Research Foundation. Makoto Sasaki—UNRELATED: Consultancy: Actelion Pharmaceuticals; Grants/Grants Pending: Hitachi, Japan Agency for Medical Research and Development, Japanese Ministries, Japanese Cabinet Office*; Payment for Lectures Including Service on Speakers Bureaus: Hitachi, Tanabe, Mediphysics, Eizai, FUJIFILM Pharmaceuticals, Daiichi Sankyo, Boehringer, Bayer AG, Otsuka Pharmaceutical, Chugai Pharma. Kohsuke Kudo—UNRELATED: Grants/Grants Pending: Japan Agency for Medical Research Development, Hitachi, Bayer, J-MAC SYSTEM, PSP Corporation*; Payment for Lectures Including Service on Speakers Bureaus: Hitachi, Bayer AG, Eizai, Daiichi Sankyo, FUJIFILM Pharmaceuticals. Kuniaki Ogasawara—RELATED: Grant: Grants-in-Aid for Strategic Medical Science Research (S1491001, 2014–2018) from the Ministry of Education, Culture, Sports, Science and Technology of Japan and a Grant-in-Aid for Scientific Research (15K10313) from the Japan Society for the Promotion of Science. *Money paid to the institution.
This work supported, in part, by Grants-in-Aid for Strategic Medical Science Research (S1491001, 2014–2018) from the Ministry of Education, Culture, Sports, Science and Technology of Japan and a Grant-in-Aid for Scientific Research (15K10313) from the Japan Society for the Promotion of Science.
Indicates open access to non-subscribers at www.ajnr.org
References
- Received June 3, 2017.
- Accepted after revision July 18, 2017.
- © 2017 by American Journal of Neuroradiology


