
Abstract
BACKGROUND: Diffusion tensor imaging has been widely used to measure HIV effects on white matter microarchitecture. While many authors have reported reduced fractional anisotropy and increased mean diffusivity in HIV, quantitative inconsistencies across studies are numerous.
PURPOSE: Our aim was to evaluate the consistency across studies of HIV effects on DTI measures and then examine the DTI reliability in a longitudinal seropositive cohort.
DATA SOURCES: Published studies and investigators.
STUDY SELECTION: The meta-analysis included 16 cross-sectional studies reporting fractional anisotropy and 12 studies reporting mean diffusivity in the corpus callosum.
DATA ANALYSIS: Random-effects meta-analysis was used to estimate study standardized mean differences and heterogeneity. DTI longitudinal reliability was estimated in seropositive participants studied before and 3 and 6 months after beginning treatment.
DATA SYNTHESIS: Meta-analysis revealed lower fractional anisotropy (standardized mean difference, −0.43; P < .001) and higher mean diffusivity (standardized mean difference, 0.44; P < .003) in seropositive participants. Nevertheless, between-study heterogeneity accounted for 58% and 66% of the observed variance (P < .01). In contrast, the longitudinal cohort fractional anisotropy was higher and mean diffusivity was lower in seropositive participants (both, P < .001), and fractional anisotropy and mean diffusivity measures were very stable during 6 months, with intraclass correlation coefficients all >0.96.
LIMITATIONS: Many studies pooled participants with varying treatments, ages, and disease durations.
CONCLUSIONS: HIV effects on WM microstructure had substantial variations that could result from acquisition, processing, or cohort-selection differences. When acquisition parameters and processing were carefully controlled, the resulting DTI measures did not show high temporal variation. HIV effects on WM microstructure may be age-dependent. The high longitudinal reliability of DTI WM microstructure measures makes them promising disease-activity markers.
ABBREVIATIONS:
- AD
- axial diffusivity
- cART
- combination antiretroviral therapy
- CPE
- CNS penetration effectiveness
- FA
- fractional anisotropy
- MD
- mean diffusivity
- RD
- radial diffusivity
- SMD
- standardized mean difference
The advent of combination antiretroviral therapies (cART) for HIV has resulted in both increases in life expectancy and decreases in mortality.1 While cART successfully controls HIV viremia and reconstitutes immune function,2 the effects of persisting HIV infection and its treatments on brain structure and function are less clear. The incidence of HIV-associated dementia declines following cART initiation,3 and cART is sometimes associated with improved cognitive function.4 Nevertheless, cognitive deficits can persist in treated HIV infection,3 with some suggesting that the neuropsychological impairment pattern changes, rather than its prevalence.5 Factors such as comorbidity burden, cognitive reserve, nadir T-helper (CD4) cell count, and age may also contribute to cognitive impairment.6⇓⇓–9
While CD4 cell count and viral load are generally used to diagnose infection and monitor treatment response, they do not necessarily reflect the direct and indirect brain effects of HIV infection. HIV enters the central nervous system soon after infection10 and persists after treatment.11 Before the cART era, CSF HIV RNA levels correlated with the severity of cognitive impairment12 but cART reduced CSF levels of HIV-1 RNA.13 Nevertheless, with cART there is no strong association between cognitive impairment and concurrent CSF or peripheral viral load,14 and several studies have shown that cognitive impairment may develop during viral suppression.15⇓⇓–18
Neuropsychological testing is often used to estimate HIV CNS effects, even though assessment is time-intensive and possibly subject to practice effects.19 Nevertheless, the HIV neuropsychological profile associated with cognitive impairment is debated,5,9,20 suggesting that behavioral measures may not be optimal for measuring the ongoing CNS involvement.
The absence of measurable, consistent cognitive changes related to HIV disease activity motivates the search for objective biomarkers of the CNS effects of HIV infection. Histopathologic evidence of HIV infection effects ranges from inflammation associated with gliosis and increased perivascular macrophages to degenerative pathology manifested as diffuse myelin pallor and axonal damage.21,22 This evidence of white matter involvement has led to cross-sectional studies with diffusion tensor imaging to study WM microarchitecture following HIV infection, with many finding decreased fractional anisotropy (FA)21,23⇓⇓⇓⇓⇓⇓⇓⇓–32 and increased mean diffusivity (MD).21,26,29,30,32,33 However, there have also been puzzling inconsistencies, with studies demonstrating results of opposite polarity, namely increased FA and decreased MD in the corpus callosum or other WM tracts.30,31,33⇓–35 It would be useful to have consistency estimates of any serostatus effects across studies and temporal reliability estimates of these effects in individuals to evaluate the utility of using WM microstructure measures for tracking the progression of HIV infection in the brain.
These issues prompted us to first do a meta-analysis of studies reporting callosal microstructure changes following HIV infection and then to examine the longitudinal stability of WM microstructural measures in seropositive participants before the initiation of cART and 3 and 6 months thereafter.
Materials and Methods
Meta-Analysis of HIV Effects in the Corpus Callosum
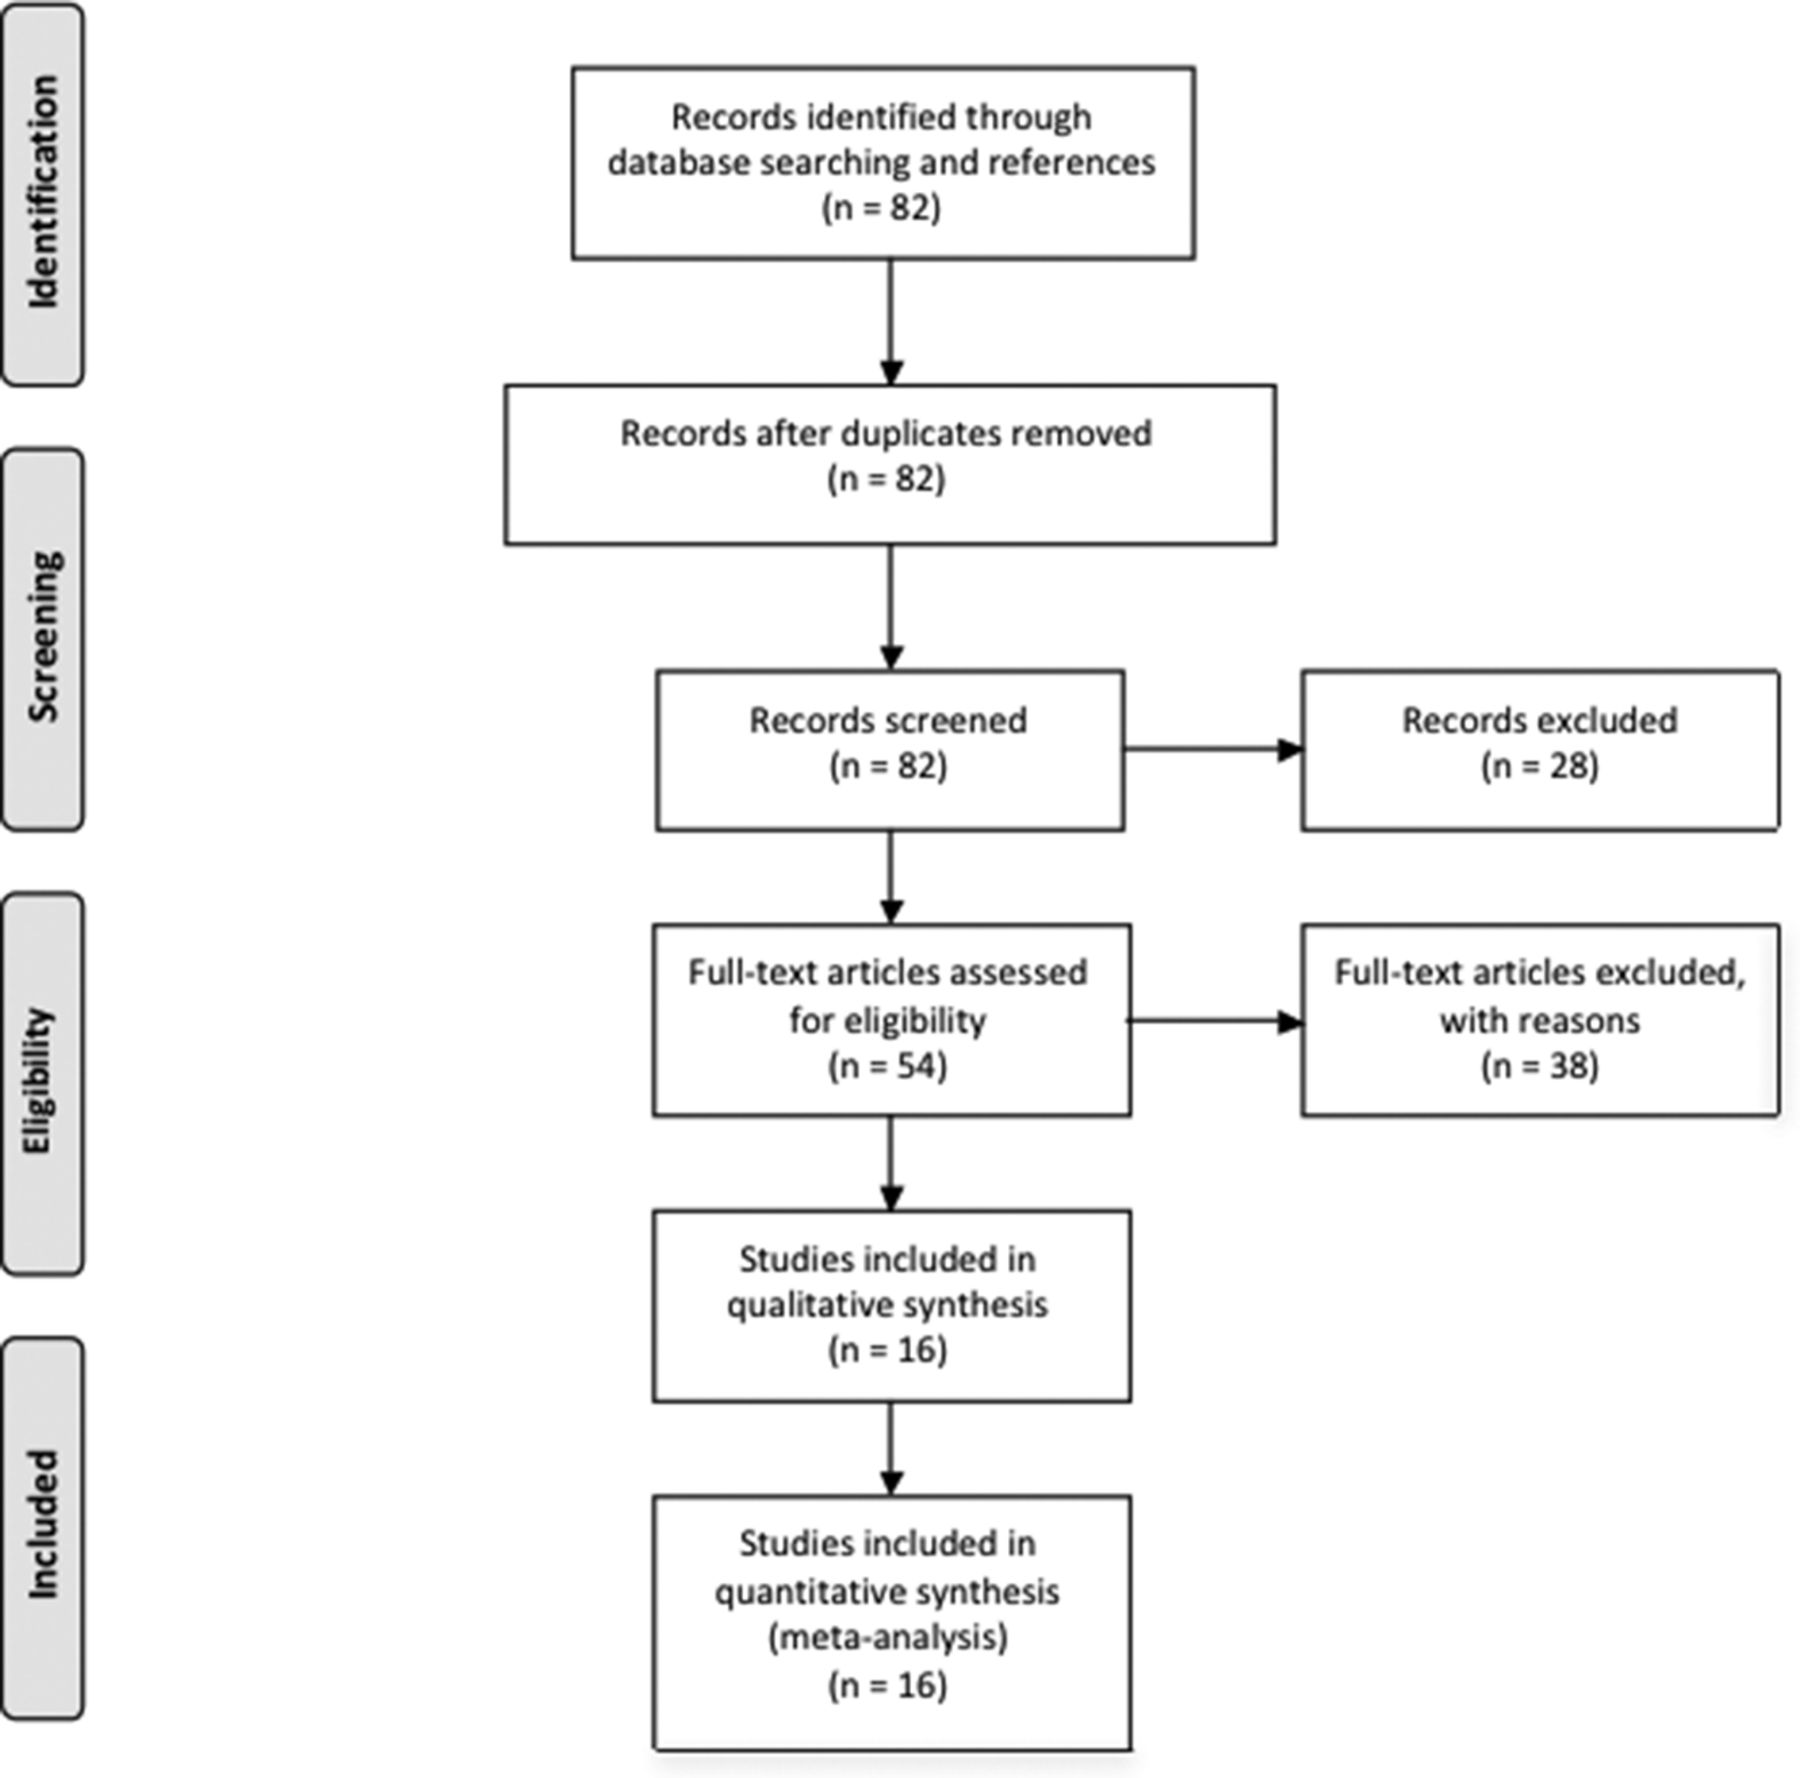
To summarize the literature on WM microstructure changes associated with HIV infection, we performed a computerized literature PubMed search on April 25, 2016, by using the terms “(“hiv”[MeSH Terms] OR “hiv”) AND (“brain”[MeSH Terms] OR “brain”[All Fields]) AND (“diffusion tensor imaging”[MeSH Terms] OR (“diffusion”[All Fields] AND “tensor”[All Fields] AND “imaging”[All Fields]) OR “diffusion tensor imaging” [All Fields]),” yielding 82 records. Of these, 28 studies were excluded for the following reasons: 1) Studied participants were not infected with HIV, 2) studies were performed in animal models, 3) they were review articles, 4) they were case reports, or 5) they examined participants with perinatal HIV exposure who were not infected. Given the variability in the ROIs from which FA and MD were measured, we chose to focus on the corpus callosum because it is the largest WM fiber tract in the brain and was the most frequent measurement target.
Of the 54 eligible full-text articles, 16 cross-sectional studies of patients with HIV infection and controls that were completed between 2001 and 2016 were included in the meta-analysis, with 12 studies reporting both FA and MD values and 4 studies reporting only FA values. Because 3 articles did not report complete FA and MD values, the results were obtained from the authors. The remaining studies were excluded for the following reasons: 1) Numeric values for FA and MD were not reported for either seropositive or seronegative participants (authors of these articles were contacted in an effort to obtain the missing values); 2) only whole-brain FA or MD was reported; 3) the studies examined the relationships of clinical variables, biomarkers, or treatment on DTI measures without including a seronegative control group; 4) FA and MD were not measured in the corpus callosum; 5) prior published DTI data were used for fMRI connectivity analysis ROI selection; 6) a single case-control pair was reported; 7) the study focused on imaging measures other than diffusion parameters; or 8) the article reported a new processing algorithm for DTI data (Fig 1). See the On-line Appendix for excluded study references. Mean FA and MD values and their SDs were taken from the article tables, or the corresponding author was contacted if results were presented in a different form.

Flow diagram showing selection of articles examining WM microstructure changes in HIV infection for the meta-analysis.82
We used the R meta-analysis library meta36 to estimate the standardized mean difference (SMD) in FA or MD for each study and then calculated a weighted average of these estimates across studies. If multiple values for callosal subregions were reported in a study, we used their average in inverse-variance–weighted random-effects models, estimating the mean effect and incorporating estimates of between-study variation in the weighting of each study. I2 was used to estimate study heterogeneity.37,38 Study bias was checked by examining plots of sample size versus effect size. Meta-regression was used to examine imaging protocol effects.
Meta-Analysis of Callosal Regional Variation in HIV Serostatus Effects
Eight of the selected studies reported FA, MD, axial diffusivity (AD), and radial diffusivity (RD) for callosal subregions, including the genu, body, and splenium. Because qualitative examination of the values revealed anatomic variation in diffusion measures, we performed a separate repeated-measures, mixed-effects regression analysis, examining regional and serostatus effects on callosal diffusion measures. If the callosal microstructure exhibited regional variation, differential regional sampling across studies could result in high experimental error.
Comparison Study
To compare the meta-analysis serostatus effects with a new sample and to characterize within-subject temporal variations in diffusion measures, we collected longitudinal DTI in seropositive participants before the initiation of cART and 3 and 6 months thereafter, comparing the results with those in a seronegative control group.
After we obtained Temple University institutional review board approval and consent, 10 seropositive participants, 22–50 years of age, cART-naive but ready to begin antiretroviral therapy, were studied. Nine were followed longitudinally for 6 months. We excluded participants who met the Diagnostic and Statistical Manual of Mental Disorders-IV criteria for substance dependence or abuse in the past 6 months and/or who had other major psychiatric disorders, neurologic illnesses unrelated to HIV, MR imaging contraindications, cancer, hepatic disease, renal disease, cardiac disease, or pulmonary disease.
The serologic status of HIV participants was confirmed by positive HIV enzyme-linked immunoassay and Western blot or detection of plasma HIV RNA by the polymerase chain reaction. Plasma viral load, CD4, and CD8 T-cell counts were collected before initiation of cART and from 0.5 to 6.0 months after beginning therapy. Urine toxicology was collected before each imaging visit, testing the presence of marijuana, cocaine, opiates, methamphetamines, barbiturates, benzodiazepines, and phencyclidine. Participants testing positive for any of these substances with the exception of marijuana were excluded.
For comparison, 12 seronegative participants 21–26 years of age were studied once. None of this group reported past or present symptoms of a major psychiatric or neurologic disorder or head injury with loss of consciousness or were taking psychoactive medications.
To assess posttreatment cognitive and motor performance, we gave participants a brief test battery for psychomotor function, dexterity, learning, and memory skills, including the International HIV Dementia Scale,39 the Hopkins Verbal Learning Test,40 the HIV-Dementia Motor Scale,41 the Unified Parkinson's Disease Rating Scale motor examination,42 and the Grooved Pegboard Test.43
Neuroimaging was performed with a 3T Verio MR imaging system (Siemens, Erlangen, Germany) equipped with a 12-channel matrix head coil. We performed the following scans: a high-resolution, 3D sagittal T1-weighted, magnetization-prepared rapid acquisition of gradient echo (TR/TE/flip angle = 1600 ms/2.5 ms/9°, 256 × 256 matrix, 1-mm3 voxels); a 2D multisection oblique axial T2-weighted fast spin-echo (TR/TE = 3000 ms/85 ms, 320 × 320 matrix, 5-mm3 voxels); and DTI for WM microstructure assessment (2.0 × 2.0 × 2.2 mm voxels, TR/TE/flip angle = 14,700 ms/95 ms/90°, and 30 diffusion gradient directions with b-values of 0 and 1000). Images were inspected at the time of scanning, and a repeat scan was performed if motion artifacts were observed.
DTI data were preprocessed with a script implementing gradient direction, head motion, and eddy current correction by using the FMRIB 5.0 Diffusion Toolbox (FDT; (http://fsl.fmrib.ox.ac.uk/fsl/fslwiki/FDT).44 Quality assurance involved visual inspection of the individual images and elimination of corrupted images. FA, MD, RD, and AD values were computed for all voxels after we fitted a tensor model to the corrected diffusion data with FDT.
The FA map for each subject was then aligned with an FA atlas FMRIB58_FA (www.fmrib.ox.ac.uk/fsl/data/FMRIB58_FA) with the FMRIB Nonlinear Registration Tool (FNIRT; http://fsl.fmrib.ox.ac.uk/fsl/fslwiki/FNIRT).45 Next, a mean FA image was created and thinned to create a mean FA skeleton representing the centers of all tracts common to the group. Then each subject's aligned FA data were projected onto the mean skeleton. The skeleton-creation steps are part of the Tract-Based Spatial Statistics (TBSS; http://fsl.fmrib.ox.ac.uk/fsl/fslwiki/TBSS) procedure.46
To increase the robustness of the measures and to facilitate the interpretation of the results, we averaged the different measures over the skeleton delimited by ROIs obtained from the ICBM-152 atlas,47 previously aligned with the FNIRT procedure in the FMRIB58_FA common atlas, sampling the genu, body, and splenium callosal subregions (On-line Fig 1).
Results
Meta-Analysis
Meta-analysis of serostatus effects on callosal microstructure revealed a small reduction in FA (SMD = −0.43; 95% CI, −0.65 to −0.21) related to serostatus (test of SMD = 0: z = −3.82, P < .001), with high study heterogeneity (Q = 40.7, df = 17, P = .001, and I2 [variation in SMD attributable to heterogeneity] = 58%). The τ2 of between-study variance was 0.12. Eleven of the 16 studies had confidence intervals that included zero (Fig 2A).

Meta-analysis results for HIV-positive versus HIV-negative comparisons of fractional anisotropy and mean diffusivity. A, FA differences (SMD = −0.43; 95% CI, −0.65 to −0.21; test of SMD = 0: z = −3.82; P < .001). B, MD differences (SMD = +0.44; 95% CI, 0.15–0.72; test of SMD = 0: z = 3.00; P = .003).
Meta-analysis of MD revealed a significant increase (SMD = +0.44; 95% CI, 0.15–0.72) related to serostatus (test of SMD = 0: z = 3.00, P < .003), with high study heterogeneity (Q = 38.4, df = 13, P = .0003, and I2 = 66.0%). The estimate of between-study variance τ2 was 0.18 (Fig 2B). Therefore, meta-analysis of both FA and MD revealed a small but statistically significant, change related to serostatus. Nevertheless, the observed high study heterogeneity suggests the existence of other unexplained experimental effects.
Because both FA and MD serostatus group differences were associated with high between-study heterogeneity, it was possible that the observed group differences in WM microstructure resulted from variations in image-acquisition parameters or biologic variables. For image-acquisition parameters reported by the constituent publications, mixed-effects meta-regression revealed no significant effects on callosal FA and MD from variations in field strength (range, 1.5T–4T), voxel volume (range, 1.5–20 mm3), and diffusion direction number (range, 6–64). Mixed-effects meta-regression also revealed no significant effects of the biologic variables age (range, 27–53 years) and CD4 count (range, 211–678). In addition, there was no apparent trend in the DTI measures during the period spanned by the studies (2001–2016). Perhaps due to the relatively small sample of available studies, none of the variables examined appear to explain the high heterogeneity seen in the meta-analyses of FA or MD effects. Examination of funnel plots did not reveal asymmetries suggestive of bias.
To investigate the possibility that the high between-study heterogeneity arose from DTI processing variations, we coded studies according to whether the FSL/TBSS method was used, because it uses a unique step in which the FA maps are “skeletonized” to reduce potential partial volume effects. Meta-regression revealed a nonsignificant (P = .08) trend for FSL/TBSS processing being associated with higher FA values. Details of acquisition and processing for each study can be found in On-line Table 1.
Given some regional variation in measures, the observed between-study heterogeneity in callosal FA and MD group differences might also have resulted from sampling and combining diffusion measures from different callosal segments in different studies. To more closely examine callosal regional variations in FA and MD related to serostatus, we used repeated-measures multilevel models with region and serostatus as fixed effects and study as a random effect in the 8 studies providing all 4 diffusion measures for 3 callosal subregions. For both FA and MD, we found significant regional effects, with the splenium having higher FA and lower MD than the body and splenium. Thus, the callosal region sampled appears to have a strong effect on group estimates of WM microstructure (On-line Appendix, On-line Tables 2 and 3, and On-line Figs 1 and 2).
Comparison Study
For comparison with the meta-analysis, we collected DTI data from seropositive and seronegative participants for cross-sectional and longitudinal examination of WM microstructure changes.
Nine of 10 seropositive participants in our sample successfully completed 3 imaging visits, and 12 seronegative controls completed 1 visit. Although the mean age for our seropositive subjects (30.7 ± 9.5 years) was greater than that of controls (23.3 ± 1.8 years), age variations over this range are not known to result in variations in diffusion measures,48 a finding consonant with the negative age meta-regression results reported above. While we would expect that the slightly older age of our seropositive cohort could potentially decrease the FA, this decrease was not observed. Seropositive participants had fewer years of education (11.9 ± 2.0 years) than controls (17.2 ± 1.7 years). On entry into the study, 6 of the 9 participants were seropositive during screening for sexually transmitted disease. The other 3 participants had signs and symptoms of clinical AIDS, with all 3 presenting with Pneumocystis pneumonia and 1 additionally having herpes zoster and esophageal candidiasis.
Seropositive participants began cART immediately after their first visit. All 9 seropositive participants were treated with at least 3 antiretroviral medications, including nucleoside reverse transcriptase inhibitor and a nucleoside analog, which were taken in combination with nonnucleoside reverse transcriptase inhibitors or an integrase inhibitor. The CNS penetration effectiveness (CPE) rank of each participant's cART regimen was calculated on the basis of a modified version of the CPE, which includes rilpivirine (personal communication, S. Letendre, January 14, 2015). Six participants were on regimens with a CPE rank of 6, and 3 participants had a CPE rank of 7, 1 of whom switched to a regimen with a rank of 6 after 4 months of therapy, and then to one with a rank of 8 after 5 months.
Laboratory testing included serial CD4 and CD8 T-cell counts and viral load, both assessed before initiation of cART and from 0.5 to 6.0 months after the initiation of cART (On-line Table 4). During 24 weeks of therapy, seropositive participants averaged CD4 cell count increases of 6.8 cells/week (P < .001) and accompanying decreases in the log viral load (P < .001), with no change in CD8 cell counts (P = .64). These results are typical responses to cART.
Behavioral assessments revealed that while none of our subjects met the criteria for HIV dementia, a few exhibited mild-to-moderate degrees of impairment in verbal learning, with some subjects exhibiting mild degrees of impairment in motor function (On-line Table 5).
Although HIV infection can result in macroscopic changes in WM, visual inspection of the T1- and T2-weighted images revealed that our participants were generally free of these effects. One seropositive participant exhibited a mild degree of T2 prolongation in the periatrial WM bilaterally. T1- and T2-weighted images were otherwise unrevealing, with no parenchymal lesions, ventriculomegaly, or brain atrophy of the sort frequently reported before the widespread introduction of cART.49,50
To examine the regional pattern of diffusion changes following HIV infection but before treatment began, we compared the seropositive pretreatment ROI values with the seronegative control values, with repeated-measures multilevel models treating serostatus and hemisphere (left hemisphere, midline, and right hemisphere) as fixed effects and subject and ROI as random effects. With FA as the dependent measure, the seropositive group had higher FA values [F(2,21.06) = 14.31, P = .0011]. FA values were also higher in the midline than the hemispheres [F(2,707.98) = 10.92, P < .001] (Fig 3A). With MD as the dependent measure, the seropositive group had lower MD [F(1,76.23) = 18.45, P < .001]. MD values were also higher in the midline compared with the hemispheres [F(2,81.52) = 31.31, P < .001], with a significant serostatus by hemisphere interaction [F(2,81.52) = 3.31, P = .042] (Fig 3B). For RD, we found an effect of serostatus, with the seropositive group showing lower values [F(1,17.40) = 15.16, P < .001] and an effect of hemisphere [F(2,87.58) = 11.37, P < .001], with the midline having a higher RD than the hemispheres. There was also a significant serostatus by hemisphere interaction [F(2,87.58) = 3.77, P = .027] (Fig 3C). For AD, we found an effect of serostatus [F(1,92.12) = 7.03, P = .0095], with the seropositive group exhibiting lower AD and an effect of hemisphere [F(2,98.73) = 0.30, P < .001], with the midline showing higher values than the hemispheres (Fig 3D). Thus, compared with seronegative controls, in the seropositive group, we observed higher FA and lower MD, RD, and AD.

Differences in FA, MD, RD, and AD measures in the seronegative comparison group (CNTL) and seropositive (HIV) participants following HIV infection but before treatment was started. Seropositive participants had higher FA and lower MD, RD, and AD. Measurements from 28 white matter ROIs were aggregated into left hemisphere (L), midline (MID), and right hemisphere (R) regions.
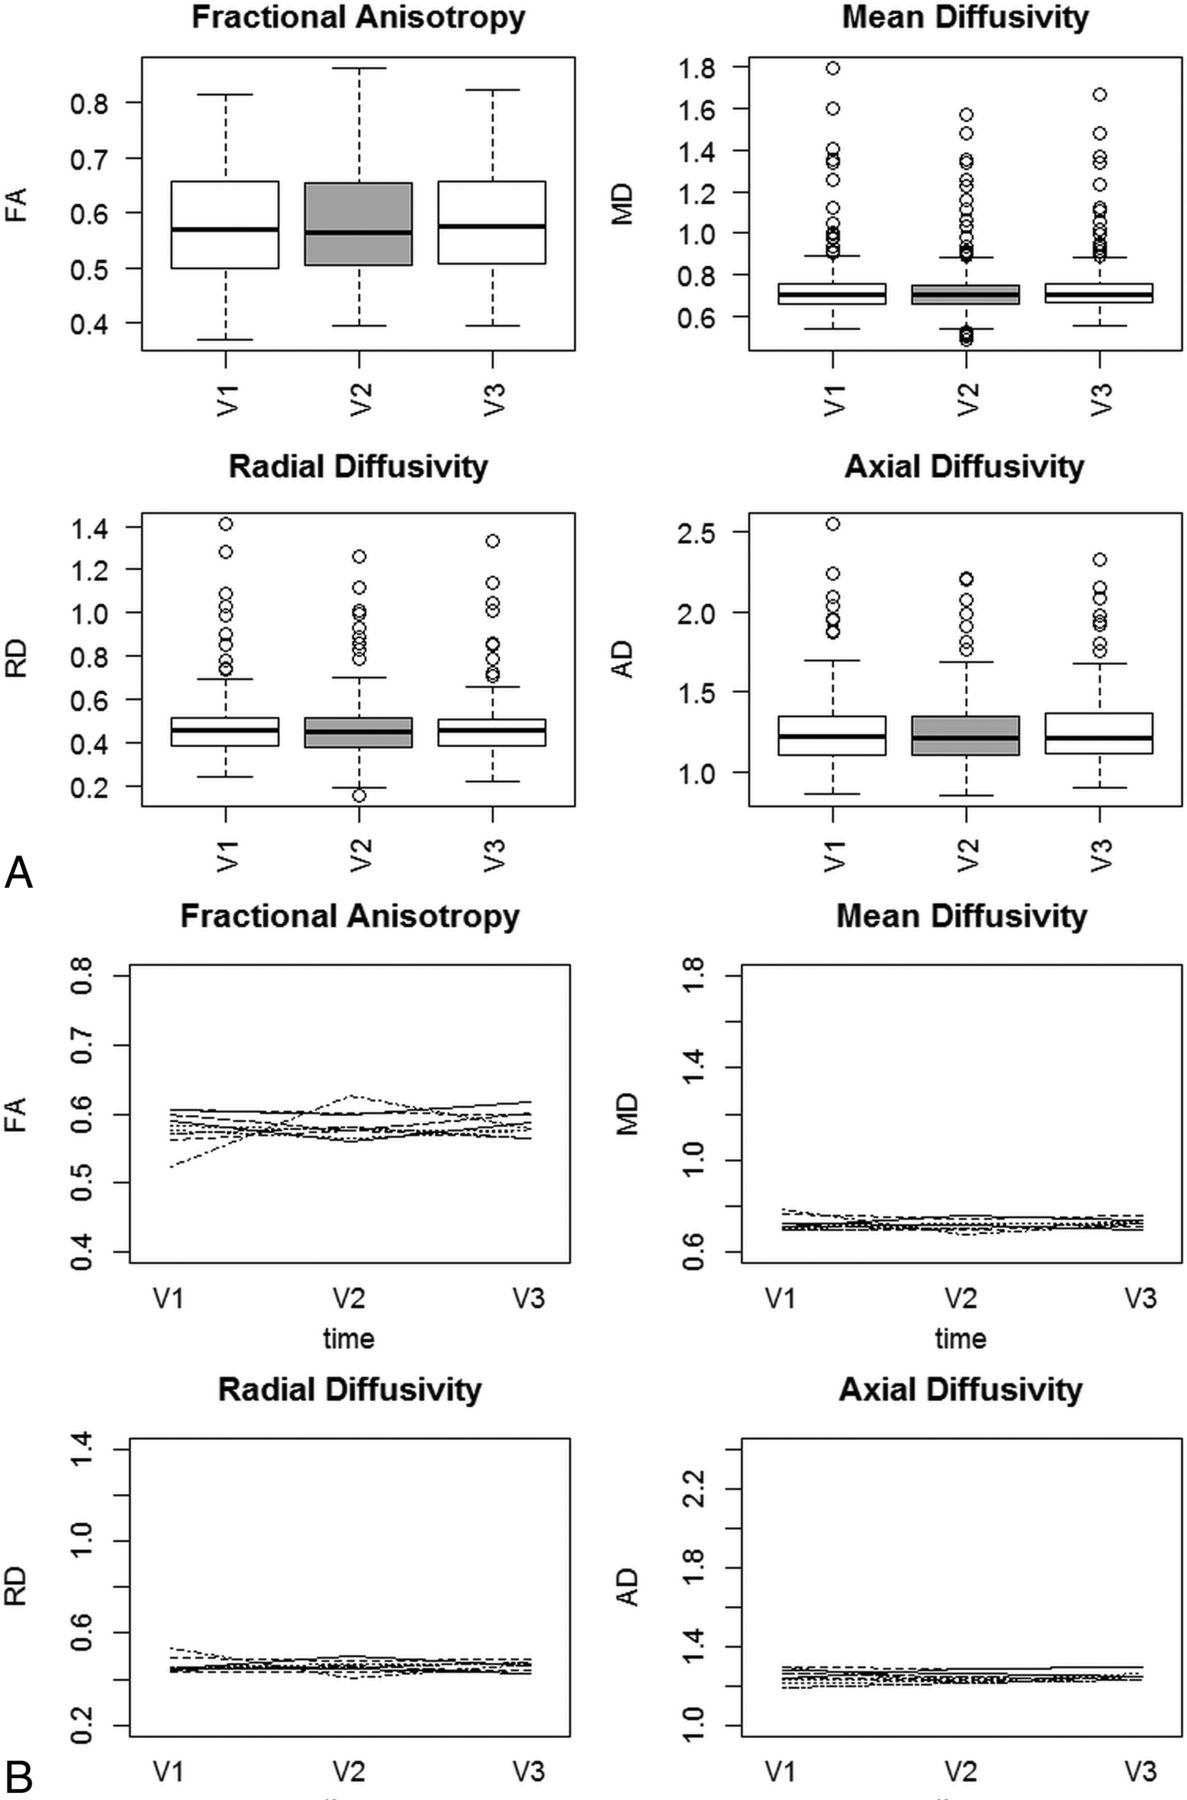
To examine the within-subject reliability of FA, MD, RD, and AD measures, we examined temporal variations in the 4 diffusion measures during 6 months with a 2-way random-effects intraclass correlation coefficient model. Averaging across all 28 WM sampling regions, we observed excellent internal consistency, with Cronbach α scores of FA = 0.91, MD = 0.96, AD = 0.98, and RD = 0.96. Cronbach α indicates the degree to which items measure a single unidimensional latent variable. Intraclass correlation coefficient estimates were also high, with FA intraclass correlation coefficient = 0.97 (95% CI, 0.96–0.97), MD = 0.96 (95% CI, 0.96–.97), AD = 0.98 (95% CI, 0.98–.99), and RD = 0.96 (95% CI, 0.95–.97) (Fig 4A). In addition, examination of individual subject time plots of FA, MD, RD, and AD revealed that all subjects exhibited consistent mean WM architecture estimates across time (Fig 4B).

A, FA, MD, RD, and AD in seropositive participants following HIV infection but before treatment was started. Measurements are aggregated across 28 white matter ROIs.47 Data were collected pretreatment (V1), 3 months later (V2), and 6 months later (V3). B, Individual time plots of FA, MD, RD, and AD in seropositive participants following HIV infection.
Discussion
Summary of Results
Meta-analysis of HIV effects on WM microstructure revealed relatively small changes in FA and MD related to serostatus and high between-study heterogeneity. Variation in image-acquisition parameters across studies did not explain the high heterogeneity. More detailed examination of callosal WM microstructure measures revealed regional variations that could contribute to between-study differences if the same callosal regions were not sampled in each study. In our comparison study, HIV infection was associated with widespread changes in WM microstructure, with increases in FA and decreases in MD, RD, and AD. During a 6-month span, these measures showed excellent reliability, suggesting that within-subject experimental variation does not contribute substantially to high between-study heterogeneity.
HIV Effects on White Matter Microstructure
HIV infection affects cerebral WM through a range of mechanisms. Histopathologic evidence includes inflammation associated with gliosis, an increased numbers of perivascular macrophages, and a type of degenerative pathology, manifested as myelin pallor,22 which is thought to result from breakdown of the blood-brain barrier with resulting vasogenic edema.51 WM metabolite alterations detected with MR spectroscopy paralleled those seen in subcortical gray matter, including elevated Cho/Cr, elevated mIns/Cr, and decreased NAA/Cr ratios,52 with these metabolite differences increasing with disease progression.53 Macrostructural evidence of HIV infection includes cerebral WM volume loss54 and focal hyperintensities seen with T2-weighted imaging.55
DTI revealed changes associated with seropositivity, believed to reflect WM injury from both direct or indirect effects of infection.21,23⇓–25,27⇓⇓–30,32,33,56,57 While these studies have generally found elevated MD and reduced FA in the WM of seropositive participants relative to controls, results vary among the published accounts. These inconsistencies could arise from a number of sources, including pooling observations from both treated and untreated participants,24⇓⇓–27,29⇓–31,58,59 diffusion imaging protocol variations, study sample variations in the duration of infection, age, premorbid and comorbid substance use, comorbid illness such as hepatitis, length and effectiveness of antiretroviral therapy treatment, CNS medication penetration, CD4 nadir, premorbid intelligence, and ethnicity.
Meta-Analysis of HIV Effects on White Matter Microstructure
Meta-analysis of HIV DTI studies revealed wide variation in seropositivity effects on diffusion parameter estimates. If DTI is ever used as a diagnostic marker for HIV infection, high consistency in regional measurements will be required. In addition, there are growing concerns about the reproducibility and reliability of biomedical research,60,61 prompting the National Institutes of Health to focus on initiatives to reduce the frequency and severity of irreproducibility.61 There are many potential sources for the study heterogeneity effects we observed.
The specific choice of MR imaging acquisition parameters, with related SNR variation, might bias measurements of diffusion measures, particularly in higher magnetic fields.62,63 Nevertheless, meta-regression of acquisition parameters across studies did not account for variation in diffusion measures, suggesting that the range of SNR values arising from variation in voxel volume, field strength, and diffusion direction number did not strongly influence FA and MD estimates. Keeping acquisition parameters constant in the comparison study, we observed high within-subject reproducibility across time.
While differences in DTI data-processing techniques may contribute to diffusion measure heterogeneity,63,64 many of the studies included in the meta-analysis did not report data-processing details in sufficient detail to examine their specific effects by using meta-regression or subgroup analysis. Nevertheless, we were able to compare the effects using DTI processing methods that involved skeletonization of diffusion parameter maps with those that did not and observed a trend for FA values being higher when FSL/TBSS style processing was used. The skeletonization step that is a unique aspect of TBSS results in voxel selections that are more likely to contain pure WM, thereby having less contamination from partial volume effects, which might be expected to reduce the apparent directionality of diffusion. This preliminary finding will be explored in a subsequent subject-level meta-analysis of the effects of processing strategy on diffusion parameter estimates in HIV.
While HIV globally affects WM, regional variations in myelination, axon orientation, packing density, and membrane permeability may affect regional measurements.63 Meta-analysis of callosal diffusion measures revealed regional variability, with FA consistently highest in the splenium. Therefore, between-study variation in the selection of subsequently aggregated sampling regions could result in higher between-study heterogeneity.
Differences in cohort characteristics, such as the duration of infection, age, premorbid and comorbid substance use, comorbid illness such as hepatitis, the length and effectiveness of treatment with antiretroviral therapy, CNS penetration effectiveness of the cART regimen, nadir CD4, premorbid intelligence, and ethnicity, may also contribute to a lack of reproducibility. Many studies in our meta-analysis excluded subjects with current drug or alcohol use, but premorbid drug or alcohol use was often not addressed. Chronic alcoholism has been shown to reduce the corpus callosum FA.29,65,66 Studies have also shown corpus callosum FA decreases following cocaine,67 methamphetamine,68 and opiate use.69
WM microstructure cross-sectional studies have shown that FA is lower and MD is higher in older compared with younger adults.70,71 More recently, annual decreases in FA and annual increases in MD, AD, and RD have been shown in a longitudinal healthy cohort, with changes beginning in the fifth decade.48 While we found no evidence for age effects in our meta-analysis, the maximum mean age in these studies was below the age when WM microstructural changes generally begin, highlighting the need to further explore age effects in older patients with HIV.
Higher general intelligence indices have been associated with higher FA and lower MD and RD, in typical middle-aged and older adults,72 with these findings confirmed in studies involving younger adults.73 Some studies used in our meta-analysis had control groups with more years of education than the seropositive participants.
Antiretroviral treatments may be injurious to brain cell elements. To our knowledge, there are no studies examining the effects of cART regimen CPE on WM microstructure. Nevertheless, in a study comparing simple motor task performance in seropositive participants on low- and high-CPE cART regimens, the fMRI response amplitude was significantly greater in the low-CPE group compared with the high-CPE or seronegative groups74; this finding suggests that treatment effects should be explored in future meta-analytic studies with subject-level data.
Two studies in the meta-analysis included HIV-infected participants with hepatitis,27,35 and several studies did not list comorbidities such as chronic liver or renal disease as exclusionary criteria. Hepatitis C coinfection is found in 25%–30% of HIV-infected individuals75 and has been associated with reduced FA and increased MD in the WM, including the corpus callosum.76
Finally, 10 of the 16 studies enrolled patients with longer infection duration than the subjects enrolled in our comparison study. Although the relationship between HIV infection duration and DTI measures is rarely addressed, infection duration can be negatively associated with callosal FA.77
The effects of many of the study characteristics discussed above are difficult to explore with meta-regression because aggregating individual subject variables can result in ecological bias in the resulting parameter estimates.78 Although it was not possible to explore these biologic effects with the tools of study-level meta-analysis, it is very likely that many of these variables contributed strongly to the high observed between-study heterogeneity, motivating further exploration of potential modulating effects of biologic variables with datasets incorporating subject-level measures.
Comparison Study Results
Our study found globally reduced MD and elevated FA in the WM of HIV-infected participants who were naive to antiretroviral therapy. Other studies have reported increased FA values and decreased MD, AD, and RD for multiple corpus callosum regions and the centrum semiovale in cART-naive seropositive participants compared with seronegative controls.30,34 Because cellular membranes hinder water diffusion,79 activation of microglia, astrocytes, and perivascular macrophages associated with early CNS HIV infection may have caused reduced MD and increased FA in our seropositive cohort.80 Because many of the studies in the meta-analysis included patients with longer infection duration than our subjects, the shorter infection duration in our sample might have resulted in different changes in diffusion parameters. Studies reporting higher FA in the seropositive group34,35 included participants with shorter disease durations. The earlier phases of HIV infection might be associated with more robust neuroinflammatory changes, causing diffusion restriction effects resulting in higher FA and lower MD. On examining the details of the studies that agreed with our findings, we noted that the authors studied younger samples, many of whom were untreated at the time of imaging, as in our pilot longitudinal study. There is evidence of an age-by-HIV serostatus interaction, evidenced by higher FA and lower MD in younger individuals and lower FA and higher MD in older individuals in the posterior limbs of the internal capsules, cerebral peduncles, and anterior corona radiata.35 Because most of the studies in the meta-analysis included samples with higher average ages, we believe that this age/serostatus interaction may explain the seeming contradictory results across studies. Unfortunately, we are unable to statistically confirm this explanation, given the study-level data sources used for this meta-analysis. Nevertheless, the biologic interactions among age, serostatus, and WM microstructure is a topic that might be profitably explored in subsequent meta-analyses based on subject-level data.
WM microstructure measures were examined in our seropositive participants at 3 and 6 months after the initiation of cART, demonstrating excellent reliability. We attribute these persistent alterations in WM microstructure, despite the initiation of cART, to the presence of continued activation of microglia and macrophages because this form of continuing inflammation during cART has been documented histologically.81
Global temporal stability of DTI measures was observable at the single-subject level, suggesting that the heterogeneity observed in the meta-analysis did not arise because of random temporal fluctuations in the measurement process. It is possible that use of more uniform imaging protocols and data-processing pipelines across studies will improve between-study reproducibility.
Conclusions
Meta-analysis of DTI results from studies examining the effects of HIV serostatus on WM microstructure revealed high between-study heterogeneity and relatively small changes in measures. Regional variation in callosal WM architecture could contribute to between-study differences if the same callosal regions are not combined for total callosal estimates. In a longitudinal comparison sample, we observed widespread changes related to seropositivity in WM microstructure, with increases in FA and decreases in MD, RD, and AD. Effects of HIV infection on WM microstructure may be age-dependent, related to more prominent neuroinflammatory changes in younger patients. Examination of measures averaged over all brain WM structures during a 6-month span revealed excellent reliability, suggesting that within-subject variation does not substantially contribute to the observed between-study variability. Further work will be required to isolate the sources of variation in WM microstructure estimates in HIV seropositive groups.
Acknowledgments
We gratefully acknowledge the assistance of Drs Schiffito, Wright, Seider, and Cohen for providing values not given in the original articles.
Footnotes
Disclosures: Erin E. O'Connor—RELATED: Grant: National Institute of Mental Health Grant P30 MH092177.* *Money paid to the institution.
This work was partially supported by the Comprehensive NeuroAIDS Center (National Institutes of Health grant P30MH0921777).
Indicates open access to non-subscribers at www.ajnr.org
REFERENCES
- 1.↵
- 2.↵
- 3.↵
- 4.↵
- 5.↵
- 6.↵
- 7.↵
- 8.↵
- 9.↵
- 10.↵
- 11.↵
- 12.↵
- 13.↵
- 14.↵
- 15.↵
- 16.↵
- 17.↵
- 18.↵
- 19.↵
- 20.↵
- 21.↵
- 22.↵
- 23.↵
- 24.↵
- 25.↵
- 26.↵
- 27.↵
- 28.↵
- 29.↵
- 30.↵
- 31.↵
- 32.↵
- 33.↵
- 34.↵
- 35.↵
- 36.↵
- 37.↵
- 38.↵
- 39.↵
- 40.↵
- 41.↵
- 42.↵
- 43.↵
- 44.↵
- 45.↵
- 46.↵
- 47.↵
- 48.↵
- 49.↵
- 50.↵
- 51.↵
- 52.↵
- 53.↵
- 54.↵
- 55.↵
- 56.↵
- 57.↵
- 58.↵
- 59.↵
- 60.↵
- 61.↵
- 62.↵
- 63.↵
- 64.↵
- 65.↵
- 66.↵
- 67.↵
- 68.↵
- 69.↵
- 70.↵
- 71.↵
- 72.↵
- 73.↵
- 74.↵
- 75.↵
- 76.↵
- 77.↵
- 78.↵
- 79.↵
- 80.↵
- 81.↵
- 82.↵
- Received September 15, 2016.
- Accepted after revision March 18, 2017.
- © 2017 by American Journal of Neuroradiology


