
Abstract
BACKGROUND AND PURPOSE: Abnormalities of oligodendrocytes have been reported in surgical specimens of patients with medically intractable epilepsy. The aim of this study was to compare the MR imaging, magnetoencephalography, and surgical outcome of children with oligodendrocytosis relative to focal cortical dysplasia I.
MATERIALS AND METHODS: Oligodendrocytosis included oligodendroglial hyperplasia, oligodendrogliosis, and oligodendroglial-like cells in the white matter, gray matter, or both from children with medically intractable epilepsy. Focal cortical dysplasia I included radial and tangential cortical dyslamination. The MR imaging, magnetoencephalography, type of operation, location, and seizure outcome of oligodendrocytosis, focal cortical dysplasia I, and oligodendrocytosis + focal cortical dysplasia I were compared.
RESULTS: Eighteen subjects (39.1%) had oligodendrocytosis, 21 (45.7%) had focal cortical dysplasia I, and 7 (15.2%) had oligodendrocytosis + focal cortical dysplasia I. There were no significant differences in the type of seizures, focal or nonfocal epileptiform discharges, magnetoencephalography, and MR imaging features, including high T1 signal in the cortex, high T2/FLAIR signal in the cortex or subcortical white matter, increased cortical thickness, blurring of the gray-white junction, or abnormal sulcation and gyration among those with oligodendrocytosis, focal cortical dysplasia I, or oligodendrocytosis + focal cortical dysplasia I (P > .01). There were no significant differences in the extent of resection (unilobar versus multilobar versus hemispherectomy), location of the operation (temporal versus extratemporal versus both), or seizure-free outcome of oligodendrocytosis, focal cortical dysplasia I, and oligodendrocytosis + focal cortical dysplasia I (P > .05).
CONCLUSIONS: Oligodendrocytosis shared MR imaging and magnetoencephalography features with focal cortical dysplasia I, and multilobar resection was frequently required to achieve seizure freedom. In 15% of cases, concurrent oligodendrocytosis and focal cortical dysplasia I were identified. The findings suggest that oligodendrocytosis may represent a mild spectrum of malformations of cortical development.
ABBREVIATIONS:
- EEG
- electroencephalography
- FCD
- focal cortical dysplasia
- ILAE
- International League Against Epilepsy
- MEG
- magnetoencephalography
- MEGSS
- MEG spike sources
- MOGHE
- mild malformation of cortical development with oligodendroglial hyperplasia
- PD
- proton density
- ST
- slice thickness
Malformations of cortical development, including focal cortical dysplasia (FCD), are one of the most commonly encountered pathologic substrates in children with medically refractory epilepsy.1,2 White matter abnormalities including heterotopic neurons, hypomyelination, and gliosis have been reported in patients with focal epilepsy, including epilepsy secondary to FCD.3,4 Oligodendrocytes are the myelinating cells of the central nervous system. Abnormalities of oligodendrocytes have been reported in surgical specimens of patients with medically intractable epilepsy, but without evidence of cortical dyslamination—that is, without evidence of FCD.5⇓⇓⇓⇓⇓–11 As part of our institutional clinical epilepsy case conference and pathology review following an operation, we have noted reports of oligodendroglial hyperplasia, oligodendrogliosis, and oligodendroglial-like cells in the white matter and, in some cases, gray matter, which we collectively referred to as “oligodendrocytosis.” These cases frequently have white matter signal abnormality on MR imaging, a feature also seen in FCD type I.12 As yet, it is not known whether there are clinical or imaging features that could distinguish oligodendrocytosis from FCD type I and whether surgical outcomes differ between these 2 entities. There are several studies that have focused mainly on the histopathologic findings of oligodendrocytosis,6,9,11 but a dearth of studies has systematically compared the presurgical investigations and outcomes of oligodendrocytosis with FCD I. The aim of this study was to compare the MR imaging, magnetoencephalography (MEG), and surgical outcome of oligodendrocytosis relative to FCD I in children with medically intractable epilepsy.
Materials and Methods
Patients
This retrospective study had the approval of the research ethics board from The Hospital for Sick Children. All consecutive children who underwent an epilepsy operation from January 2001 to November 2016 and who had a histologic diagnosis of oligodendrocytosis and/or FCD I were retrospectively identified from the epilepsy surgery data base at our institution.
Histopathology
The surgical specimens were fixed in formalin and serially sectioned tangential to the surface of the cortex. Five-micrometer paraffin sections were stained with hematoxylin-eosin/Luxol fast blue, Periodic Acid Schiff, and Periodic Acid Schiff–diastase. For immunohistochemistry, 5-μm sections were cut from paraffin blocks and mounted on positively charged slides. Immunodetection was performed with the automated BenchMark XT stainer (Ventana, Tucson, Arizona) using the ultraView Universal DAB Detection kit (Ventana). Slides were counterstained with the Hematoxylin II kit (Ventana). Anti-Olig2 antibody (diluted 1:200, Catalog No. AB9610; Millipore, Temecula, California) was used to identify oligodendrocytosis. Olig2 is strongly expressed in oligodendrocyte precursor cells/progenitors and weakly expressed in mature oligodendrocytes. Immunohistochemical staining of the neuronal nuclear antigen (NeuN, 1:2000; Chemicon, Temecula, California) and glial fibrillary acidic protein (GFAP, 1:2000; DakoCytomatin, Glostrup, Denmark) was also performed to distinguish neuronal cells and GFAP-positive astrocytic gliosis from oligodendrocytosis. The histology was assessed by a pediatric neuropathologist. A histologic diagnosis of oligodendrocytosis was confirmed if there was an increased population of cells with round nuclei and a scant amount of cytoplasm in the white matter, with or without gray matter involvement (Fig 1).11

MR imaging features. Axial volumetric T1 shows high T1 signal in the cortex and blurring of the gray-white matter junction in the right inferior frontal gyrus (arrow, A) and thickening of the cortex, high T1 signal in the cortex, and an abnormal sulcation and gyration pattern (arrows, B) in the right temporal lobe. C, Axial proton-density sequence demonstrates high signal in the subcortical white matter (arrows) of the left frontal lobe. D, Axial FLAIR image shows high signal in the cortex (arrow) of the right parietal lobe.
The histologic diagnosis of FCD I was confirmed if there was abnormal radial and/or tangential cortical lamination as per the International League Against Epilepsy (ILAE) criteria.13 Dysmorphic neurons or balloon cells were neither detectable on hematoxylin-eosin stains nor using immunohistochemistry for nonphosphorylated neurofilament proteins.
We also evaluated heterotopic neurons in the white matter and blurring of the gray-white matter junction on histology.
MR Imaging
Patients were scanned with 1.5T MR imaging before January 2008 (n = 15) and with 3T MR imaging after January 2008 (n = 31). The following MR imaging parameters were used on 1.5T Signa LX and CV/I magnets (GE Healthcare, Milwaukee, Wisconsin) with a quadrature head coil: volumetric T1 (TR/TE = 11/4.2 ms, slice thickness [ST] = 2 mm, FOV = 22 cm, matrix = 256 × 192), sagittal T1 (TR/TE = 566/14 ms, ST = 5 mm, FOV = 21 cm, matrix = 256 × 192), axial and coronal proton density (PD)/T2 (TR/TE = 4000/50/100 ms, ST = 5 mm, FOV = 22 cm, matrix = 384 × 224), and FLAIR (TR/TE = 9000/160 ms, ST = 5 mm, FOV = 22 cm, matrix = 256 × 192); and on a 1.5T Achieva scanner (Philips Healthcare, Best, Netherlands) with an 8-channel head coil: volumetric T1 (TR/TE = 10/4.6 ms, ST = 1 mm, FOV = 22 cm, voxel = 1 mm), axial and coronal FLAIR (TR/TE = 7000/140 ms, ST = 5 mm, FOV = 22 cm, matrix 276 × 189), and PD/T2 (TR/TE = 4000/20/100 ms, ST = 5 mm, FOV = 22 cm, matrix = 316 × 207). The following parameters were used on a 3T scanner (Achieva Magnet, Philips Healthcare) with an 8-channel head coil: volumetric T1 (TR/TE = 4.9/2.3 ms, ST = 0.9 mm, FOV = 22 cm, matrix = 220 × 220), axial and coronal FLAIR (TR/TE = 10,000/140 ms, ST = 3 mm, FOV = 22 cm, matrix = 316 × 290), and PD/T2 (TR/TE = 4200/40/80 ms, ST = 3 mm, FOV = 22 cm, matrix = 400 × 272).
The whole MR imaging study of each patient was reviewed by 2 assessors (D.M.-M and E.W.) independently. Discrepancy was resolved by consensus among the 2 assessors. The whole brain was visually inspected for the following MR imaging features: high T1 in the cortex, high T2/FLAIR in the cortex, high T2/PD/FLAIR in the subcortical white matter, increased cortical thickness, and blurring of the gray-white matter junction (Fig 1). The cerebral hemispheres were compared with each other for asymmetry with respect to these features, and suspected areas of abnormality were also compared with the remaining brain in the ipsilateral hemisphere. An abnormal sulcation and gyration pattern was also evaluated.
Magnetoencephalography
MEG recordings were performed using a whole-head gradiometer-based Omega system (151 channels, CTF MEG; Coquitlam, British Columbia, Canada). The procedures for MEG recording and the methods for detecting, localizing, and analyzing interictal MEG spikes have been previously described.14⇓–16 MEG spike sources (MEGSS) were coregistered onto volumetric T1 MR imaging. An MEGSS cluster was defined as ≥6 MEGSS with ≤1 cm between each spike source; scatters consisted of groups of either <6 spike sources regardless of the distance between the spike sources or groups of spike sources with >1 cm between each spike source, regardless of the number of spike sources in the group.14,15 We assessed the location of the MEGSS cluster and whether the cluster was concordant with the surgical resection site. We also evaluated whether there was a spike and wave pattern on the MEG and whether the peak of the MEGSS preceded the peak of electroencephalography (EEG) spike.
Surgical Treatment and Outcome
Surgery-related data collected included invasive monitoring, type of operation (focal/lobar resection, multilobar resection, or hemispherectomy), and location of the operation (temporal, extratemporal, or both). Seizure outcome was classified using the International League Against Epilepsy classification as follows: class 1, completely seizure-free; class 2, only auras, no other seizures; class 3, 1–3 seizure days per year ± an aura; class 4, 4 seizure days per year to 50% reduction of baseline seizure days ± auras; class 5, <50% reduction of baseline seizure days ± auras; and class 6, >100% increase of baseline seizure days ± an aura.17 Subsequently, patients were classified as seizure-free (ILAE I) or having persistent seizures (ILAE II–VI) as well as good (ILAE I–IV) versus poor (ILAE V–VI) seizure outcomes.
Analysis and Statistics
Statistical analyses were performed using JMP Pro 13 (SAS Institute, Cary, North Carolina). A P value < .01 was considered significant to account for multiple comparisons. We conducted the analysis in 2 steps: First, we compared the clinical variables, MR imaging, video-EEG, and MEG features, as well as outcomes across the 3 groups, oligodendrocytosis, FCD I, and oligodendrocytosis + FCD I using ANOVA for continuous variables or the χ2 test for categoric data. For those variables that were significant in the above analysis, we then compared oligodendrocytosis versus FCD I using a t test for continuous variables or the χ2 test or Fisher exact test for categoric data.
Results
Subjects
Forty-six patients (age at the operation = 10.6 ± 5.3 years, male = 24 [52.2%], age at seizure onset = 4.7 ± 4.6 years, duration of epilepsy = 6.4 ± 3.9 years) were included in this study. Of these, 18 (39.1%) patients had oligodendrocytosis (Fig 2), 21 (45.7%) had FCD I, and 7 (15.2%) had oligodendrocytosis + FCD I (Fig 3 and Table 1). There was no significant difference in age at the operation between patients with oligodendrocytosis, FCD I, and oligodendrocytosis + FCD I (P = .71). Patients who had oligodendrocytosis + FCD I had a relatively younger age at seizure onset (2.44 ± 1.7 years) and a longer duration of epilepsy (10.4 ± 5.6 years) compared with those with only oligodendrocytosis (6.2 ± 4.8 years and 6.3 ± 3.9 years, respectively) or FCD I (4.6 ± 4.9 years and 6.5 ± 4.1 years, respectively), though the years were not statistically significant (all P > .01). There were no significant differences in preoperative seizure frequency or the number of antiepileptic drugs across the 3 groups (all P > .01). There was no significant difference in the type of seizures among those with oligodendrocytosis, FCD I, or oligodendrocytosis + FCD I (P = .60). Fifteen patients (83%) with oligodendrocytosis, 17 (81%) with FCD I, and 6 (86%) with oligodendrocytosis + FCD I had focal epileptiform discharges (P = .95).
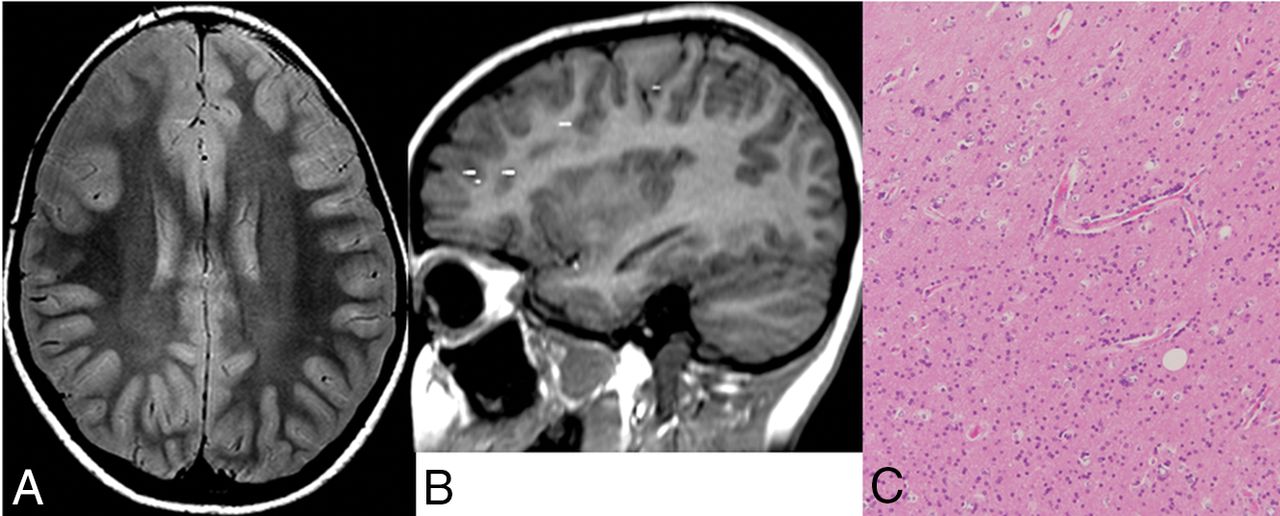
Case with oligodendrocytosis only. A, Axial proton density shows increased signal in the subcortical white matter of right frontal lobe. B, MEG demonstrates dipole scatter in the right frontal lobe. C, Hematoxylin-eosin stain magnification 10X demonstrates hypercellularity of oligodendroglial-like cells, with round nuclei and a scant amount of cytoplasm, in keeping with oligodendrocytosis.

Case with oligodendrocytosis + focal cortical dysplasia type I. A, Coronal FLAIR shows increased FLAIR signal in the white matter of the right parahippocampal and fusiform gyri. B, MEG shows a dipole cluster in the right temporal and occipital lobes. Hematoxylin-eosin stain magnification 10X demonstrates abnormal radial cortical lamination, in keeping with FCD I (C), and hypercellularity of oligodendroglial-like cells with round nuclei and scant amount of cytoplasm (D), in keeping with oligodendrocytosis.
Patient characteristics
Of 18 patients with only oligodendrocytosis, 5 (27.7%) showed oligodendrocytes only in white matter; 1 (5.6%), only in gray matter; and 12 (66.7%), in both gray and white matter. Of 7 patients with oligodendrocytosis + FCD I, 4 (57.1%) showed oligodendrocytes only in white matter; 1 (14.3%), only in gray matter; and 2 (28.6%), in both gray and white matter. Heterotopic neurons were identified in the subcortical white matter in 6 (33.3%) with oligodendrocytosis, 4 (57.1%) with oligodendrocytosis + FCD I, and 10 (47.6%) with FCD I. Blurring of the gray-white matter junction on histology was present in 3 (16.7%) with oligodendrocytosis, 1 (14.3%) with oligodendrocytosis + FCD I, and 2 (9.5%) with FCD I.
MEG
There was no significant difference across the 3 groups regarding the MEG features, including the presence of an MEGSS cluster, concordance of the MEGSS cluster with surgical resection, spike and wave patterns on MEG, and the peak of MEGSS preceding EEG spike (all P > .01) (Table 2). Twelve (67%) patients with oligodendrocytosis had an MEGSS cluster that was concordant with the surgical resection in all 12 patients (100%). Eighteen (86%) patients with FCD I had an MEGSS cluster that was concordant with the surgical resection site in 17 patients (94%). Five (71%) patients with oligodendrocytosis + FCD I had an MEGSS cluster that was concordant with the surgical resection in all 5 patients (100%).
MRI and magnetoencephalography features
MR Imaging
Nine patients (3 with oligodendrocytosis, 5 with FCD I, and 1 with oligodendrocytosis + FCD I) had normal MR imaging findings; 6 (66.7%) scans were performed on 3T, and 3 (33.3%), on a 1.5T magnet.
There were no significant differences among oligodendrocytosis, FCD I, and oligodendrocytosis + FCD I with respect to high T1 signal in the cortex (28% versus 19% versus 43%, respectively; P = .44), high T2/FLAIR in the cortex (11% versus 29% versus 14%, respectively; P = .40), high T2/PD/FLAIR in the subcortical white matter (72% versus 67% versus 86%, respectively; P = .57), increased cortical thickness (0% versus 14% versus 29%, respectively; P = .10), blurring of gray-white matter junction (17% versus 14% versus 43%, respectively; P = .24), or abnormal sulcation and gyration pattern (6% versus 0% versus 29%, respectively; P = .03) (Table 2).
Surgical Treatment and Outcome
There were no significant differences in invasive monitoring (P = .09), extent of resection (unilobar versus multilobar versus hemispherectomy) (P = .37), or location of the operation (temporal versus extratemporal versus both) (P = .10) among patients with oligodendrocytosis, FCD I, and oligodendrocytosis + FCD I (Table 3). Seizure-free outcome at 1 year after the operation was not significantly different among patients with oligodendrocytosis (72%), FCD I (57%), and oligodendrocytosis + FCD I (57.1%) (P = .58). Good (ILAE I–IV) seizure outcome was not significantly different among (100%), FCD I (76.2%), and oligodendrocytosis + FCD I (100%) (P = .35) (Table 3).
Operation and seizure outcome
Discussion
To our knowledge, this is the first study that has systematically compared the MEG, MR imaging, and outcome data of oligodendrocytosis with FCD I. We have found that oligodendrocytosis has MR imaging, MEG, and surgical outcomes similar to those in patients with FCD I and some patients have oligodendrocytosis + FCD I. Approximately half of those with oligodendrocytosis underwent multilobar resection, similar to patients with FCD I. In addition, those with oligodendrocytosis have seizure-free surgical outcomes similar to those with FCD I.
Different terminology has been used to describe oligodendroglial abnormalities in the literature, including oligodendroglial hyperplasia,5,6,10 clusters of oligodendroglia,7 oligodendroglial hamartoma,8 and oligodendroglial-like cells.9,11 These lesions may represent a spectrum of the same abnormality. More recently, Schurr et al6 reported an increased in Olig2-immunoreactive oligodendroglial-like cells and increased proliferation activity in patients who had surgical resection for medically intractable epilepsy, which was termed “mild malformation of cortical development with oligodendroglial hyperplasia” (MOGHE). These patients also had blurring of gray-white matter boundaries due to heterotopic neurons in the white matter on histology. In our study, an increased number of cells that stain for the anti-Olig2 antibody were used to identify oligodendrocytosis, which occurred in the white matter, with or without gray matter involvement. However, we did not include blurring of the gray-white matter junction, increased heterotopic neurons, or increased proliferation activity as criteria for oligodendrocytosis. Oligodendroglial-like cells have been reported in larger numbers in pediatric patients with medically intractable epilepsy compared with controls.9 Recurrent seizures in medically intractable epilepsy may promote oligodendrogenesis because oligodendrogenesis and differentiation are promoted by action potential firing.18 However, whether oligodendrocytosis constitutes a cause or consequence of epilepsy is yet to be determined.
Oligodendrocytosis shared similar MR imaging features with FCD I. An abnormal sulcation and gyration pattern was seen in those with oligodendrocytosis or oligodendrocytosis + FCD I, but not in FCD I, though this was identified in only a small number of patients. None of the children with oligodendrocytosis in our study had cortical thickening, while a small proportion of those with FCD I and oligodendrocytosis + FCD I had cortical thickening, though it was not statistically significant. Although Schurr et al6 did not systematically compare the presurgical investigations of patients with MOGHE relative to FCD, they reported that the MR imaging of patients with MOGHE revealed blurring of the gray-white matter junction and signal abnormality in the subcortical white matter, which led to the presurgical hypothesis of an underlying FCD. Hamilton and Nesbit5 also reported a case of oligodendroglial hyperplasia with cortical thickening and indistinctness of the gray-white junction, which are features seen in FCD.
We have found that 15% of patients in our cohort have oligodendrocytosis and FCD I. Furthermore, there were no features that distinguish oligodendrocytosis from FCD I on MR imaging and MEG, suggesting that oligodendrocytosis may represent a spectrum of mild malformations of cortical development. In the study by Schurr et al,6 none of the patients with oligodendroglial hyperplasia had abnormal radial microcolumns or horizontal dyslamination. However, the authors considered this entity a mild spectrum of malformations of cortical development and have labeled this MOGHE because the MR imaging features suggested FCD. Although Hamilton and Nesbit5 did not identify FCD I in their case of oligodendroglial hyperplasia, the authors suggested that this could be the mildest end of the spectrum of a neuronal migrational disorder or microdysgenesis. In a recent study, Scholl et al19 also identified oligodendroglial hyperplasia in malformations of cortical development, with the exception of FCD IIb and cortical tubers.
We found that patients with oligodendrocytosis frequently underwent multilobar resection, and about 40% of patients with oligodendrocytosis have combined temporal and extratemporal epilepsy, similar to those with FCD I. Sakuma et al9 reported increased oligodendroglial-like cells in children who underwent extratemporal (50%) and both temporal and extratemporal (40%) resection. Fifteen (50%) children with oligodendroglial-like cells underwent multilobar resections, indicating that these children have an extensive epileptogenic network. Schurr et al6 reported oligodendroglial hyperplasia in patients with frontal lobe epilepsy. However, only a third of their patients were seizure-free, suggesting that these patients have a wide epileptogenic network that was not completely resected. Seizure-free outcome in our patients was higher than that in the study by Schurr et al,6 likely related to more extensive surgical resection in our patient population.
There are some limitations to our study. We have not counted the number of cells in oligodendrocytosis. An increased number of oligodendroglial cells were based on visual assessment of histology by a pediatric neuropathologist. We believe that expert assessment of increased oligodendroglial cells has face validity. Schurr et al6 have semi-quantitatively measured the oligodendroglial cell densities from surgical specimens of patients with medically refractory epilepsy, whose neuropathology reports indicated an increased number of subcortical oligodendroglial cells. Findings in the neuropathology reports were based on visual assessment of histology, which was concordant with a semiquantitative measurement of increased oligodendroglial cell densities. We have compared the presurgical evaluation and surgical outcome of oligodendrocytosis with FCD I, but not with FCD II because FCD II is usually a more focal pathology compared with FCD I, requiring focal rather than multilobar resection, and has better surgical outcomes than FCD I.20⇓–22 We may have underestimated the number of patients with oligodendrocytosis + FCD I because surgical sampling for histologic examinations may fail to identify areas of FCD I in patients with oligodendrocytosis, and vice versa.
Another limitation is related to the retrospective nature of the study, whereby inclusion of patients was dependent on surgical resection and a histologic diagnosis of FCD I and/or oligodendrocytosis. Patient selection for an operation is frequently dependent on the ability to identify a lesion on MR imaging and localize the epileptogenic zone with video-EEG and/or MEG. It is possible that some patients with oligodendrocytosis did not undergo an operation for a variety of reasons, such as subtle changes on MR imaging, including a mild abnormal sulcation/gyration pattern, that were not detected or due to failure to localize the epileptogenic zone on video-EEG or MEG.
Conclusions
We have found that oligodendrocytosis shared similar MR imaging and MEG features with FCD I, and multilobar resection was required to achieve seizure freedom, similar to FCD I. In 15% of cases, we identified concurrent oligodendrocytosis + FCD I. The findings from this study lend support to the notion that oligodendrocytosis may represent a mild spectrum of malformation of cortical development, similar to FCD I.
Footnotes
Disclosures: Elysa Widjaja—UNRELATED: Grants/Grants Pending: Canadian Institute of Health Research, Ontario Brain Institute.* *Money paid to the institution.
Drs Yasushi Iimura and Hiroshi Otsubo were supported by EpLink, the Epilepsy Research Program of the Ontario Brain Institute. The Ontario Brain Institute is an independent nonprofit corporation, funded partially by the Ontario government.
The opinions, results, and conclusions are those of the authors, and no endorsement by the Ontario Brain Institute is intended or should be inferred.
References
- Received August 8, 2018.
- Accepted after revision September 19, 2018.
- © 2018 by American Journal of Neuroradiology


