
Abstract
BACKGROUND AND PURPOSE: Glycosaminoglycan chemical exchange saturation transfer (gagCEST) imaging allows the direct measurement and mapping of glycosaminoglycans. In this study, we aimed to evaluate the usefulness of gagCEST imaging in the quantitative assessment of intervertebral disc degeneration in a comparison with Pfirrmann grade and T1-ρ measurements.
MATERIALS AND METHODS: Ninety-six lumbar intervertebral discs in 24 volunteers (36.0 ± 8.5 years of age, 21 men and 3 women) were examined with both gagCEST imaging and T1-ρ measurements. The gagCEST imaging was performed at 3T with a saturation pulse with 1.0-second duration and the B1 amplitude of 0.8 μT followed by imaging by a 2D fast spin-echo sequence. The Z-spectra were obtained at 25 frequency offsets from −3 to +3 ppm (step, 0.25 ppm). A point-by-point B0 correction was performed with a B0 map. The gagCEST signal and T1-ρ values were measured in the nucleus pulposus in each intervertebral disc. The Pfirrmann grades were assessed on T2-weighted images.
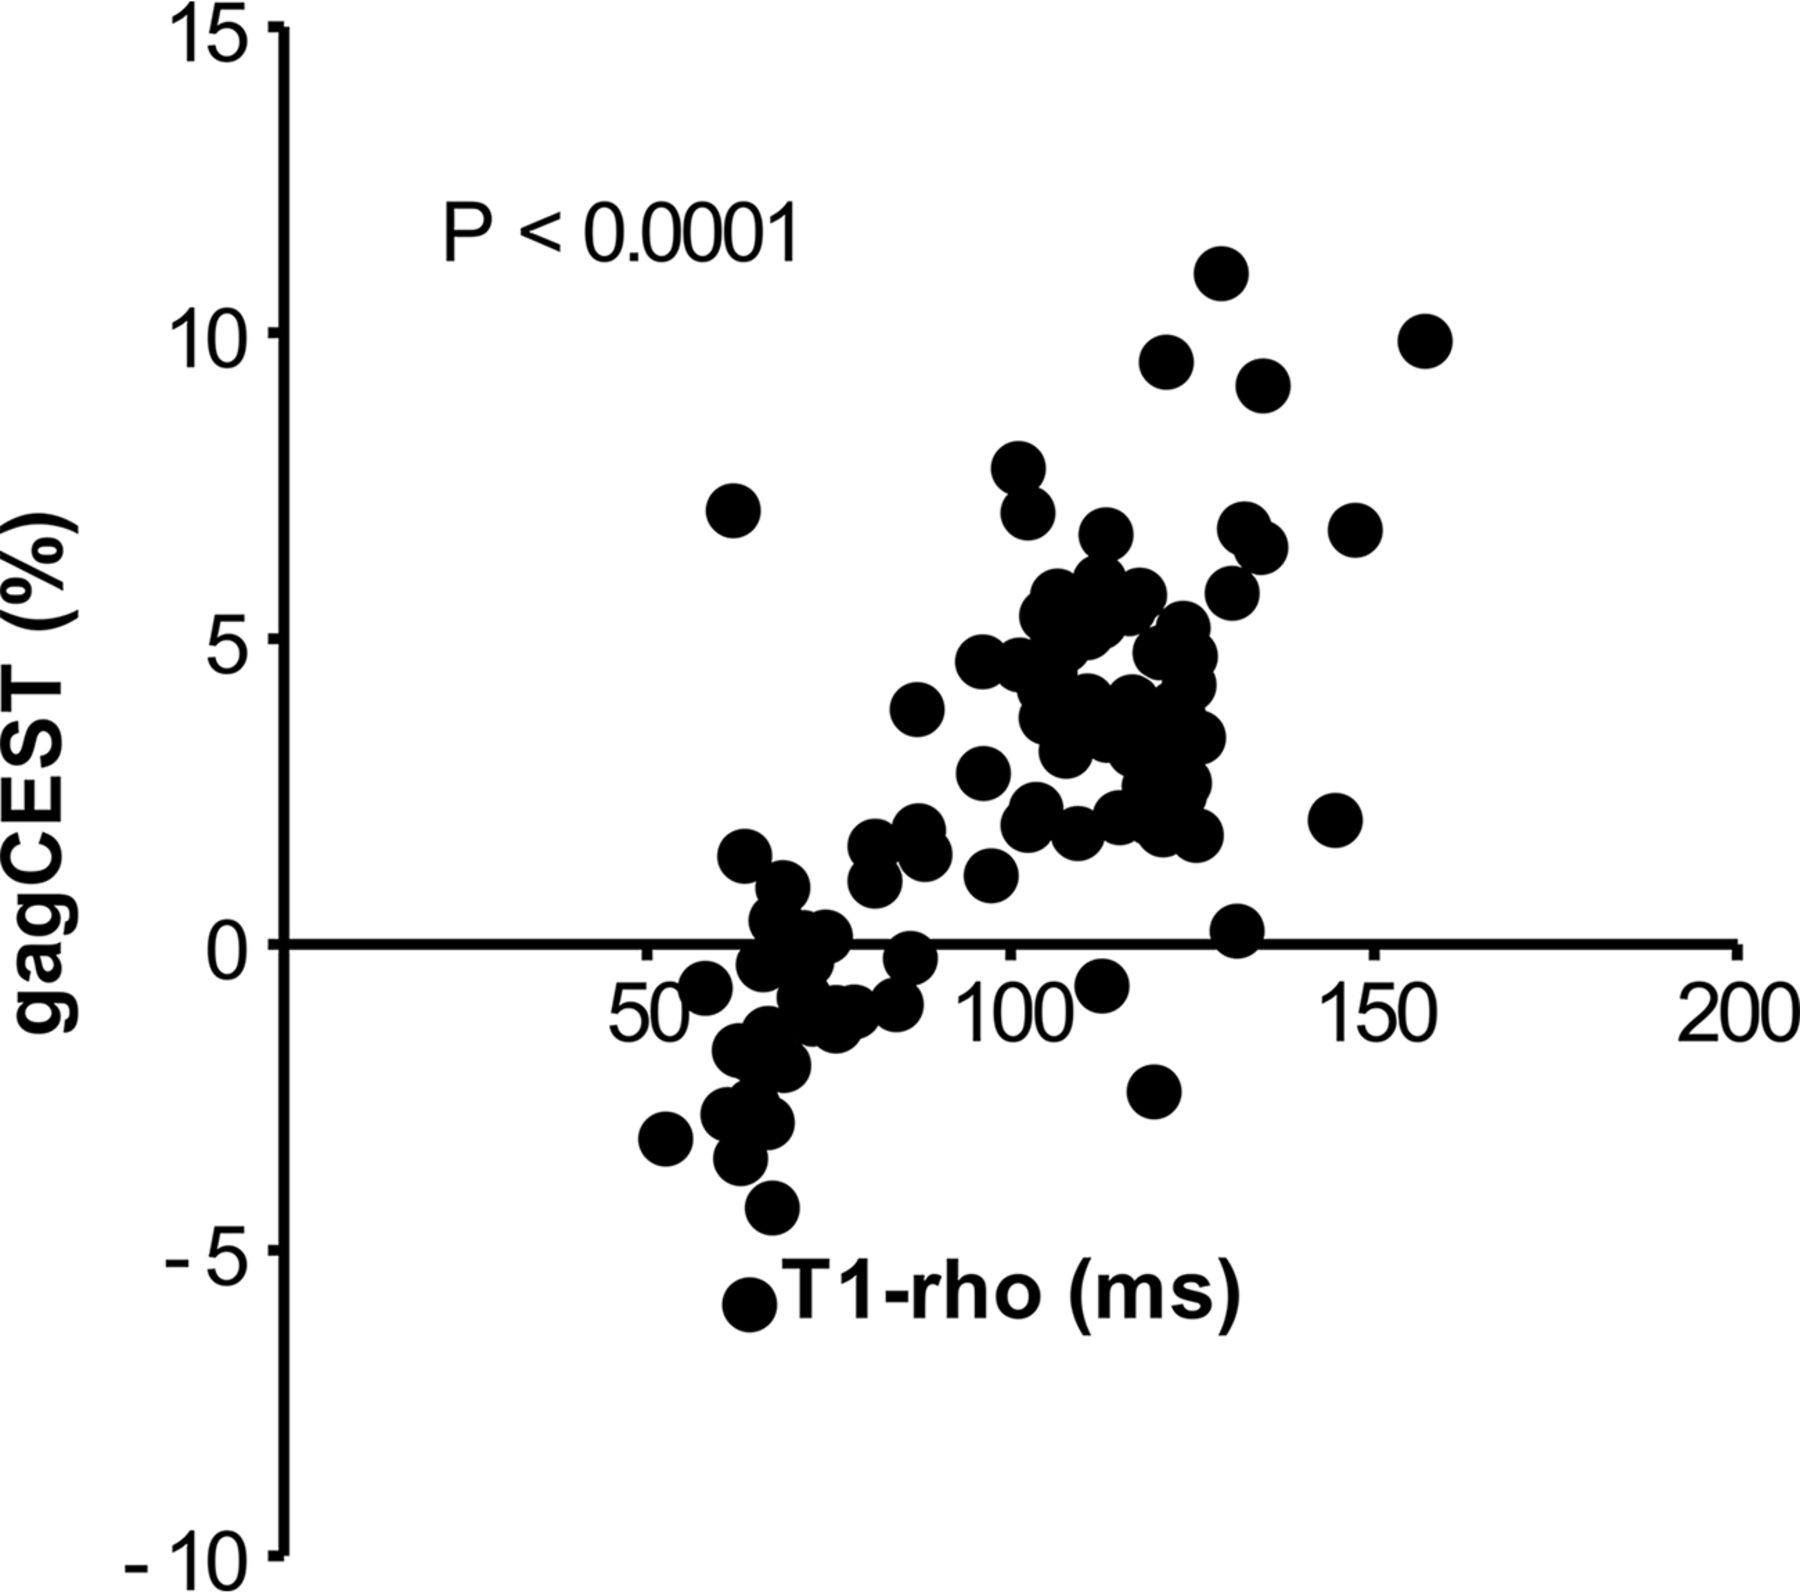
RESULTS: The gagCEST signal at grade I (5.36% ± 2.79%) was significantly higher than those at Pfirrmann grade II (3.15% ± 1.40%, P = .0006), grade III (0.14% ± 1.03%, P < .0001), grade IV (−1.75% ± 2.82%, P < .0001), and grade V (−1.47% ± 0.36%, P < .0001). The gagCEST signal at grade II was significantly higher than those of grade III (P < .0001), grade IV (P < .0001), and grade V (P < .0001). The gagCEST signal was significantly correlated negatively with Pfirrmann grade (P < .0001) and positively correlated with T1-ρ (P < .0001).
CONCLUSIONS: GagCEST imaging could be a reliable and quantitative technique for assessing intervertebral disc degeneration.
ABBREVIATIONS:
- CEST
- chemical exchange saturation transfer
- GAG
- glycosaminoglycan
- gagCEST
- CEST imaging of GAGs
- IVD
- intervertebral disc
- MTRasym
- asymmetry of the magnetization transfer ratio
- PG
- proteoglycans
- WASSR
- water saturation shift referencing
Low back pain represents the second leading cause of disability worldwide, being a major welfare and economic problem.1 Degeneration of intervertebral discs (IVDs) is one of the leading causes of low back pain, accounting for 26%.2 Surgical treatment such as spinal fusion has been performed in severe IVD degeneration, but more recently, early-stage IVD degeneration may be treated with emerging regenerative medicine therapy such as cell therapy or growth factor therapy.3⇓–5 Under such circumstances, noninvasive and quantitative imaging methods are desirable for the sensitive detection of early changes of IVD degeneration and for monitoring both the severity of the degeneration and the therapeutic response to such treatments.
Early degeneration of IVD is characterized by biochemical changes, including a loss of proteoglycans (PGs), dehydration, and collagen degeneration, of which the loss of PGs is the earliest and most remarkable phenomenon.6,7 The loss of PGs occurs predominantly in the nucleus pulposus, which decreases the ability of discs to distribute load forces.8 PGs consist of a core protein and ≥1 covalently attached glycosaminoglycan (GAG) chain. The GAGs are long unbranched polysaccharides that consist of repeating disaccharide units. PGs and GAGs are the platform of cartilage matrix, and they play crucial roles in the maintenance of the mechanical function of diarthrodial joints and IVDs.
Currently, conventional T1- and T2-weighted MR images are used to assess the severity of IVD degeneration in the clinical work-up. The Pfirrmann grade uses the signal intensity and height of discs on T2-weighted images to qualitatively evaluate IVD degeneration on the basis of the 5-point scale.9 This grading system is simple and readily applicable but can be subjective when categorizing the degree of degeneration. So far, several quantitative MR imaging techniques to objectively evaluate the IVD degeneration have been reported. It was reported that the relaxation times T1, T2, and T1-ρ; the magnetic transfer ratio; and diffusion coefficient measured by diffusion-weighted MR imaging could be quantitative imaging biomarkers for assessing the IVD matrix composition, integrity, and biomechanics.10⇓⇓–13
Conventional T2-weighted MR imaging can detect dehydration, collagen degeneration, and morphologic changes but not the loss of PGs or GAGs. It was reported that the loss of PGs can be detected by T1-ρ measurements.10,14,15 T1-ρ is the spin-lattice relaxation time in the rotating frame, which is associated with slow motional interactions between macromolecules and bulk water. T1-ρ is measured using a low B1 field created by spin-lock pulses. Previous studies showed that T1-ρ is correlated with the PG content in the nucleus pulposus16 and that T1-ρ has a wider dynamic range compared with T2 relaxation time measurements for quantitative assessment of IVD.11 However, the clinical applicability of T1-ρ imaging is limited by the long scan time and the high specific absorption rate required by multiple and long spin-lock pulses.
Chemical exchange saturation transfer (CEST) imaging has drawn considerable attention in the field of molecular imaging as a novel contrast mechanism in MR imaging.17 CEST contrast is achieved by applying a saturation pulse at the resonance frequency of a slow-intermediate exchanging proton site (eg, −NH, −OH) of endogenous or exogenous agents, and the resulting saturated spin is transferred to bulk water via a chemical exchange.17⇓–19 The CEST imaging of GAGs (ie, gagCEST) is 1 subset of the endogenous CEST imaging techniques introduced by Ling et al.20 GagCEST imaging leverages the proton exchange between the hydroxyl protons (−OH) in GAG units and bulk-water protons. Hydroxyl protons in GAGs have the frequency shift at around 1 ppm downfield of the bulk water peak, and the CEST effect at this frequency reflects the concentration or exchange rate of hydroxyl protons included in GAGs.
This method allows the direct measurements and mapping of GAGs in vivo, unlike other methods, and is considered one of the most clinically feasible methods among several CEST imaging techniques. The feasibility of this method for imaging human lumbar IVDs at 3T was demonstrated,21,22 but the quantitative performance of this method in vivo has not yet been evaluated. The purpose of the present study was to evaluate the usefulness of gagCEST imaging in the quantitative assessment of IVD degeneration in comparison with Pfirrmann grade and T1-ρ measurements.
Materials and Methods
Subjects
Twenty-four volunteers were recruited for the study: 21 men and 3 women; mean age, 36.0 ± 8.5 years; range, 26–58 years; in their 20s, n = 6; 30s, n = 10; 40s, n = 7, 50s, n = 1. All subjects were adult volunteers recruited from medical staff working in the hospital, and exclusion criteria included history of severe back pain for which the subject sought medical help, prior spine surgery or interventions of any kind, disc herniation, spinal canal stenosis, congenital spine disorders, scoliosis, or fractures. Ten subjects with mild or moderate back pain that was tolerable without any medical treatments were included. The symptoms and histories were self-reported by the volunteers. In the examinations, all subjects were confirmed to have no spinal diseases except for IVD degeneration and mild bulging discs. No subjects had spinal canal stenosis or foraminal stenosis. A total of 96 IVDs at L2–3, L3–4, L4–5, and L5–S1 were analyzed. The IVD at L1–2 was not included in the B0 shimming because of the difficulty in conducting homogeneous shimming over the large area. The study was approved by the institutional review board of Kyushu University Hospital, and written informed consent was obtained from all subjects.
MR Imaging
MR imaging was performed on a 3T clinical scanner (Achieva 3.0TX; Philips Healthcare, Best, the Netherlands) equipped with a second-order shim, using the posterior part of a 32-channel cardiac coil for signal reception and 2-channel parallel transmission via the body coil for radiofrequency transmission. The acquisition software was modified to alternate the operation of the 2 transmission channels during the radiofrequency saturation pulse. The alternate activation of the 2 transmission channels enables long quasicontinuous radiofrequency saturation up to 5 seconds beyond the 50% duty cycle of a single radiofrequency amplifier.23
Because all imaging pulses within a parallel transmission-based sequence use both amplifiers together in a standard way, there are no restrictions regarding the choice of MR image types (spin-echo/gradient-echo) because the full radiofrequency power range is available.24 The acquisition software was also modified to allow a special radiofrequency shimming for the saturation homogeneity of the alternated saturation pulse.23 Following the second-order B0 shimming, 2D gagCEST imaging was conducted on a single slice corresponding to a midsagittal section of the lumbar spine, which was identified on multislice T2-weighted images using a saturation pulse with a duration of 1 second (50 ms × 20 elements) with sinc-Gaussian-shaped pulses and a saturation power level corresponding to B1 = 0.8 μT.
To obtain a Z-spectrum, we repeated imaging at 25 saturation frequency offsets from ω = −3 to +3 ppm with a step of 0.25 ppm as well as 1 far-off-resonant frequency (ω = −1560 ppm) for signal normalization. The Z-spectrum shows the frequency-dependent saturation effects visualized by plotting the water saturation normalized by the signal without saturation as a function of saturation frequency.19
The other imaging parameters were as follows: fast spin-echo readout with driven equilibrium refocusing; echo-train length = 128, sensitivity encoding factor = 2, TR = 5500 ms, TE = 6 ms, matrix = 168 × 167, slice thickness = 5 mm, FOV = 250 × 250 mm, number of averages = 1, scan time = 2 minutes 34 seconds for 1 Z-spectrum with 25 saturation frequency offsets. A B0 map for off-resonance correction was acquired separately with a 2D gradient-echo sequence (TR = 24 ms, TE = 8.1 ms, dual-echo, ΔTE = 10 ms, 16 averages, 1 minute 5 seconds) in the same geometry as that used for the gagCEST imaging, and this B0 map was used for a point-by-point B0 inhomogeneity correction.24
For the T1-ρ mapping, T1-ρ prepared images using the 3D gradient-echo sequence were obtained in the sagittal plane with the following parameters: TR = 4.7 ms, TE = 2.4 ms, FOV = 230 × 230 mm, matrix = 128 × 128, slice thickness = 5 mm, flip angle = 35°, spin-lock pulses = 1/25/50/75/90 ms, spin-lock pulse frequency = 500 Hz, number of slices = 3, total scan time = 15 minutes. A low flip angle was used, but it did not affect the T1-ρ contrast because a shot interval of 6000 ms was set between each slice acquisition and the k-space was filled using low-to-high ordering. T2-weighted images in the sagittal planes were obtained with the following parameters: TR = 2815 ms, TE = 77 ms, FOV = 250 × 250 mm, slice thickness = 4 mm, number of slices = 13, matrix size = 320 × 242, number of acquisitions = 2, echo-train length = 21, and scan time = 2 minutes 35 seconds. The middle of the imaging slab for T1-ρ was set to correspond to the midsagittal section of the lumbar spine, which was identified on multislice T2-weighted images and was used for the gagCEST imaging.
Image Analyses
GagCEST Image Analysis.
GagCEST imaging analysis was performed with the software program ImageJ (Version 1.43u; National Institutes of Health, Bethesda, Maryland). A dedicated ImageJ plug-in was built to analyze the Z-spectra and asymmetry of the magnetization transfer ratio (MTRasym), equipped with a correction function for B0 inhomogeneity using interpolation among the Z-spectral image data.24 The local B0 field shift in hertz was obtained from the B0 map, which was created from dual-echo gradient-echo images (ΔTE = 10 ms) according to the following equation: ΔB0(x) = [Phase[TE2](x) − Phase[TE1](x)] / (TE2 − TE1) × 2 × π, where Phase [TEi](x) indicates the phases of the images with the TEs of TE1 or TE2 at position x in the radian, and TE1 and TE2 are given in seconds.24 The ΔB0(x) is the resulting B0 map measured in hertz. Each voxel was corrected in image intensity for the nominal saturation frequency offset by Lagrange interpolation among the neighboring Z-spectral images. This procedure corresponds to a frequency shift along the saturation frequency offset axis according to the measured B0 shift.
The Z-spectrum is a plot of signal intensity of bulk water as a function of the saturation frequency offset with respect to bulk water. The Z-spectrum was calculated as Ssat/S0, where Ssat and S0 are the signal intensities obtained with and without selective saturation, respectively. To reduce these undesired contributions from the conventional magnetization transfer effect and the direct saturation of bulk water, we performed an asymmetry analysis of the Z-spectrum with respect to the water frequency as MTRasym24:
 where Ssat (−α) and Ssat (+α) are the signal intensities obtained at −α and +α ppm, respectively. The gagCEST signal was defined as the mean of the MTRasym from +0.5 to +1.5 ppm calculated as MTRasym (3.5 ppm). An ROI (typical size = 50–75 mm2) was manually drawn by a board-certified neuroradiologist (O.T., with 17 years of experience) on one of the raw images to include the entire nucleus pulposus with reference to the T2-weighted images, avoiding obvious imaging artifacts.
T1-ρ Measurements.
The T1-ρ maps were generated on a pixel-by-pixel basis using a custom-written software program in the IDL programming language (RSI, Boulder, Colorado) by monoexponential fitting:
 where S0 and S(TSL) denote the equilibrium magnetization and the T1-ρ prepared magnetization with the spin-lock time (TSL), respectively. The ROIs used for the gagCEST measurements were copied and pasted onto the T1-ρ maps. Fine adjustments were made manually to correct slight locational differences.
Pfirrmann Grades.
We classified the severity of the subjects' IVD degeneration into 5 grades with the Pfirrmann grading system, based on the structure, the distinction of the nucleus pulposus and annulus, the signal intensity, and the height of the IVD on the T2-weighted images.9 The Pfirrmann grade was determined by the consensus of 2 board-certified neuroradiologists (K.Y. with 15 years, and A.H., with 19 years of experience, respectively).
Statistical Analysis
All values are expressed as mean ± SD. All comparisons were performed using a linear mixed-effects model, which accounts for multiple measurements per subject. In this model, subject identification was used as a random effect. The T1-ρ values or gagCEST signals were compared among the Pfirrmann grades using the linear mixed-effects model followed by the Bonferroni multiple comparison test. All statistical analyses were performed with commercially available software packages (GraphPad Prism software 5.0, GraphPad Software, San Diego, California; JMP13, SAS Institute, Cary, North Carolina). P values < .05 were considered significant.
Results
The number of IVDs classified as Pfirrmann grades was as follows: grade I, n = 29; grade II, n = 36; grade III, n = 11; grade IV, n = 16; and grade V, n = 4.
Changes of Z-Spectra and MTRasym in IVD Degeneration
The Z-spectra for each Pfirrmann grade showed that the IVDs with degeneration (ie, Pfirrmann grades III, IV, and V) had broader Z-spectra compared with the IVDs without degeneration (ie, Pfirrmann grades I and II) (Fig 1A). The MTRasym for each Pfirrmann grade showed that MTRasym reached its maximum value at 0.70 ppm in the grade I IVDs, 0.96 ppm in the grade II IVDs, and 0.96 ppm in the grade III IVDs, all of which were within the range of the frequency of hydroxyl protons (Fig 1B). The MTRasym decreased as the grade advanced and approached the null at grade III; the values became negative at grades IV and V.
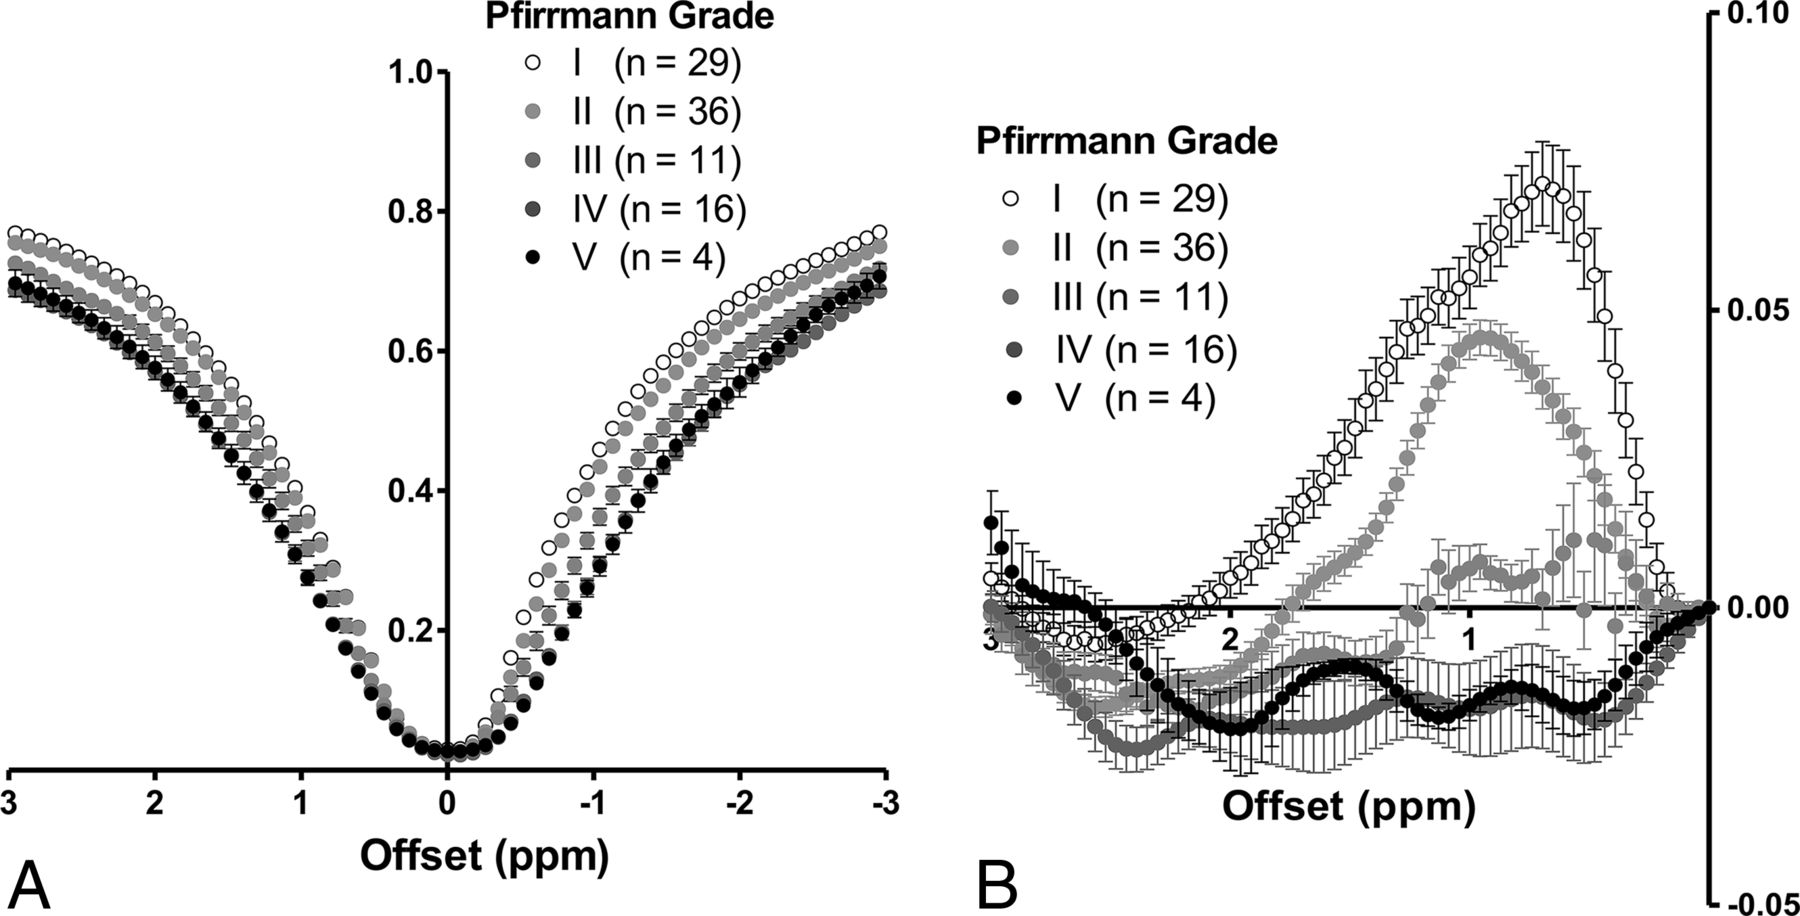
A, Z-spectra for each Pfirrmann grade. The IVDs with degeneration (Pfirrmann grades III, IV, and V) have broader Z-spectra compared with those without degeneration (Pfirrmann grades I and II). B, MTRasym for each Pfirrmann grade. MTRasym reaches its maximum value at 0.70 ppm in the 29 grade I IVDs, 0.96 ppm in the 36 grade II IVDs, and 0.96 ppm in the 11 grade III IVDs. The MTRasym decreases as the grade advances and approaches the null at grade III; it shows negative values at grades IV (n = 16) and V (n = 4).
T1-ρ and GagCEST Signal per Pfirrmann Grade
The T1-ρ and gagCEST signal for each Pfirrmann grade are shown in Fig 2. The T1-ρ for the grade I IVDs (121.0 ± 13.8 ms) was significantly longer than those of the grade II (111.0 ± 11.5 ms, P = .0023), grade III (75.3 ± 7.8 ms, P < .0001), grade IV (65.0 ± 5.2 ms, P < .0001), and grade V IVDs (69.0 ± 6.4 ms, P < .0001). The T1-ρ for grade II was significantly longer than those for grades III–V (P < .0001, each). The T1-ρ for grade III was significantly longer than for grade IV (P < .0001). T1-ρ for grade I showed the widest variability in the measurements, which ranged from 101.1 to 157.0 ms. The gagCEST signal for the grade I IVDs (5.36% ± 2.79%) was significantly higher than those for grade II (3.15% ± 1.40%, P = .0006), grade III (0.14% ± 1.03%, P < .0001), grade IV (−1.75% ± 2.82%, P < .0001), and grade V (−1.47% ± 0.36%, P < .0001). The gagCEST signal of grade II was significantly higher than those for grades III–V (P < .0001, each). Figure 3 shows a representative case with IVD degeneration. This IVD with degeneration (Pfirrmann grade IV) at L4–5 shows a shortened T1-ρ and a lower gagCEST signal compared with the IVDs without degeneration (Pfirrmann grade I or II). The gagCEST for grade I showed the widest variability in the measurements, which ranged from −2.41% to 11.0%.

A, T1-ρ (millisecond) at each Pfirrmann grade. T1-ρ at grade I is significantly longer than those at grades II–V. T1-ρ at grade II is significantly longer than those at grades III–V. T1-ρ at grade III is significantly longer than at grade IV. B, GagCEST signal (percentage) at each Pfirrmann grade. The gagCEST signal at grade I is significantly higher than those at grades II–V. The GagCEST at grade II is significantly higher than those of grades III–V.
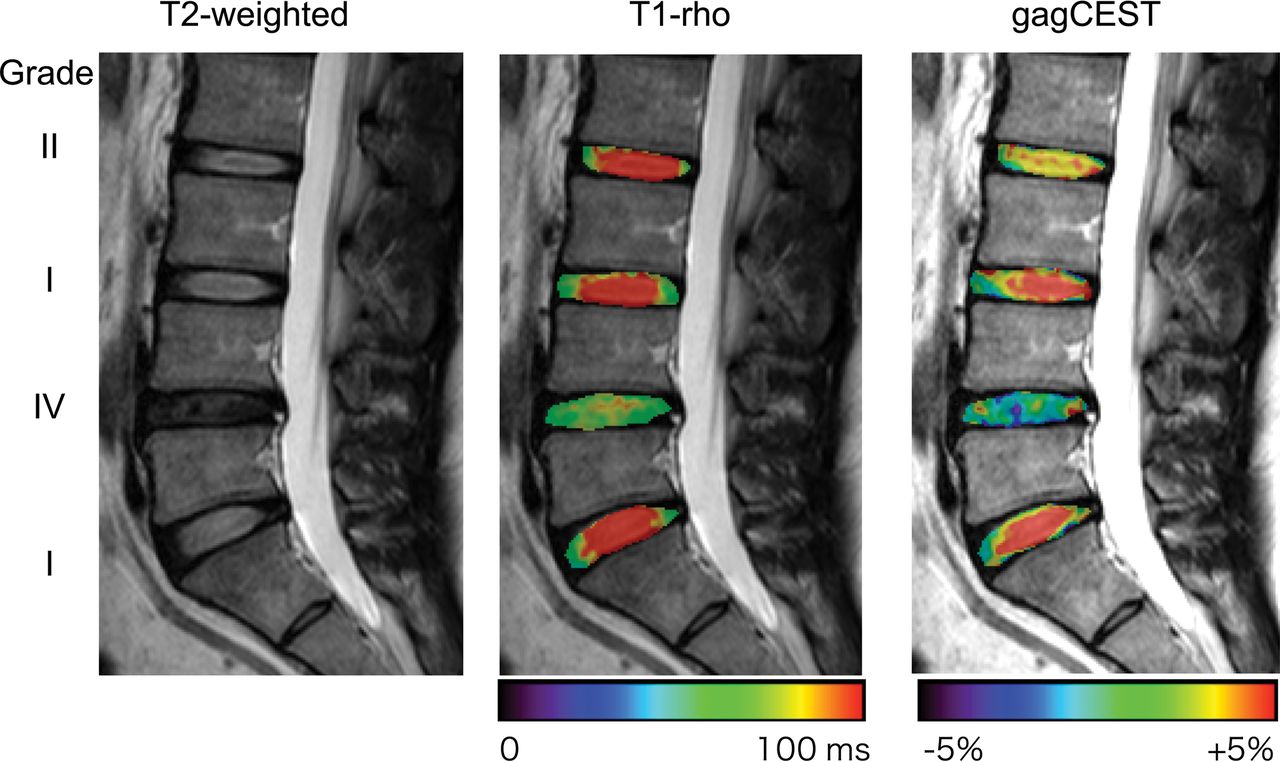
A representative case with IVD degeneration. This IVD with Pfirrmann grade IV degeneration at L4–5 shows a shortened T1-ρ and lower gagCEST signal compared with the other IVDs without degeneration (Pfirrmann grade I or II).
Relationship between the Pfirrmann Grade and T1-ρ or the GagCEST Signal
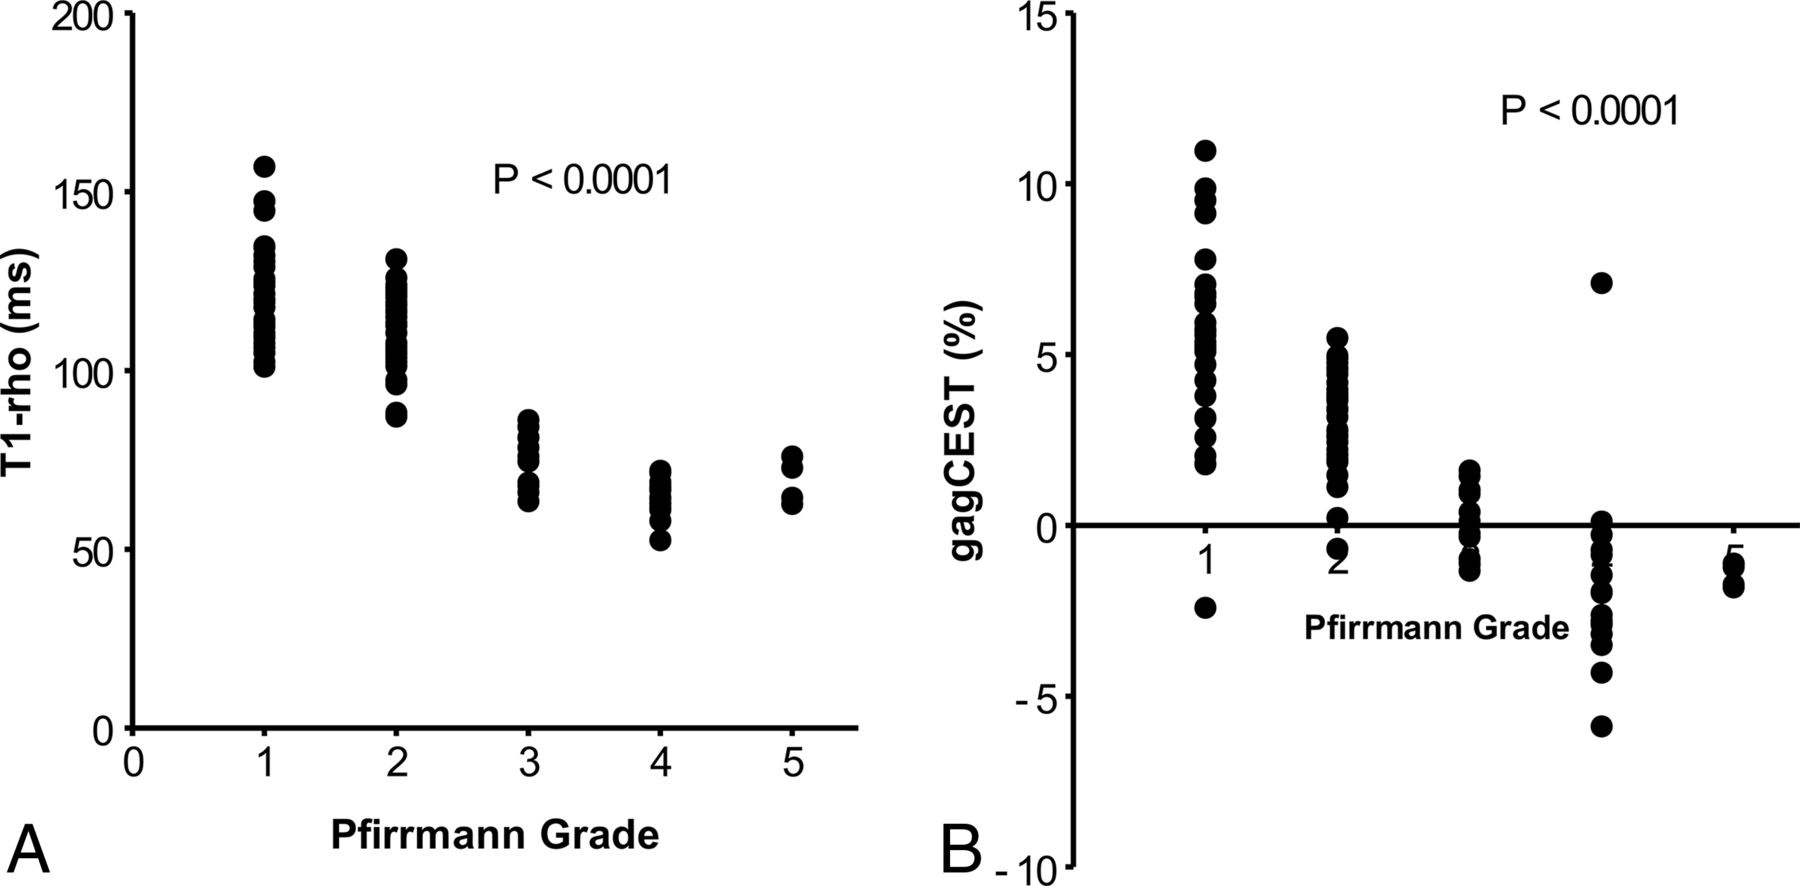
The comparisons between the Pfirrmann grade and T1-ρ or the gagCEST signal are shown in Fig 4. Significant inverse relationships were observed between the Pfirrmann grade and T1-ρ (P < .0001) and between the Pfirrmann grade and gagCEST (P < .0001). The IVDs with more severe degeneration showed a shorter T1-ρ and lower gagCEST signal.

The relationship between the Pfirrmann grade and T1-ρ (A) or the gagCEST signal (B). Significant inverse relationships are observed between the Pfirrmann grade and T1-ρ and between the Pfirrmann grade and the gagCEST.
Relationship between T1-ρ and the GagCEST Signal
The correlation between T1-ρ and the gagCEST signal is shown in Fig 5. A significant positive relationship (P < .0001) between T1-ρ and the gagCEST signal was observed. The IVDs with a shorter T1-ρ showed a lower gagCEST signal.

The relationship between T1-ρ and the gagCEST signal. A significant positive relationship is observed between the 2 parameters.
Discussion
The results of this study demonstrate that the gagCEST signal in lumbar IVDs was correlated with both the qualitative visual assessment on T2-weighted images and the quantitative T1-ρ measurement of IVD degeneration. There have been only a few studies that evaluated the degeneration of lumbar IVDs with gagCEST imaging in vivo at 3T.22,25,26 Haneder et al22 reported that the gagCEST signals of the nucleus pulposus were significantly lower in degenerative IVDs (mean Pfirrmann III and IV, 2.66 ± 2.48 and 1.47 ± 5.23) than in nondegenerative IVDs (mean Pfirrmann I and II, 7.06 ± 5.12 and 8.85 ± 4.47; P < .001), and they observed a significant correlation between the gagCEST signal and the Pfirrmann grades (r = −0.449).
Our present findings are consistent with those of the Haneder et al22 study, though some differences were observed in the measurements between the 2 studies. Such differences could be attributed to the different imaging schemes, especially regarding the saturation pulses or the postprocessing methods, including B0 inhomogeneity correction. Compared with the weak linear correlation (r = 0.299) between the T2 values and gagCEST signals in their study, a stronger correlation was observed between the gagCEST signal and the T1-ρ values (r = 0.72) in our study. This may be because T1-ρ directly reflects the GAG content and thus can be more sensitive than T2 to the degeneration of IVDs. However, because we did not measure T2 values, the direct comparison between T2 and T1-ρ values is necessary to confirm the higher sensitivity of T1-ρ in a further study.
Several other interesting observations were made in our study: First, the Z-spectra were broader in the IVDs with degeneration (grades III–V) compared with those without degeneration (grades I and II). This finding could be due to the reduced water content and collagen degeneration, which could result in T2 shortening and an increased magnetization transfer effect in the degenerative IVDs.
Second, the MTRasym and gagCEST showed negative values in the IVDs with severe degeneration (ie, grades IV and V). The negative values might indicate that most of the CEST effects from hydroxyl protons included in the GAGs disappeared and the intrinsic nuclear Overhauser effect became dominant in the measured signals. Ling et al20 showed that the nuclear Overhauser effect from the carbon-hydrogen bonds and N-acetyl groups of GAG gives rise to the magnetization transfer mechanism at −1.0 ppm and −2.6 ppm with respect to the bulk water. The nuclear Overhauser effect at −1.0 ppm could lead to the negative value of MTRasym at 1.0 ppm when the CEST effects were reduced.
Third, although both T1-ρ and gagCEST were changed according to the degree of IVD degeneration, the percentage change between Pfirrmann grades I and II was larger in gagCEST (−57%) than in T1-ρ (−8%). This result might indicate that gagCEST imaging can sensitively detect the loss of GAGs at an early stage of IVD degeneration. Furthermore, both T1-ρ and gagCEST for Pfirrmann grade I showed the widest variability among all grades, though no obvious degeneration was identified on T2-weighted images. This finding may reflect that the T1-ρ and gagCEST could sensitively detect early degenerative changes that were not visible on T2-weighted images. Further investigations including histopathologic assessments are necessary to prove this theory.
From a technical point of view, the correction of B0 inhomogeneity in the postprocessing is of great importance in gagCEST imaging because the resonance frequency of exchangeable protons (around 1 part per million) is critically close to that of bulk water; thus, even a small B0 field difference and a resulting shift in the Z-spectrum may cause a large change in MTRasym. Kim et al21,27 demonstrated the efficacy of the B0 correction method called “water saturation shift referencing (WASSR)” in gagCEST imaging of lumbar IVDs. The advantages of WASSR include the centering of the Z-spectrum with polynomial fitting in a relatively short scan time, subhertz accuracy, and identical field reference conditions with CEST imaging due to the use of the same acquisition scheme. We alternatively used the correction with a separately acquired B0 map obtained from the phase images of a dual-echo gradient-echo sequence.24 This scan also can be acquired in a short time (approximately 1 minute) and easily implemented on clinical scanners.
B0 shift correction using a B0 map is a simple and robust method because this centering method is not affected by the magnetization transfer effect and direct saturation of water.24 The utility of B0 map–based B0 inhomogeneity correction proved to be accurate and reproducible.24 However, the accuracy of a B0 map in gagCEST imaging could be largely affected by ΔTE.28 Wei et al28 demonstrated that the dual gradient-echo method with longer ΔTE values (>8 ms) has an excellent correlation with the Z-spectrum method for gagCEST imaging at 3T. In the present study, the ΔTE was set at 10 ms, which might contribute to the accurate B0 correction without the WASSR method.
There were limitations in this study. A reference for the absolute concentration/content of GAGs in IVDs was lacking because no specimens were obtained from the subjects. Instead, T1-ρ was used as an image-based reference standard for GAG content. The number of subjects was relatively small—especially those with degenerative IVDs—because all subjects were recruited as volunteers. The gagCEST images were obtained in a single sagittal slice; an axial slice for each IVD was not obtained to reduce the total scan time. Therefore, the distribution of GAGs in the axial plane in each IVD was not evaluated. 3D volume coverage with an efficient self-B0-correcting CEST method using fast spin-echo Dixon imaging is now available and is expected to overcome this issue.29,30 The imaging features commonly evaluated on T2-weighted images are not always related to the patient's clinical symptoms. It is common to see IVD degeneration in asymptomatic patients, and vice versa. The discrepancy might be partly due to the inability of T2-weighted images to detect PGs and GAGs in IVDs. Therefore, to date, therapeutic interventions have not been based solely on imaging findings. At this moment, it is not clear whether the loss of the gagCEST signal is associated with a patient's current symptoms or can predict future symptom development because there is no criterion standard to evaluate early IVD degeneration. The relationship between gagCEST imaging findings and the current or future symptoms in patients with IVD degeneration will be investigated in larger cohorts in further studies.
Conclusions
Our present findings demonstrated that the gagCEST signals of IVDs were reduced as degeneration progressed. The gagCEST signal was correlated with the Pfirrmann grades and the T1-ρ values in IVD degeneration. GagCEST imaging could be a reliable and quantitative imaging technique for assessing IVD degeneration. This method could be of great utility for the detection of the early degeneration of IVDs and for monitoring the therapeutic response to emerging regeneration therapies.
Footnotes
Disclosures: Jochen Keupp—UNRELATED: Employment: Philips Research. Masami Yoneyama—UNRELATED: Employment: Philips Japan.
This work was supported by JSPS KAKENHI grant No. JP17K10410.
Paper previously presented at: Annual Meeting of the Radiological Society of North America, November 29–December 4, 2015; Chicago, Illinois.
References
- Received January 1, 2018.
- Accepted after revision March 9, 2018.
- © 2018 by American Journal of Neuroradiology


Jump to section
Related Articles
Cited By...
- No citing articles found.