
Abstract
BACKGROUND AND PURPOSE: Ketogenic diets are being explored as a possible treatment for several neurological diseases, but the physiologic impact on the brain is unknown. The objective of this study was to evaluate the feasibility of 3T MR spectroscopy to monitor brain ketone levels in patients with high-grade gliomas who were on a ketogenic diet (a modified Atkins diet) for 8 weeks.
MATERIALS AND METHODS: Paired pre- and post-ketogenic diet MR spectroscopy data from both the lesion and contralateral hemisphere were analyzed using LCModel software in 10 patients.
RESULTS: At baseline, the ketone bodies acetone and β-hydroxybutyrate were nearly undetectable, but by week 8, they increased in the lesion for both acetone (0.06 ± 0.03 ≥ 0.27 ± 0.06 IU, P = .005) and β-hydroxybutyrate (0.07 ± 0.07 ≥ 0.79 ± 0.32 IU, P = .046). In the contralateral brain, acetone was also significantly increased (0.041 ± 0.01 ≥ 0.16 ± 0.04 IU, P = .004), but not β-hydroxybutyrate. Acetone was detected in 9/10 patients at week 8, and β-hydroxybutyrate, in 5/10. Acetone concentrations in the contralateral brain correlated strongly with higher urine ketones (r = 0.87, P = .001) and lower fasting glucose (r = –0.67, P = .03). Acetoacetate was largely undetectable. Small-but-statistically significant decreases in NAA were also observed in the contralateral hemisphere at 8 weeks.
CONCLUSIONS: This study suggests that 3T MR spectroscopy is feasible for detecting small cerebral metabolic changes associated with a ketogenic diet, provided that appropriate methodology is used.
ABBREVIATIONS:
- AcAc
- acetoacetate
- Ace
- acetone
- bHB
- β-hydroxybutyrate
- IU
- institutional units
- Lac
- lactate
- KD
- ketogenic diet
- WHO
- World Health Organization
Ketogenic diets (KDs) have been used to treat epilepsy for almost 100 years1 and recently have been explored for many other neurological conditions, including multiple sclerosis, Parkinson disease, Alzheimer disease, amyotrophic lateral sclerosis, migraine, autism, and glioma.2⇓⇓⇓⇓⇓–8 The physiologic effects of these diets are incompletely understood, but it is clear that they modify the body's energy metabolism, leading to lower systemic glucose levels and increased levels of ketone bodies. The ketone bodies β-hydroxybutyrate (bHB) and acetoacetate (AcAc) are produced in the liver from fatty acids under carbohydrate-restricted diets, and a third ketone body, acetone (Ace), is produced as the result of the breakdown of AcAc. The ketones are water soluble and transported to other parts of the body, including the brain. However, a challenge in the application of the ketogenic diet is measuring its effect on cerebral metabolism. While dietary compliance may be estimated from measurements of urine ketones, weight, and dietary food records as well as measurement of serum ketone and glucose (and other) levels,9⇓⇓–12 these measures provide a picture of the body's ketogenic state but may not reflect the level of cerebral ketosis.13
Because ketone bodies are known to accumulate in the brain in low millimolar concentrations during ketosis, they should be detectable using the noninvasive technique of proton MR spectroscopy. The earliest demonstration of this was in patients recovering from diabetic ketoacidosis, in whom it was shown that short-TE STEAM MR spectroscopy at 1.5T was able to detect elevated levels of brain Ace.14 Subsequently both bHB and AcAc (as well as lactate [Lac]) were reported to be detected in children recovering from diabetic ketoacidosis by using a long-TE point-resolved spectroscopic sequence at 1.5T.15 Increases in bHB and Lac using edited 4T MR spectroscopy have also been observed during fasting in healthy subjects,16 and increased Ace (and possibly AcAc) was observed during ketogenic diet treatment for epilepsy using 1.5T MR spectroscopy.17,18 Increases in Ace and AcAc levels were reported using short-TE 3T MR spectroscopy in patients with primary brain tumors undergoing the ketogenic diet.19
Overall, these prior studies indicate that ketone bodies are detectable by MR spectroscopy in some cases but that the results are often equivocal because of their low concentrations. In addition, it can be difficult to distinguish Ace from AcAc because their chemical shifts are very similar (2.22 versus 2.27 ppm, respectively), and the bHB doublet (at 1.20 ppm) is potentially obscured by overlap with lipids or lactate as well as signal losses due to chemical shift displacement effects at intermediate TE values.20 Therefore, there is no general concordance in the literature as to which ketone bodies can be most reliably detected in the brain using MR spectroscopy or which acquisition methodology is optimal.
The purpose of this study was to evaluate the utility of short-TE 3T MR spectroscopy to quantify cerebral ketone body and metabolite levels in patients with high-grade glioma enrolled in an ongoing open-label, single-arm, Phase II clinical trial of the KD for 8 weeks. Note that this is an interim analysis that focuses only on the MR spectroscopy data. The primary objective of the main study is to investigate the feasibility of the dietary intervention as measured by dietary compliance. Here, the results of an interim analysis assessing the feasibility of MR spectroscopy for measuring cerebral ketones and the ability to detect KD-related changes are reported; the full clinical trial is still ongoing, and the results of the primary objective will be reported at a later date.
MATERIALS AND METHODS
Study Design and Participants
The study was conducted at Johns Hopkins and the Wake Forest Baptist Medical Center with the approval of both institutional review boards. Written informed consent was obtained from all patients. The trial design was a single-arm Phase II study designed to assess the feasibility, safety, and activity of a modified Atkins-based diet to prevent tumor recurrence in patients with glioma following the completion of adjuvant chemotherapy. Eligible patients were at least 18 years of age and had a Karnofsky Performance Scale status of ≥60 and a diagnosis of high-grade astrocytoma (World Health Organization [WHO] grade III or IV) and had completed ≥80% of prescribed radiation therapy with concurrent temozolomide and adjuvant temozolomide without Common Terminology Criteria for Adverse Events (CTCAE) grade 4 leukopenia, neutropenia, or thrombocytopenia. Patients were excluded if they had a history of a metabolic disorder, a body mass index >35.0 or <20.0 kg/m2, or a milk allergy.
Treatment
The study intervention consisted of an 8-week diet, which included 2 days of fasting and 5 days on a modified Atkins diet each week. The nonconsecutive fasting days had strict caloric restriction of up to 20% of the recommended daily caloric intake of the patient provided via a 4:1 ratio ketogenic liquid (eg, KetoCal drink; Nutricia, Gaithersburg, Maryland). Modified Atkins diet days required net carbohydrate restriction to 20 g per day with no caloric restriction. All diets were customized with the guidance of a registered dietitian.
MR Imaging
Patients underwent MR spectroscopy at the beginning and end of the diet (8-week interval) on a 3T MR imaging scanner at either Johns Hopkins (12 patients) on a 3T Achieva MR imaging system (Philips Healthcare; Best, the Netherlands) or Wake Forest (2 patients) on a 3T Magnetom Skyra MR imaging system (Siemens, Erlangen, Germany) using 32-channel head coils. Conventional MR imaging included a 1-mm isotropic T1-weighted MPRAGE scan and axial FLAIR images. A 2 × 2 × 2 cm3 voxel was placed in a region maximally occupied by the lesion, while avoiding structures that might degrade spectral quality such as fluid-filled spaces, regions of high magnetic susceptibility variation (eg, due to hemorrhage, surgical clips, or air-tissue interfaces), and lipid signals from the scalp. In patients with a gross total resection, the lesion voxel was placed adjacent to the resection cavity, often in perilesional regions of T2 hyperintensity. A second voxel was placed in the contralateral hemisphere mirroring the location of the lesion voxel.
MR spectroscopy was performed using a semi localization by adiabatic selective refocusing (semi-LASER) sequence21,22 (TR = 2.2 seconds, TE = 34 ms/40 ms at Johns Hopkins/Wake Forest). The semi-LASER sequence used broadband adiabatic refocusing pulses (3 kHz/5 kHz for Johns Hopkins/Wake Forest), which have excellent slice profiles. In addition to acquiring water-suppressed data (NEX = 128), 4 excitations were recorded without water suppression. Scan time per voxel was 4 minutes 54 seconds, including 2 dummy excitations to establish the steady-state. Before acquisition, field homogeneity was optimized up to second order using either a FASTMAP-based technique23 or gradient-echo-based shimming at Johns Hopkins and Wake Forest, respectively.
The LCModel program (http://www.lcmodel.com/)24 was used to fit spectra, with basis sets for each site containing 3 ketone bodies (Ace, bHB, and AcAc) (On-line Fig 1) as well as standard MR spectroscopy metabolites: alanine, ascorbate, aspartate, creatine, γ-aminobutyric-acid, glutamine, glutamate, glycine, myo-inositol, Lac, glycerophosphocholine, phosphocreatine, phosphorylethanolamine, scyllo-inositol, taurine, glucose, glutathione, NAA, N-acetylaspartylglutamate, and 2-hydroxyglutarate. Literature values for chemical shifts and coupling constants were taken from de Graaf,25 Govindaraju et al,26 and Tkac.27Basis spectra were generated using density matrix simulations, which incorporated real refocusing pulse information and 2D localization (Matlab; MathWorks, Natick, Massachusetts). Macromolecular contributions in the spectra were modeled using simulated components available in LCModel. Metabolite concentrations were estimated relative to an internal water reference (assuming a bulk water concentration of 55.5 mol/L), which were corrected for water T2 decay differences in tumors28 and healthy brain.29 Given the low concentrations of cerebral ketones in this study population, a rejection threshold using Cramér-Rao lower bounds of a metabolite fitting of >80% was applied to avoid statistical biasing of results when comparing increases of very low-concentration metabolites.30 Additionally, no correction for either tissue water or CSF content of the voxel was applied; thus, reported concentrations are given in institutional units (IU), which are approximately equivalent to millimolar.
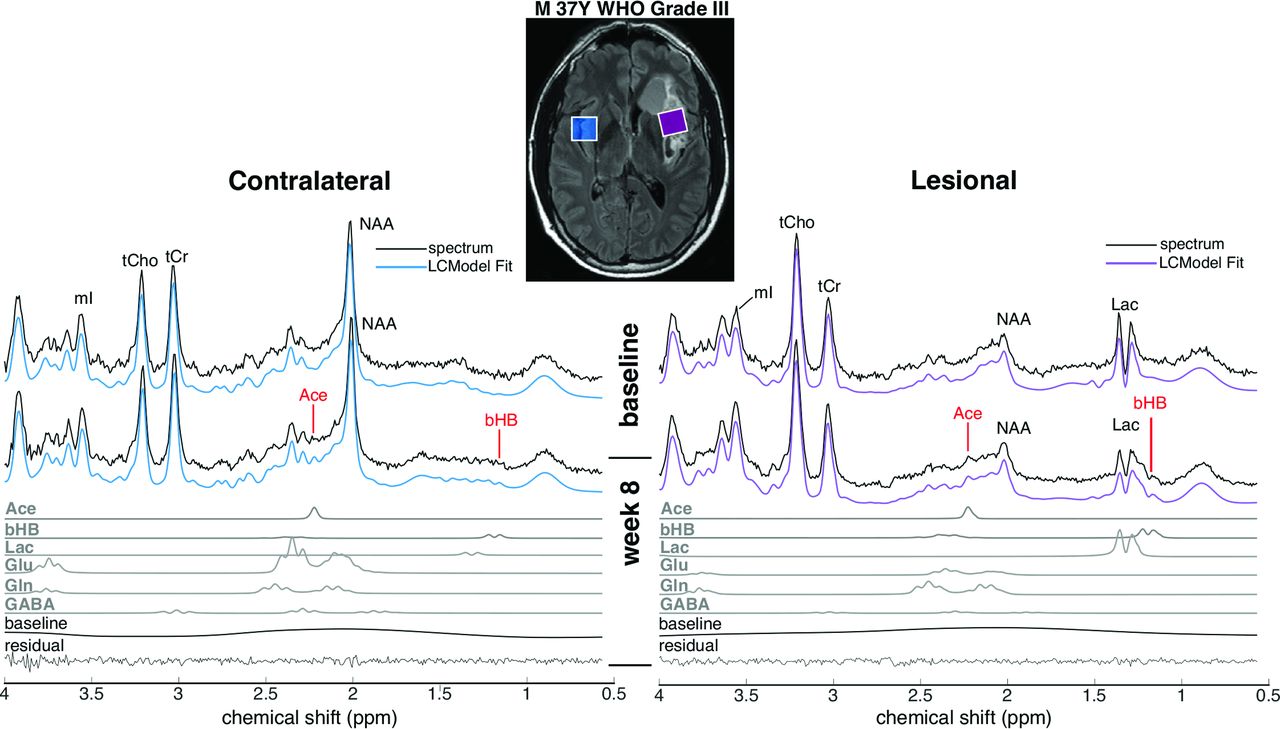
Representative MR spectra from 1 patient, together with spectral fitting results from the LCModel, at baseline and week 8. FLAIR MR imaging shows the voxel placement in the lesion in the left insular cortex and the corresponding voxel in the contralateral hemisphere. Individual fits of Ace and bHB at week 8 are also shown below the spectra, as well as those from Lac, glutamate (Glu), glutamine (Gln), and γ-aminobutyric acid (GABA). tCho indicates total Cho; tCr, total creatine; mI, myo-inositol.
Statistical Analysis
Means and standard errors of the mean are presented for normally distributed continuous measures, and medians and ranges are presented for non-normally distributed continuous measures. Percentages and counts are presented for discrete measures. Approximate 95% confidence intervals on individual metabolite fits are calculated as 2× Cramér-Rao as indicated by Provencher.24 After fitting spectral data with the LCModel, we performed statistical analysis using STATA 15 2017 (StataCorp, College Station, Texas). For this analysis of feasibility, the primary outcome was the change in cerebral ketone concentrations from baseline to week 8. The primary analysis focused on the 3 ketone bodies Ace, bHB, and AcAc. Differences among groups at each time point were assessed by paired t tests for normally distributed continuous measures. After we corrected for multiple comparisons using a Bonferroni correction, an acceptance threshold of P <.008 (= .05/6 corrected for the 3 primary ketone metabolites of interest at 2 time points) was considered significant. The Spearman rank correlation coefficient was calculated to evaluate the association among continuous measures.
RESULTS
Patient Characteristics
At the time of analysis, 14 subjects were enrolled. Two participants were excluded from the MR spectroscopy analysis due to either scanner error or a large spectral line width arising from magnetic susceptibility gradients in the temporal lobe, respectively. Only baseline MR spectroscopy data were available for 2 patients who did not complete the 8-week dietary intervention. Demographics of the 10 patients with evaluable pre- and postintervention MR spectroscopy are given in Table 1: Seven (70%) had WHO grade III anaplastic astrocytomas, and 3 (30%) had glioblastomas (Table 1). Two patients (20%) had previously undergone biopsy; 3 (30%), a subtotal resection; and 5 (50%), a gross total resection.
Demographic features of participants
With regard to biomarkers of dietary compliance, no participants had detectable urine ketones at baseline, and 9 of the 10 patients who completed the study achieved some level of ketosis, measured as trace (5 mg/dL) or greater, during the study. Eight (80%) achieved moderate (40 mg/dL) or greater urinary ketosis. Average fasting glucose levels in participants decreased modestly from 91 mg/dL at baseline to 84 mg/dL at 8 weeks.
Cerebral Ketone Levels
Figure 1 shows representative spectra from a single patient together with results of the LCModel fitting. Spectra and fitting results from each patient are provided in On-line Fig 2. Quantitative MR spectroscopy results for ketone bodies are summarized in Table 2; and for both ketones and other brain metabolites, in Fig 2. Mean water line widths from contralateral and lesion voxels were 6.7 ± 0.9 and 6.1 ± 1.9 Hz, respectively, indicating good shimming in quantified spectra.

Ketone body (left panel) and metabolite (right panel) concentrations as measured by MR spectroscopy at baseline and week 8 in the contralateral brain (A) and lesion (B) for all subjects. The asterisk indicates P ≤ .05; double asterisks, P ≤ .008 (Bonferroni-adjusted threshold for ketone bodies). Glx indicates glucose; tCho, total choline; tCr, total creatine; tNAA, total NAA; mI, myo-inositol.
Ketone body concentrations as measured by MR spectroscopy before and after treatment with a ketogenic diet in both the lesion and contralateral braina
In the lesion spectra, the ketone bodies Ace and bHB were detectable in a greater number of patient spectra following the dietary intervention according to the defined criteria. AcAc was only measured in 1 spectrum at baseline and week 8. Ketone bodies were largely undetectable in the lesion at baseline and increased significantly at week 8 for both Ace (baseline: 0.06 ± 0.03; week eight: 0.27 ± 0.06 IU; P = .005) and bHB (baseline: 0.07 ± 0.07; week eight: 0.79 ± 0.32 IU; P = .046, not significant after Bonferroni correction; Table 2). Overall, Ace was detected in 90%, and bHB, in 50% of lesion scans at week 8. The mean Cramér-Rao lower bounds of ketone fitting after KD in the lesion were 29% for Ace and 34% for bHB, which were considerably lower than the rejection threshold.
Changes in the contralateral brain largely mirrored those seen in the lesion. Ace measures increased significantly from baseline (0.04 ± 0.01 IU, mean Cramér-Rao = 64%) to (0.16 ± 0.04 IU, mean Cramér-Rao = 39%) (P = .004) at week 8. bHB in the contralateral brain also increased from 0.09 ± 0.06 to 0.28 ± 0.08 IU; however, there was wider variability in bHB, and this increase was not statistically significant (P = .12). Ace was detected in 90% and bHB in 60% of 8-week scans in the contralateral brain region.
Most interesting, there was significantly more Ace in the lesion than in the contralateral brain at week 8 (0.27 ± 0.06 versus 0.16 ± 0.04 IU, P = .012). A similar pattern was noted with bHB, though this difference was not statistically significant (0.79 ± 0.32 versus 0.28 ± 0.08 IU, P = .17).
Other Brain Metabolites
As expected, total NAA was lower in the lesion than in the contralateral brain both at baseline (P = .02) and at 8 weeks. Lac was significantly higher in the lesion compared with contralateral brain both at baseline and week 8 (2.5 ± 0.74 versus 0.25 ± 0.09 IU, P = .004). Otherwise, no significant differences in indigenous cerebral metabolites were ob-served between the lesion and contralateral side, including total choline (P = .14) and total creatine (P = .09).
Contralateral total NAA concentrations decreased by a small-but-significant amount from 7.9 ± 0.2 to 7.7 ± 0.2 IU (P = .02) during the 8-week treatment period, while lesion total NAA levels were stable. There were no detectable changes in the concentrations of any other reported metabolite in either the lesion or contralateral brain, including lactate (P = 0.8 for lesion, P = .3 for contralateral), during the 8-week period.
Correlation of Brain Ketone Levels with Peripheral Markers of Ketosis
Overall, patients with greater systemic measures of dietary compliance (as evidenced by urine ketones and fasting blood glucose at week 8) showed higher cerebral ketone concentrations. At week 8 MR spectroscopy, higher contralateral brain Ace levels were significantly associated with greater urine ketones (Fig 3A, r = 0.87, P = .001) and lower week 8 fasting glucose (Fig 3B, r = −0.67, P = .03). A similar trend was also seen for lesion Ace concentrations and both urine ketones (r = 0.54, P = .11) and fasting glucose (r = −0.54, P = .10), but it did not reach significance. No significant correlations were seen between bHB levels in either the lesion or contralateral brain and urine ketones or fasting glucose levels.

Association between contralateral brain acetone levels estimated by MR spectroscopy and systemic measures of ketosis at week 8. Spearman rank correlation between acetone concentrations (IU error bars represent the ±95% confidence interval based on the LCModel Cramér-Rao values) in the contralateral brain at week 8 plotted against the urinary ketosis score (A) and fasting serum glucose levels (B). Urine ketones are defined as 1, trace (∼5 mg/dL); 2, small (∼15 mg/dL); 3, moderate (∼40 mg/dL); and 4, large (≥80 mg/dL).
DISCUSSION
The main finding of this study is that short-TE single-voxel brain MR spectroscopy performed at 3T using 32-channel receive head coils, in combination with LCModel analysis, was able to measure concentrations of ketone body Ace (90% of spectra) and, to a lesser extent, bHB (50%–60% of spectra) in patients with glioma who were on a modified Atkins diet for 8 weeks. Furthermore, the brain Ace concentrations were found to correlate with concurrent urine ketone level measurements. These results suggest that localized MR spectroscopy may provide a useful measure of brain ketosis and a possible noninvasive pharmacodynamic marker in clinical trials of ketogenic diets in glioma or other neurologic conditions.
However, the amplitudes of the ketone body signals in the spectrum are very small in this dietary treatment, so robust acquisition and analysis methods are required to estimate their concentrations. In the current study, spectral quality was maximized through the combined use of a semi-LASER localization sequence, high-order shimming, and 32-channel receiver coils. In addition, a carefully simulated and constructed LCModel basis set for the specific acquisition and quantitative criteria for considering a peak detectable or not were used for spectral analysis.
Sensitivity of Detection of Ace, AcAc, and bHB
The ketone body most reliably detected in this study was Ace, which is consistent with prior KD studies in patients with epilepsy18 and also in patients recovering from diabetic ketoacidosis.14 However, other studies during fasting or ketogenic diet have also reported increases in bHB, AcAc, or Lac.16,17,19 The MR spectroscopy detectability of these compounds is not uniform; Ace signal is a singlet at 2.22 ppm, which arises from 6 equivalent protons, whereas AcAc (a singlet at 2.27 ppm) arises from 3 equivalent protons and, therefore, is half the amplitude for the same molecular concentration. The 1.2-ppm bHB signal also arises from 3 protons but is a doublet due to J-coupling, so the peak height is further reduced by a factor of 2. The lack of correlation of bHB with systemic measures is likely the result of its lower sensitivity of detection by MR spectroscopy, resulting in fewer available data points and greater variability, and is not necessarily indicative of a true lack of a relationship between cerebral bHB and urine ketones or fasting glucose levels. The detectability of bHB may also be partially compromised by overlap with lipid resonances or reduced signal intensity due to J-modulation effects if intermediate or long TE values are used. Therefore, from a technical viewpoint, Ace is the ketone body most favorable for detection by MR spectroscopy.
The detectability of the 1.19-ppm resonance of bHB might be improved by using an optimized long-TE sequence (eg, 1/J = 160 ms, J = 6.3 Hz) to discriminate it from other resonances such as lipid; however, this would also result in appreciable signal loss due to T2 decay and likely worsen detection of the small concentration singlet resonances of Ace and AcAc. Because lactate and bHB have similar coupling constants, the evolution of their signals as a function of TE is also very similar (On-line Fig 3), so altering the TE is unlikely to improve separation of bHB and Lac. However, at 3T, the methyl doublets of bHB and Lac at 1.19 and 1.31 ppm are usually sufficiently well-resolved to be individually quantified by the LCModel, except perhaps in regions of poor B0 field homogeneity.
Assignment of the singlet resonance at 2.2 ppm to either Ace or AcAc is quite challenging at typical in vivo line widths; the 0.05-ppm chemical shift difference between Ace and AcAc corresponds to approximately 6 Hz at 3T, which is comparable with the spectral line widths observed in this study (6.1 ± 1.9 Hz in lesions). However, LCModel fitting also makes use of the 3.43-ppm methylene (CH2) peak of AcAc, which is not present in Ace, and in the current study, few of the LCModel analyses could identify this resonance (however, this peak may also be difficult to detect because it potentially overlaps with other peaks such as scyllo-inositol, taurine, and myo-inositol). Therefore, it seems likely that the 2.2-ppm peak arises from Ace, not AcAc; this finding is consistent with a previous study in patients with diabetic ketoacidosis that reported that bHB or AcAc can be converted to Ace quite rapidly.15
Choice of Cramér-Rao Thresholds for Detection of Metabolites
Traditionally, a Cramér-Rao lower bound (CRLB) threshold of 20% has been suggested for determining whether a metabolite concentration reported by the LCModel should be considered reliable or not.24 However, recently it has been shown that using a low-threshold value such as this may lead to bias and non-normal distributions of metabolite concentrations, particularly for changes in low-concentration compounds.30 Reported sensitivities of detection will vary according to the threshold chosen; the 80% value chosen here represents a reasonable compromise between under- and overfitting the data and avoiding bias for the low-concentrations ketone bodies. Hence, although Ace was measured in 5/10 contralateral spectra at baseline with these criteria, the mean concentration was over 2× lower compared with week 8 spectra (n = 9/10), and the associated error in fitting this low concentration was higher (64% versus 39%). In addition, the Ace measurements correlated well with peripheral measures of ketosis, suggesting that the 80% cutoff chosen did not result in erroneous values being reported.
Comparison of Ketone Bodies in Lesion and Contralateral Brain
One of the findings of this study was that lesion ketone levels were higher than in the contralateral brain; this is consistent with a KD study using 13C MR spectroscopy in preclinical brain tumor models,31 which found that the ketone body monocarboxylate transporter was upregulated, facilitating uptake and oxidation of ketone bodies in the tumors. Other underlying causes for this observation might be increased delivery of ketones (increased blood volume) and/or increased blood-brain barrier permeability in the lesions. One previous MR spectroscopic imaging32 study also found that Ace was more detectable in fluid-filled spaces (such as ventricular CSF) compared with normal brain, perhaps due to longer T2 in these regions. It is therefore also possible that the lesion spectra in the current study (usually placed in regions of T2 hyperintensity on MR imaging) may also show increases in Ace signal for this reason.
Comparison of Other Brain Metabolites in Lesions and Contralateral Brain
The lesion spectra observed in this study are very consistent with those previously reported in the literature.33 NAA was significantly lower in the lesion, consistent with neuroaxonal loss either in the tumor or peritumor regions, while Lac was significantly elevated due to nonoxidative glycolysis often seen in brain tumors. While it may seem surprising that Cho levels were not significantly elevated in the lesion, it should be remembered that all cases were scanned postsurgery and chemoradiation and that in 5 of 10 cases, a gross total resection was performed. In these cases, the lesion voxel placed adjacent to the surgical cavity may or may not contain any tumor tissue.
Effects of KD on Other Brain Metabolites and Brain MR Imaging
Overall, most brain metabolites and anatomic MR imaging findings were stable during the relatively short 8-week period of KD. In particular, no changes in the lesion Cho and NAA levels suggest that there was minimal tumor progression during this time. There were also no changes in Lac, the end product of nonoxidative glycolysis, despite lowering of systemic glucose levels. Further study will be required to determine whether baseline tumor lactate levels have any predictive value in determining a response to KD.
Interestingly, there was a small-but-statistically significant decrease in total NAA in the contralateral hemisphere at 8 weeks. Because NAA synthesis occurs in mitochondria and is dependent on tricarboxylic acid cycle metabolism, it is possible that decreased blood glucose levels during ketosis lead to reduced tricarboxylic acid cycle flux and NAA synthesis. Progressive total NAA reductions were previously reported in a teenager experiencing repeat episodes of diabetic ketoacidosis,34 and reduced total NAA compared with healthy controls was reported in patients with epilepsy on the KD.18
Alternatively, the decrease in NAA seen in the contralateral hemisphere may represent delayed, ongoing changes in systemic brain metabolism as the result of the prior chemotherapy and radiation. Further studies will be required to investigate the origin of this effect.
This study has a number of limitations, including the small number of subjects, which precluded analysis of subgroups of patients (segregated, for example, by tumor grade or genetic mutation status). Another limitation is that no attempt was made to correct metabolite concentrations for voxel water (or CSF) content. However, we think that this did not significantly affect the results because voxels were carefully placed in either the solid part of the lesion or in the contralateral hemisphere, avoiding fluid-filled spaces. Voxel locations were also carefully matched between initial and follow-up scans, and brain MR images were stable during the 8-week duration of the diet, so it is unlikely that voxel water content changed during this period. Finally, the small ketone signals are of similar magnitude to the noise in the spectra and thus difficult to ascertain visually. Increased numbers of signal averages (and associated scan time) may have resulted in improved detection of ketones; however, this was not possible in the current study because the MR spectroscopy was just one part of a lengthy clinical research protocol containing multiple other sequences. Future studies might use longer acquisition times and larger voxel sizes to increase the conspicuity of the ketone signals.
CONCLUSIONS
This study suggests that 3T MR spectroscopy is feasible for detecting small cerebral metabolic changes associated with a ketogenic diet, provided that appropriate methodology is used.
Acknowledgments
We acknowledge use of the services and facilities of the Clinical Research Unit of the Wake Forest Clinical and Translational Sciences Institute, which is supported by National Center for Advancing Translational Sciences UL1TR001420. We also acknowledge philanthropy in memory of John Freeman.
Footnotes
A. Berrington and K.C. Schreck contributed equally to this work.
This work was undertaken while A.L. Hartman was a full-time employee of Johns Hopkins University.
This work was supported by the National Center for Advancing Translational Sciences, National Institutes of Health KL2TR001421 and CTSA grant UL1TR001420, and the National Cancer Institute's Cancer Center Support Grant award number P30CA012197 issued to the Wake Forest Baptist Comprehensive Cancer Center. It was also supported, in part, by the National Institutes of Health P41EB015909.
The content is solely the responsibility of the authors and does not necessarily represent the official views of the National Cancer Institute or the National Institute of Neurological Disorders and Stroke or the National Institutes of Health.
Dr Berrington is now with the Sir Peter Mansfield Imaging Centre, School of Physics and Astronomy, University of Nottingham, Nottingham, UK.
Disclosures: Bobbie J. Barron—UNRELATED: Board Membership: Nutricia, Comments: I have taken part in 1 Advisory Board meeting. The nutrition supplements Nutricia makes were offered as part of a compliance strategy during the fasting part of the intervention but were not required and were not critical to the study; Payment for Lectures Including Service on Speakers Bureaus: Nutricia, Comments: I have been a speaker at a Nutricia conference; Royalties: Springer Publishing Company/Demos Health, Comments: for coauthoring The Ketogenic and Modified Atkins Diets, 6th ed; Other: BioMarin and Therachon, Comments: I have been a consultant for pediatric anthropometry for BioMarin and Therachon, neither of which has any conflict with the current study. Eric Kossoff—UNRELATED: Board Membership: Atkins Nutritionals; Nutricia Royalties: Springer Publishing Company/Demos Health, Comments: for coauthoring The Ketogenic and Modified Atkins Diets, 6th ed. Linda Easter— RELATED: Grant: Wake Forest Baptist Health Clinical and Translational Sciences Institute, Comments: CTSA grant UL1TR001420*; UNRELATED: Consultancy: Allena Pharmaceuticals. Mackenzie C. Cervenka—RELATED: Grant: Elaine Freeman Charitable donation, Comments: The money was paid to Johns Hopkins and not to me personally*; UNRELATED: Consultancy: Nutricia, Sage Therapeutics, Comments: I am a consultant for Nutricia, which produces KetoCal (4:1 ratio ketogenic liquid used in patients on the GLAD protocol referenced in the study). I was not paid directly by Nutricia for participation in the study. I was also a prior consultant for Sage Therapeutics (unrelated to this study); Grants/Grants Pending: Nutricia, Vitaflo, the William and Ella Owens Medical Research Foundation, the BrightFocus Foundation, Payment for Lectures Including Service on Speakers Bureaus: Nutricia, Epigenix, LivaNova, Royalties: Demos, Comments: I receive royalties for the book The Ketogenic and Modified Atkins Diets: Treatments for Epilepsy and Other Disorders. Peter B. Barker—RELATED: I was supported, in part, by the National Institutes of Health P41EB015909. Jaishri O. Blakeley—RELATED: Comments: philanthropic gift to the institution to support nutritional interventions for brain tumors*; UNRELATED: Consultancy: SpringWorks Therapeutics, Comments: agreement in place, no payments made*; Grants/Grants Pending: Sanofi, Lily, Bristol-Myers Squibb*; Travel/Accommodations/Meeting Expenses Unrelated to Activities Listed: AstraZeneca, SpringWorks Therapeutics, Exelixis. Roy E. Strowd—RELATED: Grant: National Institutes of Health, Comments: I was supported by the National Center for Advancing Translational Sciences National Institutes of Health KL2TR001421 and the National Cancer Institute's Cancer Center Support Grant award No. P30CA012197 issued to the Wake Forest Baptist Comprehensive Cancer Center. UNRELATED: Consultancy: Monteris Medical, Novocure. Grants: Southeastern Brain Tumor Foundation, American Society of Clinical Oncology, Conquer Cancer. *Money paid to the institution.
Indicates open access to non-subscribers at www.ajnr.org
References
- Received June 17, 2019.
- Accepted after revision September 4, 2019.
- © 2019 by American Journal of Neuroradiology


