
Abstract
BACKGROUND AND PURPOSE: The effect of gadolinium on the estimation of myelin has not been reported. The aim of the current study was to investigate the effects of gadolinium on automatic myelin and brain tissue volumetry via quantitative synthetic MR imaging.
MATERIALS AND METHODS: The study included 36 patients who were referred for brain metastases screening, and quantitative synthetic MR imaging data before and after gadolinium-based contrast agent administration were analyzed retrospectively. Brain metastases were detected in 17 patients. WM volume, GM volume, CSF volume, non-WM/GM/CSF volume, myelin volume, brain parenchymal volume, myelin fraction (myelin volume/brain parenchymal volume), and intracranial volume were estimated. T1 and T2 relaxation times, proton density, and myelin partial volume per voxel averaged across the brain parenchyma were also analyzed.
RESULTS: In patients with and without metastases after gadolinium-based contrast agent administration, measurements of WM and myelin volumes, and myelin fraction were significantly increased (+26.65 and +29.42 mL, +10.14 and +12.46 mL, +0.88% and +1.09%, respectively), whereas measurements of GM, CSF, brain parenchymal, and intracranial volumes were significantly decreased (−36.23 and −34.49 mL, −20.77 and −18.94 mL, −6.76 and −2.84 mL, −27.41 and −21.84 mL, respectively). Non-WM/GM/CSF volume did not show a significant change. T1, T2, and proton density were significantly decreased (−51.34 and −46.84 ms, −2.67 and −4.70 ms, −1.05%, and −1.28%, respectively) after gadolinium-based contrast agent administration, whereas measurements of myelin partial volume were significantly increased (+0.78% and +0.75%, respectively).
CONCLUSIONS: Gadolinium had a significant effect on the automatic calculation of myelin and brain tissue volumes using quantitative synthetic MR imaging, which can be explained by decreases in T1, T2, and proton density.
ABBREVIATIONS:
- GBCA
- gadolinium-based contrast agent
- ICV
- intracranial volume
- PD
- proton density
- T1
- longitudinal relaxation time
- T2
- transverse relaxation time
- VMY
- myelin partial volume
Synthetic MR imaging has recently been introduced into clinical practice.1⇓⇓–4 It generates adjustable T1-weighted, T2-weighted, and FLAIR images on the basis of simultaneous quantification of longitudinal relaxation time (T1), transverse relaxation time (T2), and proton density (PD) in a scan time of approximately 6 minutes for full head coverage with good accuracy and reproducibility.5,6 In contrast, only 1 predetermined contrast-weighted image per acquisition is generated by conventional MR imaging. Furthermore, quantitative measurement potentially removes imperfections and dependencies of MR imaging on scanner settings that are difficult to eliminate from conventional MR imaging.3 Moreover, automatic segmentation of brain tissue via the synthetic tissue-mapping method based on synthetic MR imaging–derived quantitative values has been reported to be precise and robust7,8 with a postprocessing time of <1 minute, which is much shorter than that of the widely used volumetric methods associated with conventional T1-weighted images.9
Recently, brain myelin and edema estimation models have been developed using T1, T2, and PD values obtained via quantitative synthetic MR imaging.10 The myelin estimation model is based on predetermined parameters derived from healthy subjects for T1, T2, and PD in 4 partial volume compartments in the brain, the myelin partial volume (VMY), the cellular partial volume, the free water partial volume, and the excess parenchymal water partial volume. The model postulates that each compartment has its own quantitative values and contributes to the effective quantitative values of each specific acquisition voxel, while exchanging magnetization with other partial volume compartments. In diseased brain, decreased VMY indicating decreased myelin or increased excess parenchymal water partial volume indicating edema occurs in this model.11 Correlations between VMY and histologic myelin12 and other myelin measurement methods13 were recently confirmed.
The effect of gadolinium-based contrast agent (GBCA) administration on the measurement of quantitative synthetic MR imaging tissue mapping was investigated by Warntjes et al.14 However, the effect of GBCA on the estimation of myelin has not been reported. In routine clinical practice using synthetic MR imaging, we noticed that measurement of VMY increased after the administration of GBCA. Furthermore, the subjects included in their study did not have any enhancing lesions in the brain. The aim of the current study was to investigate the effect of GBCA on automatic myelin and brain tissue volumetry determined via quantitative synthetic MR imaging in patients with or without enhancing cerebral lesions.
Materials and Methods
Subjects
MR imaging data from 36 patients (21 men, 15 women; mean age, 63 ± 11 years) who were referred for brain metastases screening between April 2015 and November 2015 were retrospectively analyzed. The patients had undergone quantitative MR imaging and conventional T1-weighted inversion recovery fast spin-echo MR imaging before and after the administration of GBCA. The study was approved by the institutional review board of Juntendo University Hospital, Japan, and the requirement for written informed consent was waived due to its retrospective nature. The patient cohort in the present study partially overlapped that in a previous publication.15
Scanning Protocol
In all patients, quantitative synthetic MR imaging was performed via a procedure described in Warntjes et al1 involving quantification of relaxation times and PD by multiecho acquisition of saturation recovery using a turbo spin-echo readout, on a 3T MR imaging scanner (Discovery MR750w; GE Healthcare, Milwaukee, Wisconsin) with a 19-channel head coil. T1 and T2 relaxation and PD were retrieved simultaneously. The procedure involves collection with different combinations of 2 TEs and 4 delay times. The TEs used were 16.9 and 84.5 ms, and the delay times were 146, 546, 1879, and 3879 ms. The other parameters used for quantitative MR imaging were the following: TR = 4000 ms, FOV = 240 × 240 mm, matrix = 320 × 320, section thickness/gap = 4.0/1.0 mm, number of sections = 30, and acquisition time = approximately 6 minutes. The parameters used to obtain conventional T1-weighted inversion recovery fast spin-echo images were the following: TR = 3294 ms, TE = 18 ms, TI = 908 ms, FOV = 240 × 216 mm, matrix = 352 × 256, echo-train length = 8, slice thickness/gap =4/1 mm, number of slices = 30, and acquisition time = 1 minute 50 seconds. The dose of contrast medium was 0.1 mmol/kg (0.2 mL/kg), and the GBCAs administered were ProHance (gadoteridol; Bracco Diagnostics, Princeton, New Jersey; 26 patients), Omniscan (gadodiamide; Daiichi-Sankyo, Tokyo, Japan; 6 patients), and Magnevist (gadopentetate dimeglumine; Bayer HealthCare Pharmaceuticals, Wayne, New Jersey; 4 patients). The patients received a single dose of GBCA after the first acquisition, 7 minutes before the second acquisition.
Image Postprocessing
Synthetic MR imaging data were postprocessed with SyMRI software, Version 8.0 (SyntheticMR, Linköping, Sweden). T1, T2, and PD maps were acquired and then used for automatic brain tissue segmentation of WM volume, GM volume, CSF volume, the remaining unclassified non-WM/GM/CSF tissue volume within the intracranial volume (ICV), brain parenchymal volume, and ICV.7 Synthetic T1-weighted images were also created with TR = 500 ms and TE = 10 ms. An experienced neuroradiologist (A.H.) determined the presence or absence of brain metastases in each patient on the basis of pre-contrast-enhanced and post-contrast-enhanced conventional and synthetic T1-weighted images. The region-growing algorithm includes volume that does not match the defined WM, GM, or CSF characteristics. This remaining tissue was defined as the unclassified non-WM/GM/CSF tissue volume within the ICV, comprising unspecified tissue such as blood vessels, other pathologic tissue, or motion artifacts. The threshold for the ICV was set at PD = 50%, using the definition of the tissue interface between CSF (PD = 100%) and bone (PD = 0%). The ICV comprised all recognized WM volume, GM volume, CSF volume, and unclassified non-WM/GM/CSF tissue volume within the ICV. The brain parenchymal volume was defined as the ICV minus the CSF volume. An example of automatic tissue segmentation is shown in Fig 1.
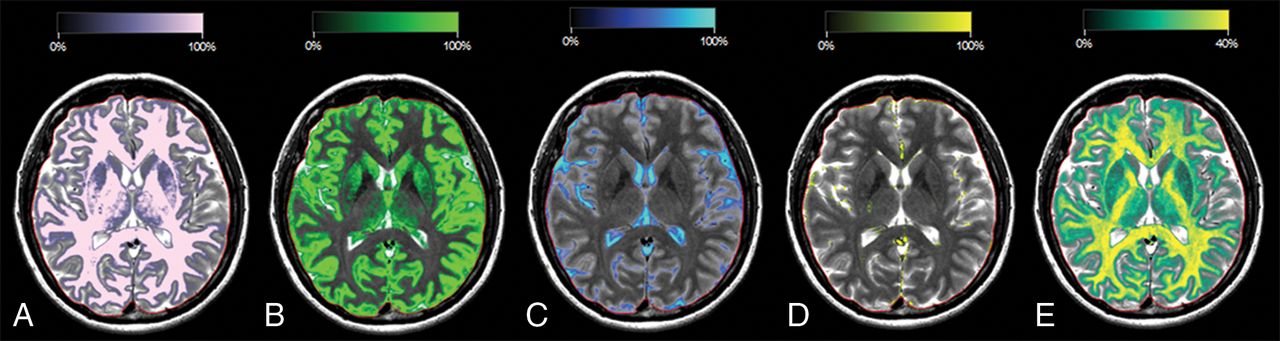
Typical images of a patient without brain metastases derived via automatic segmentation software. A, WM segmentation overlaid on a T2-weighted image, in which the intensity of the light-pink color overlay corresponds to the calculated WM partial volume per voxel. The red line indicates the intracranial volume. Similar images are shown for GM in green (B), CSF in blue (C), non-WM/GM/CSF in yellow (D), and myelin partial volume in yellow and green (E).
With the assumption that all the T1, T2, and PD values of VMY, cellular partial volume, free water partial volume, and excess parenchymal water partial volume contribute to the effective T1, T2, and PD in each acquisition voxel, we estimated partial volumes of these 4 compartments.10 This process was performed by running Bloch equations and optimizing model parameters in a spatially normalized and averaged brain from healthy controls. VMY maps, myelin volume in the whole brain, and myelin fraction defined as myelin volume divided by brain parenchymal volume were obtained from T1, T2, and PD maps.
We also investigated changes in T1, T2, PD, and VMY before and after GBCA administration, averaged across voxels in the brain parenchyma. GM and WM segmented by the FMRIB Automated Segmentation Tool (FAST; http://fsl.fmrib.ox.ac.uk/fsl/fslwiki/fast)16 using synthetic T1-weighted images were aggregated to be used as the whole-brain ROI, and mean values were recorded in each subject.
To investigate the effect of enhancing lesions on the measurement of myelin volume in the brain, an investigator (T.H.) manually segmented the brain metastases on post-contrast-enhanced synthetic T1-weighted images using the MRIcron software (http://people.cas.sc.edu/rorden/mricron/index.html). The total volume of brain metastases in each patient was recorded.
Statistical Analysis
The Shapiro-Wilk test was used to assess normality. Because not all data were normally distributed, we used the Wilcoxon signed rank test to compare tissue volumes and mean quantitative values in the brain before and after GBCA administration. These comparisons were performed separately in patients with or without metastasis. For patients with brain metastases, we used the Spearman rank order correlation coefficient to investigate the correlation between change in measured myelin volume and total volume of brain metastases. A 2-sided P < .05 was considered significant. All statistical analyses were performed using SPSS, Version .25 (IBM, Armonk, New York).
Results
Brain metastases were detected in 17 patients (11 men, 6 women; mean age, 61 ± 10 years), and no brain metastases were detected in 19 patients (10 men, 9 women; mean age, 66 ± 10 years). Among patients with brain metastases, the total volume of metastases was 4.84 ± 6.61 mL. Results of the automatic tissue-volume measurements are shown in the On-line Table, part of which is summarized in Fig 2. After GBCA administration, measurements of WM volume, myelin volume, and myelin fraction in patients with and without metastases were significantly increased (+26.65 and +29.42 mL, +10.14 and +12.46 mL, +0.88% and +1.09%, respectively); and GM volume, CSF volume, brain parenchymal volume, and ICV were significantly decreased (−36.23 and −34.49 mL, −20.77 and −18.94 mL, −6.76 and −2.84 mL, −27.41 and −21.84 mL, respectively), regardless of the presence of metastases. Measurement of unclassified non-WM/GM/CSF tissue volume within the ICV was increased, but the increase was not statistically significant.

Comparison of volumetric and myelin measurements derived via quantitative synthetic MR imaging pre- and postadministration of a gadolinium-based contrast agent. Based on the Wilcoxon signed rank test, asterisk = P < .05; double asterisks = P < .01; and triple asterisks = P < .001.
The effects of GBCA administration on T1, T2, and PD values are shown in the Table. In patients with and without metastasis, measurement of VMY was significantly increased (+0.78% and +0.75%, respectively), and measurements of T1, T2, and PD were significantly decreased after GBCA administration (−51.34 and −46.84 ms, −2.67 and −4.70 ms, and −1.05% and −1.28%, respectively). Visually obvious increases in VMY were observed in some patients (Fig 3). However, the correlation between change in measured myelin volume and total volume of brain metastases was not significant (Spearman ρ = −0.12, P = .64).

Representative quantitative maps of a patient with brain metastasis. T1-weighted image before (A) and after (F) administration of gadolinium-based contrast agent and quantitative maps overlaid on the T1-weighted image before (B–E) and after (G–J) administration of gadolinium-based contrast agents are shown. The brain metastasis shows contrast enhancement (arrows in A and F). The increase in myelin partial volume is clear in the brain metastasis on the myelin partial volume maps (arrows in B and G). The decreases in T1, T2, and proton density are clear in the brain metastasis on the T1 (arrows in C and H), T2 (arrows in D and I), and proton-density (arrows in E and J) maps.
T1, T2, PD values, and VMY determined via quantitative synthetic MRI pre- and postadministration of gadolinium-based contrast agenta
Discussion
In this study, we investigated the effects of GBCA on automatic brain tissue and myelin volumetry using quantitative synthetic MR imaging. The administration of GBCA had significant effects on both automatic brain tissue and myelin volumetry determined via quantitative synthetic MR imaging, with the exception of unclassified non-WM/GM/CSF tissue volume within the ICV. GBCA administration was followed by decreased T1, T2, and PD in the whole brain in ROI analysis.
GBCA administration decreased T1 and T2 in the whole brain in our study; this decrease can be explained by the shortening effect of GBCA on relaxation times. This effect was observed regardless of the presence of metastases, even in the absence of enhancing lesions. A previous study reported enhancement of perivascular spaces at 4 hours after intravenous administration of GBCA even in subjects without renal insufficiency.17 This suggests that the GBCA in blood vessels may have permeated the perivascular space and glymphatic system in the brain, thus resulting in decreases in T1, T2, and PD in the current study, even though post-GBCA MR imaging was performed only 7 minutes after GBCA administration. The exact cause of decreased PD after GBCA administration is unknown, but it has been suggested that the slight reduction in T1 relaxation of brain tissue due to the presence of GBCA in the capillary network may result in a slight decrease in the PD calculated, though PD should not be theoretically affected by T1.14 Furthermore, decreased PD in the CSF may have led to decreased measurement of ICV, which was determined at PD = 50%,18 also resulting in a decrease in apparent CSF volume.
To our knowledge, this is the first study that has evaluated the effects of GBCA on myelin measurement via MR imaging. Our study showed significantly increased myelin volume, myelin fraction, and VMY after GBCA administration. On synthetic MR imaging, myelin estimation is performed using predetermined parameters adjusted to healthy subjects for T1, T2, and PD in 4 partial volume compartments; VMY, cellular partial volume, free water partial volume, and excess parenchymal water partial volume, with VMY showing lower T1, T2, and PD values than the other compartments.10 Thus, decreases in T1, T2, and PD in the brain parenchyma should have contributed to increases in apparent myelin volume in the brain. Investigators and clinicians should be cautious when assessing VMY measured via quantitative synthetic MR imaging in patients in whom GBCA was administered. In particular, estimated myelin of some brain metastases was apparently increased in quantitative synthetic MR imaging after GBCA administration in the current study; thus, it is necessary to be cautious when measuring VMY in enhanced lesions. However, in the current study, the total volume of brain metastases did not significantly correlate with the measured total myelin volume in the brain.
Several other methods have been proposed for myelin imaging,19,20 and GBCA may have different effects on other methods than it had on the methods used in the current study. The effects of GBCA on other myelin measurement methods remain to be determined, but methods based on relaxometry (eg, macromolecular tissue volume,21 myelin water imaging,20 and the ratio of T1-weighted and T2-weighted images22) are expected to be affected by GBCA, as implied by the results of ROI analysis in the present study. Notably, the absolute myelin content value in a voxel is especially important when calculating the g-ratio, which is the inner-to-outer diameter of a myelinated nerve fiber, in combination with diffusion MR imaging.23
Apparently increased WM volume and decreased GM volume, CSF volume, brain parenchymal volume, and ICV after GBCA administration in the current study are partially concordant with a report by Warntjes et al.14 In that study, there were no statistically significant differences in WM volume, GM volume, or brain parenchymal volume after GBCA administration, even though they used a sample size of 20, which is similar to the number of subjects included in our study. This result could be partly due to the differences in imaging time delay after GBCA administration and acquisition time, which were 3 minutes and 1 minute longer than those in the present study, respectively. It has been reported that imaging time delays of 1 minute and 5 minutes after GBCA administration lead to higher contrast of brain metastases than a 10-minute delay.24 Furthermore, differences in the age of the patients and selected patient groups and use of a greater variety of contrast agents in our study may have also contributed to the differences in the size of effects caused by GBCA in our study and theirs. Tissue clusters in synthetic tissue mapping are derived using predetermined T1, T2, and PD values in the T1-T2-PD space, with T1, T2, and PD higher for GM than for WM.7 Thus, the decreases in T1, T2, and PD values revealed by ROI analysis in the present study should all have contributed to increased measurements of WM volume and decreased GM volume.
Even though differences in the measured WM volume, CSF volume, non-WM/GM/CSF, and brain parenchymal volume between pre- and postadministration of GBCA in our study were much smaller than the differences in patients with MS and matched healthy controls as reported by Warntjes et al,14 differences in measured GM volume (−36 mL without metastasis and −34 mL with metastasis) between pre- and postadministration of GBCAs in our study were slightly larger than the difference in measured GM volume in patients with MS and matched healthy controls observed in their study (−22 mL). Thus, GM volume should be more cautiously evaluated than other tissue volumes in patients with MS after administration of GBCA. Changes in brain parenchymal volume after administration of GBCA (−0.55% without metastasis and −0.24% with metastasis) in our study were comparable with those previously observed in patients with MS for the atrophy rate per year (−0.273%) using synthetic MR imaging.25 Therefore, caution is warranted when evaluating longitudinal changes in brain parenchymal volume of patients with MS after administration of GBCA. However, these changes are also comparable with repeatability of up to 0.40%, calculated as the coefficient of variation reported in brain parenchymal volume measured by synthetic MR imaging.6
A limitation of the current study was that only a single dose of GBCA and a single time point after administration were investigated. Although we controlled these variables carefully, the absolute GBCA concentration may have varied among patients due to weight, blood volume, and renal function. In addition, the number of times GBCAs had been administered to the patients in the current study in the past was unknown. Recently, the deposition of gadolinium in the brain has been extensively investigated,26⇓⇓⇓⇓–31 and the more GBCAs are administered, the more gadolinium is deposited in the brain. Therefore, past administration of GBCA may have some effect on the automatic calculation of brain tissue and myelin volumes via quantitative synthetic MR imaging.
Conclusions
The administration of GBCA had significant effects on the automatic calculation of brain tissue and myelin volumes using quantitative synthetic MR imaging. Measurement of VMY was increased in ROI analysis, and T1, T2, and PD were decreased in the whole brain after GBCA administration. It is necessary for researchers, clinicians, and interpreting radiologists to be cautious when investigating brain tissue volumes and myelin based on quantitative synthetic MR imaging after GBCA administration.
Footnotes
Tomoko Maekawa and Akifumi Hagiwara contributed equally to this work.
Disclosures: Akifumi Hagiwara—RELATED: Grant: Japan Society for Promotion of Science KAKENHI, Comments: grant No. 16K19852. Shigeki Aoki—RELATED: Grant: government funding*; UNRELATED: Grants/Grants Pending: Bayer, Daiichi Sankyo, Eisai, Fujiyakuhin, Fujifilm, Nihon Medi-Physics, Comments: grant for diagnostic radiology*; Payment for Lectures Including Service on Speakers Bureaus: GE Healthcare, Toshiba, Canon, Siemens, Bayer Yakuhin, Daiichi Sankyo, Eisai, Fujiyakuhin, Fuji Film RI, Mediphysics, Guerbet, Novartis, Comments: honorarium for lectures/chair*; Travel/Accommodations/Meeting Expenses Unrelated to Activities Listed: GE Healthcare, Comments: GE Healthcare provided support to visit Wisconsin and Mayo Clinic to see the new MR imaging machines. *Money paid to the institution.
This work was supported by the Japan Society for Promotion of Science, KAKENHI grant No. 16K19852; and grant No. JP16H06280, Grant-in-Aid for Scientific Research on Innovative Areas, resource and technical support platforms for promoting research, “Advanced Bioimaging Support.” This work was funded by the Impulsing Paradigm Change through Disruptive Technologies (ImPACT) program of the Council for Science, Technology and Innovation (Cabinet Office, Government of Japan). This work was also supported by the program for Brain Mapping by Integrated Neurotechnologies for Disease Studies (Brain/MINDS) from the Japan Agency for Medical Research and Development.
Indicates open access to non-subscribers at www.ajnr.org
References
- Received July 4, 2018.
- Accepted after revision November 12, 2018.
- © 2019 by American Journal of Neuroradiology


