
Abstract
BACKGROUND AND PURPOSE: Multifocal glioblastomas (ie, glioblastomas with multiple foci, unconnected in postcontrast pretreatment T1-weighted images) represent a challenge in clinical practice due to their poor prognosis. We wished to obtain imaging biomarkers with prognostic value that have not been found previously.
MATERIALS AND METHODS: A retrospective review of 1155 patients with glioblastomas from 10 local institutions during 2006–2017 provided 97 patients satisfying the inclusion criteria of the study and classified as having multifocal glioblastomas. Tumors were segmented and morphologic features were computed using different methodologies: 1) measured on the largest focus, 2) aggregating the different foci as a whole, and 3) recording the extreme value obtained for each focus. Kaplan-Meier, Cox proportional hazards, correlations, and Harrell concordance indices (c-indices) were used for the statistical analysis.
RESULTS: Age (P < .001, hazard ratio = 2.11, c-index = 0.705), surgery (P < .001, hazard ratio = 2.04, c-index = 0.712), contrast-enhancing rim width (P < .001, hazard ratio = 2.15, c-index = 0.704), and surface regularity (P = .021, hazard ratio = 1.66, c-index = 0.639) measured on the largest focus were significant independent predictors of survival. Maximum contrast-enhancing rim width (P = .002, hazard ratio = 2.05, c-index = 0.668) and minimal surface regularity (P = .036, hazard ratio = 1.64, c-index = 0.600) were also significant. A multivariate model using age, surgery, and contrast-enhancing rim width measured on the largest foci classified multifocal glioblastomas into groups with different outcomes (P < .001, hazard ratio = 3.00, c-index = 0.853, median survival difference = 10.55 months). Moreover, quartiles with the highest and lowest individual prognostic scores based on the focus with the largest volume and surgery were identified as extreme groups in terms of survival (P < .001, hazard ratio = 18.67, c-index = 0.967).
CONCLUSIONS: A prognostic model incorporating imaging findings on pretreatment postcontrast T1-weighted MRI classified patients with glioblastoma into different prognostic groups.
ABBREVIATIONS:
- CE
- contrast-enhancing
- c-index
- concordance index
- GBM
- glioblastoma
- HR
- hazard ratio
- IPSLV
- individual prognosis score based on the focus with the largest volume
- IPSLVS
- individual prognosis score based on the focus with the largest volume and surgery
- IPSLW
- individual prognosis score based on the focus with the largest width
- IPSLWS
- individual prognosis score based on the focus with the largest width and surgery
- MGBM
- multifocal glioblastoma
The computation of quantitative, radiomic features from MR imaging to construct imaging biomarkers has gained attention in recent years, due to its potential practical applications. The main premise of radiomics is that clinical end points could be more often associated with quantitative voxel-based features than with the more qualitative radiologic and clinical data used today.1
Glioblastomas (GBMs) are the most common and deadliest type of primary brain tumor. Even with the best current standard of care, the median survival of patients with GBM is only 14 months.2 Contrast-enhanced (CE) T1-weighted and T2/FLAIR MR imaging sequences are the mainstay for GBM diagnosis, treatment planning, and follow-up,3 and many authors have investigated the use of image-based quantifiers as predictors of survival.2,4⇓⇓⇓⇓⇓⇓⇓⇓–13
GBMs frequently appear as solitary lesions at diagnosis on CE-T1-weighted MRI, but multiple enhancing lesions can occur. In these cases, tumors are termed “multifocal” if there is a connection between enhancing lesions (typically visible on FLAIR sequences)2 or, less commonly, “multicentric” when no communication is demonstrated.14 However, no pathologic or prognostic differences have been found between multifocal and multicentric GBMs,15⇓⇓–18 so the convention of denoting both as multifocal GBM (MGBM) is followed here.
MGBMs account for 10%–20% of all GBMs.17,19 Their prognosis is generally poor, with a median survival of 6–8 months from diagnosis,14,20 which may be due to a more aggressive phenotype and the difficulties in performing therapy safely.
In this study, we constructed 3D morphologic image-based measures for MGBMs obtained from pretreatment volumetric CE-T1-weighted MRI. Those features were used to build prognostic models for patients with MGBM.
Materials and Methods
Patients
The study was approved by the institutional review boards of the participating institutions.
We retrospectively reviewed 1155 patients with GBMs from 10 local medical institutions diagnosed during 2006–2017 with pathologically proved GBMs according to the 2007 World Health Organization Classification of Tumors of the Central Nervous System. Inclusion criteria for this study were the following: multiple foci of enhancing tumor and availability of the relevant clinical variables: age, treatment followed (surgery type, radiation therapy, and/or chemotherapy), survival information at last follow-up, and availability of a pretreatment volumetric contrast-enhanced T1-weighted MR imaging sequences (slice thickness, ≤2.00 mm; no gap; pixel spacing, ≤1.20 mm). Only 97 patients with MGBM (8.40%, 62 ± 13 years of age, 48% women and 52% men) with 239 tumors fulfilled these criteria.
Overall survival was computed from the date of the preoperative MR imaging until death or last follow-up examination (censored events). Patients lost to follow-up were considered censored. Treatment followed after resection or biopsy consisted of radiation therapy and chemotherapy, following the Stupp scheme whenever possible. The Table shows the main patient characteristics.
Summary of patient characteristics and MR imaging and volumetric parameters for the cohort of patients with MGBM considered in the study
Image Acquisition
The pretreatment volumetric CE-T1-weighted MR imaging sequence was gradient-echo using 3D spoiled gradient recalled-echo or 3D fast-field echo after intravenous administration of a single dose of gadobenate dimeglumine (0.10 mmol/kg) with a 6- to 8-minute delay.
MR images were acquired with a 1.5T (n = 87) or 3T (n = 10) scanner with TR/TE, 6–22/1.5–10 ms. GE Healthcare (Milwaukee, Wisconsin) (n = 51), Philips Healthcare (Best, the Netherlands) (n = 30), and Siemens (Erlangen, Germany) (n = 16) scanners were used.
Other image and patient characteristics are summarized in the Table.
Image Analysis
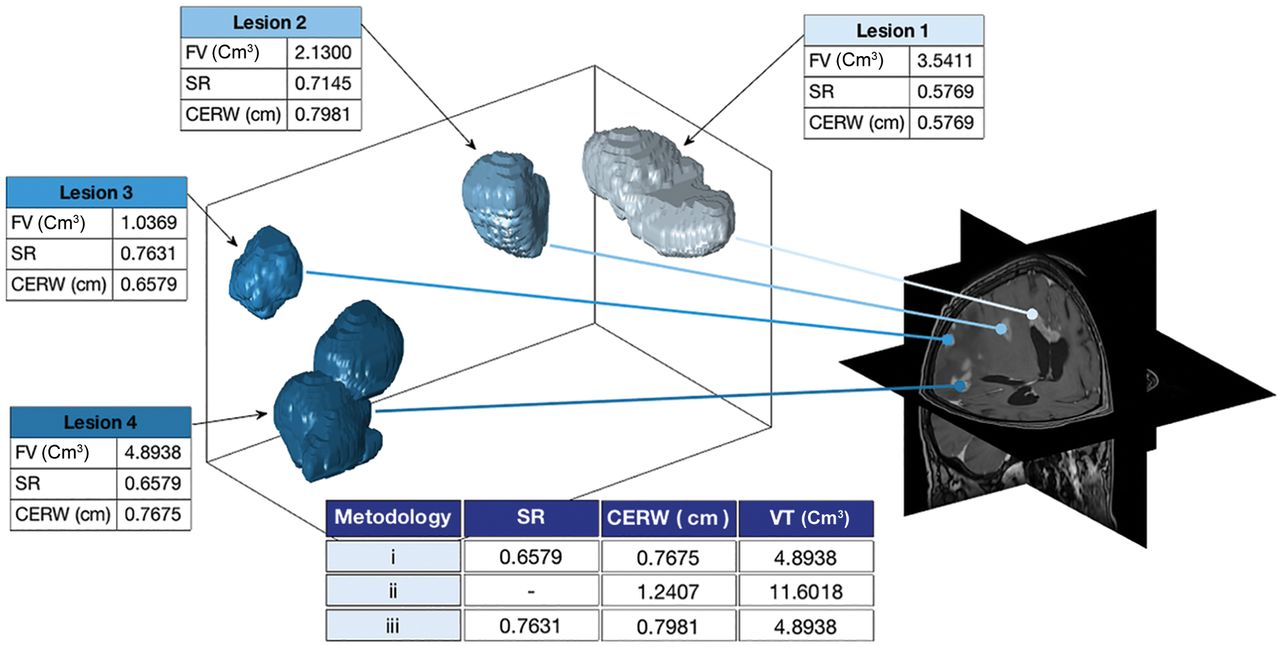
MRIs were retrospectively analyzed by the same image expert (J.P.-B. with 5 years of experience). The DICOM files were imported into the scientific software Matlab (R2017b; MathWorks, Natick, Massachusetts). Each MGBM lesion was automatically delineated using a gray-level threshold chosen to identify the CE tumor volume. Then, segmentations were corrected manually slice by slice using in-house software. Necrotic tissue was defined as hypointense tumor regions inside CE tissue. Figure 1 shows an example of the segmentation and 3D reconstruction of tumors for a patient with MGBM.

3D reconstruction of the different foci in a patient with multifocal glioblastoma. Morphologic measures are computed for each focus following the different methodologies discussed in the Materials and Methods section, including focus volume (FV), contrast-enhanced rim width (CERW), surface regularity (SR), and volume in total (VT).
Geometric Measures
The contrast-enhancing (VCE), necrotic (or inner) (VI), and total volumes (V = VCE + VI) were computed for each focus. Contrast-enhancing spheric rim width (CE rim width) obtained for each focus from the CE and necrotic volumes is represented as
 It measures the averaged width of the CE areas by assuming the sphericity of necrotic and total tumor regions. More details, with examples of tumors with high and low CE rim widths, can be found in Pérez-Garcia et al.21
Surface was obtained from the discrete sets of voxels defining the tumor by reconstructing the tumor surface using the Matlab “isosurface” command.
Surface regularity (SR) is a dimensionless ratio between the segmented tumor volume and the volume that a spheric tumor with the same surface would have. It was computed for each focus as
 This parameter is bounded between 0 (“complex” tumors with very irregular surfaces) and 1 (spheric tumors). More details, with examples of tumors with high and low CE rim widths, can be found in Pérez-Beteta et al.7
Maximum diameter was computed for each focus as the maximal distance between 2 points located on the surface of the CE tumor and provides the largest longitudinal measure of the tumor.
Due to the multiple nature of tumors, morphologic measures for each patient were calculated using 3 different methodologies: 1) computed on the focus with the largest volume, 2) considering the different tumor foci as an aggregated tumor, and 3) considering the highest value for each measure computed for the different foci. Methodology 2 did not apply to CE rim width, surface regularity, and maximum diameter. For surface regularity, methodology 3 was computed using the highest irregularity (lowest value). Figure 1 shows an example of the different methodologies.
Statistical Methods
We used Kaplan-Meier analysis to identify individual parameters associated with prognosis, using the log-rank test to assess the significance of the results. A 2-tailed significance level of <.05 was applied. For each parameter, we analyzed all possible thresholds splitting patients population in two groups satisfying that patient populations sizes have ratios <5:1. Then, the lowest log-rank P value in an interval of contiguous significant threshold values was selected.21 Univariate Cox proportional hazards regression analysis was used to obtain the hazard ratio (HR) and its adjusted 95% confidence interval.
The Spearman correlation coefficient was used to assess the dependence among variables.
Multivariate Cox proportional hazards analysis with the stepwise Wald method was used to construct prognostic models. SPSS software (Version 22.0.00; IBM, Armonk, New York) was used for the statistical analysis.
The concordance index (c-index) between the predicted hazard using a multivariate Cox proportional hazards overall survival model and final outcome was also computed to evaluate the performance of the models constructed.22
Results
Ninety-seven patients with MGBMs (62 ± 13 years of age, 48% women and 52% men) composed the population of the study. Seven patients were censored, and the median survival of our population was 7.39 months.
Independent Predictors of Survival
Kaplan-Meier analysis provided age (P < .001, HR = 2.11, c-index = 0.71), surgery (ie, patients undergoing surgical resection compared with those undergoing biopsy; P < .001, HR = 2.04, c-index = 0.71), and CE rim width as the most significant parameters. CE rim width yielded statistically significant results when computed for the tumor focus showing the largest volume (P < .001, HR = 2.15, c-index = 0.70) and considering the largest CE rim width value obtained for all foci of a given patient (P = .002, HR = 2.05, c-index = 0.67).
Surface regularity was also statistically significant, both when computed for the focus with the largest volume (P = .02, HR = 1.66, c-index = 0.64) and when considering the smallest value on all foci (P = .04, HR = 1.64, c-index = 0.600).
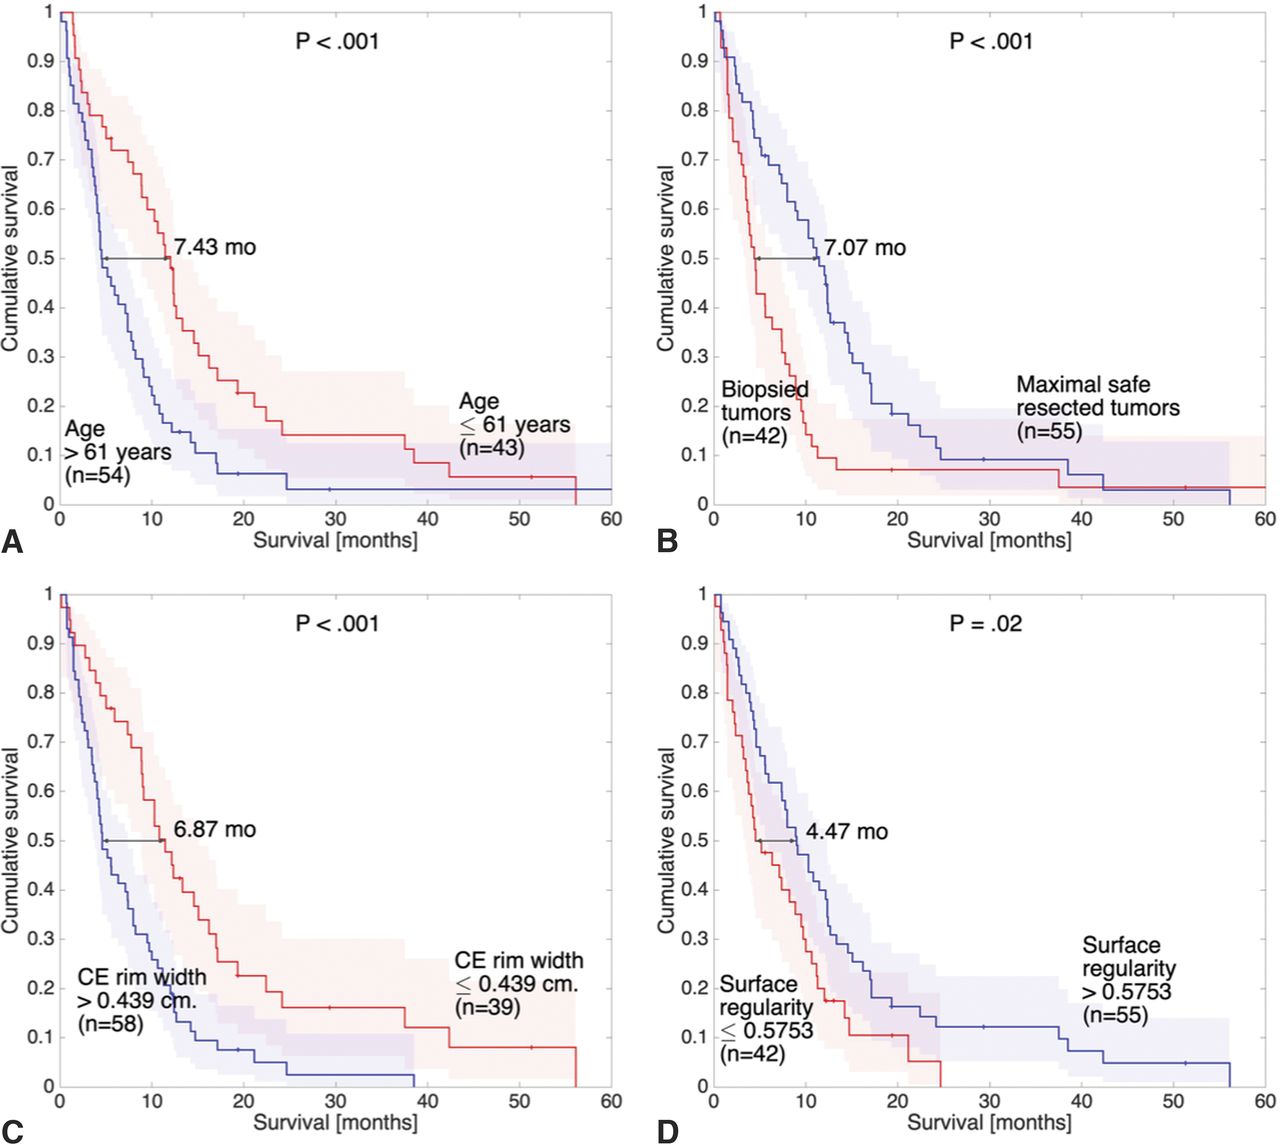
No other volume- or surface-based parameter reached significant results. Figure 2 shows the Kaplan-Meier graphs of age (Fig 2A), surgery (Fig 2B), CE rim width (Fig 2C), and surface regularity (Fig 2D) measured on the foci with the largest volume.

Kaplan-Meier plots of some of the significant prognostic parameters of the study. Curves correspond to age (A), surgery (B), CE rim width (C), and surface regularity (D) measured on the foci with the largest volume (similar results were found for the latter 2 parameters measured on foci with the highest values).
Age, CE rim width, and surface regularity were correlated with neither each other nor other volumetric or surface-based parameters. Volumes (total, CE, and necrotic), maximum diameter, and total surface (ie, all of the “size”-related measures) showed high and significant correlations. Figure 3 shows the correlations among all the parameters computed using the different methodologies.
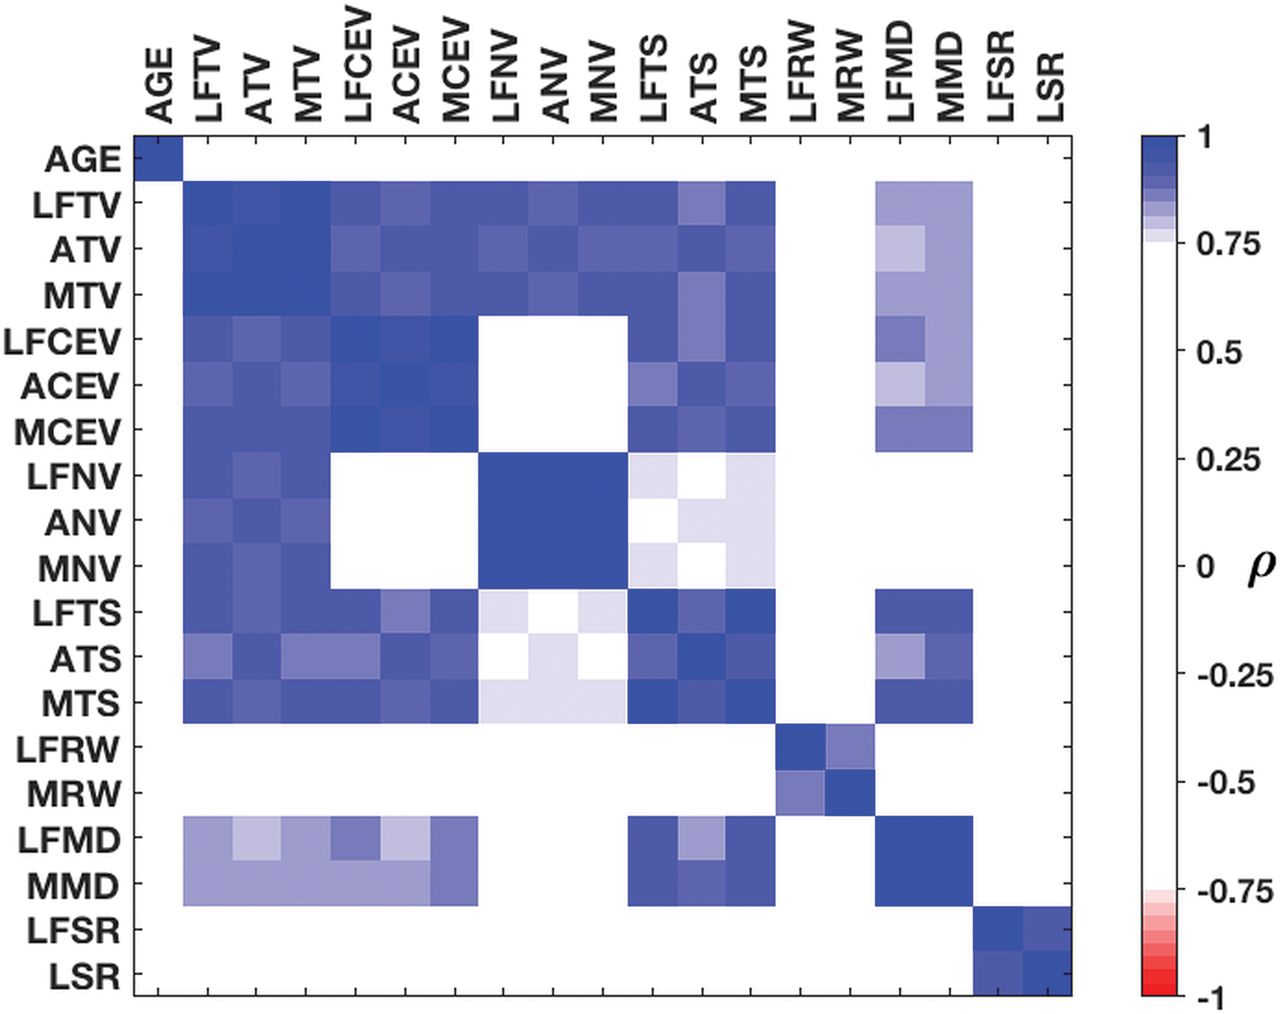
Spearman correlations between the measures. Correlation values between variables of >0.75 are regarded as strong. AGE indicates age. The prefixes LF, A, and M indicate the largest focus, aggregated, and maximum, respectively, regarding the 3 methodologies used. Regarding the suffixes, TV indicates tumor volume; CEV, CE volume; NV, necrotic volume; TS, total surface; RW, CE rim width; MD, maximum diameter; SR, surface regularity; LSR, lowest surface regularity.
Prognostic Value of Multivariate Linear Models
Multivariate Cox regression was used to construct prognostic models joining the significant noncorrelated parameters of the study. The model retained only age and both CE rim widths as relevant parameters for building prognostic models. Because different CE rim widths were correlated, 2 different models were constructed.
When combining age and the CE rim width measured on the focus with the largest volume, we obtained a first Cox-based prognostic model (individual prognosis score based on the focus with the largest volume [IPSLV]). The best Kaplan-Meier threshold for this model (2.18) obtained an excellent differentiation among groups (P < .001, HR = 2.56, c-index = 0.78, median survival difference = 7.98 months).
The second model was constructed by considering the largest CE rim width of each patient computed on the different foci (individual prognosis score based on the focus with the largest width [IPSLW]). The best result was obtained for IPSLW = 2.14 (P < .001, HR = 3.04, c-index = 0.80, median survival difference = 10.00 months).
The addition of surface regularity to these models worsened the results. The On-line Table shows the prognostic value of all the individual parameters and multivariate models considered.
New instances of the 2 models described in the previous section were constructed including the surgical treatment (maximal safe resection or biopsy). When combining the IPSLV with surgical information (individual prognosis score based on the focus with the largest volume and surgery [IPSLVS]), results were substantially improved (P < .001, HR = 3.00, c-index = 0.85, median survival difference = 10.55 months). There were many thresholds giving significant results in the Kaplan-Meier analysis. The best threshold was 1.45, and the equation of the model was
 where in this equation “Surgery” takes value 1 for maximal safe resection and 0 for biopsy. Figure 4A shows the Kaplan-Meier curve of the IPSLVS.
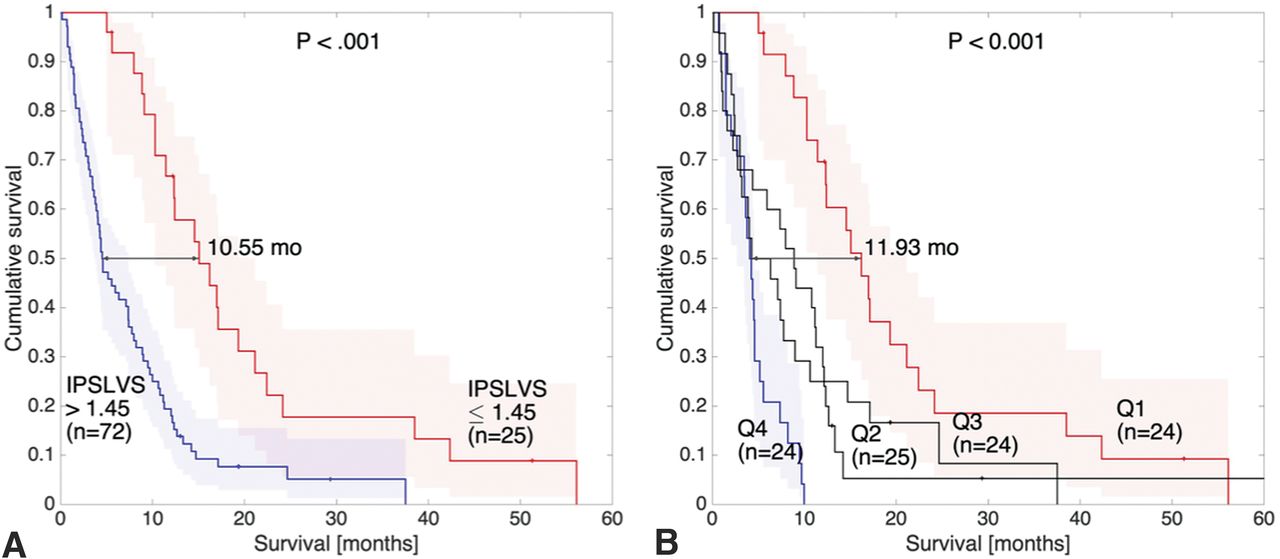
Kaplan-Meier plots of the IPSLVS model considering the whole cohort of patients (A) and considering its 4 quartiles (Q1, Q2, Q3, and Q4) (B). Differences between quartiles of the highest (>2.619, Q4) and lowest (<1.43, Q1) IPSLVS values are emphasized.
The IPSLW combined with surgery (individual prognosis score based on the focus with the largest width and surgery [IPSLWS]) obtained a better differentiation among groups than its presurgical instance (P < .001, HR = 2.72, c-index = 0.81, median survival difference = 7.98 months), with 1.525 as the best threshold. The On-line Table shows the results of these multivariate models.
Extreme Groups of IPSLVS Model
Using the IPSLVS model, we split the patient population into 4 groups of equal size (24 patients): the first quartile (Q1) contained patients with an IPSLVS below 1.43, the second quartile (Q2) joined patients with an IPSLVS between 1.43 and 1.91, the third quartile (Q3) contained patients with an IPSLVS between 1.91 and 2.619, and the fourth quartile (Q4) joined patients with an IPSLVS above 2.619. A Kaplan-Meier analysis showed that there were no statistical differences between Q2 and Q3 (P = .827, HR = 1.07, c-index = 0.513), while significant differences were observed between these 2 quartiles and Q1 (P < .001, HR = 3.10, c-index = 0.806 and P = .005, HR = 2.41, c-index = 0.802, respectively) and Q4 (P = .001, HR = 2.94, c-index = 0.670 and P = .036, HR = 1.95, c-index = 0.606, respectively).
Then, quartiles of patients with the highest (>2.619) and lowest (<1.43) IPSLVS values, that is, Q4 and Q1 respectively, were compared using a Kaplan-Meier analysis, and highly significant differences (P < .001, HR = 18.67, c-index = 0.97, median survival difference = 11.93 months) were found. Figure 4B shows the Kaplan-Meier plot of the 4 quartiles but focuses on the differences between the extreme quartiles Q4 and Q1.
Discussion
In this study, we used different methodologies to find prognostic morphologic imaging biomarkers for MGBM. Pretreatment postcontrast T1-weighted CE rim width computed for the focus with the largest volume or the extreme CE rim width for each patient was highly prognostic and was added to patient's age to develop pretreatment multivariate models. The addition of the type of surgery improved the results of the model.
Finding groups of patients with MGBMs with potentially better survival is of relevance for clinical practice. Moreover, there are still no clear clinical guidelines for these patients.16⇓⇓⇓–20,23 Some clinical variables (age, Karnofsky Performance Status (KPS), type of treatment, extent of surgery, and radiation dose) have been previously found to have prognostic information in limited studies of MGBMs.14,16⇓–18,23 However, no morphology-based imaging biomarkers have been developed.
In this article, we used different methodologies to characterize tumor morphologies and investigate their relationships to patient outcome. The best ones were measuring features in the focus with the largest volume and considering the highest value computed for the different foci. The first methodology was grounded in the hypothesis that the largest focus could be the one determining patient outcome. The latter was chosen under the hypothesis that the most aggressive lesion, independent of their size, could be the ones determining patient outcome. Correlations between these 2 methodologies were high and significant for all measures having prognostic value.
CE rim width and surface regularity were identified as independent predictors of survival. The former measure was hypothesized24 and found21 to correlate with tumor growth speed on unifocal GBMs. Also, tumor boundary regularity on MR imaging had prognostic value on unifocal GBMs.7,8 Age showed significant results in our study, in line with other studies.14,17,18 In addition, patients significantly benefited from an operation in our analysis, while the literature has shown contradictory results.16,19,23 Most interesting, CE rim width showed a prognostic value as high as age and surgery in our study. On the other hand, volume- and surface-based morphologic parameters (including total, necrotic, and CE tumor volume) were not predictors of survival, while contradictory results have been found in the literature.12,13,25,26 Recently, it has been hypothesized that these contradictions could be due to different proportions of patients undergoing different types of surgical resections.27
Multivariate Cox-based models were developed by combining age, CE rim width, and surface regularity. The latter added no information to the models, possibly due to the addition of complexity on models constructed over a dataset of limited statistical power, so it was finally removed. Both significant measures of MGBM CE rim width were used to construct accurate prognostic models (c-indices of 0.779 and 0.801 for IPSLV and IPSLW, respectively). Adding surgical information to the models improved the results (c-indices of 0.853 and 0.810 for IPSLVS and IPSLWS, respectively).
Quartiles of patients with the highest (worst prognosis) and lowest (best prognosis) IPSLVS had a median survival difference of 11.93 months and obtained an outstanding c-index of 0.967. All patients in the quartile of highest IPSLVS survived <10 months.
The multivariate models constructed in this article for MGBMs had prognostic values higher than the best models reported in studies for unifocal tumors.6⇓⇓⇓⇓⇓⇓–13
This study has several strengths: First, it is novel in finding MR imaging–derived measures with prognostic value for MGBM.14,16⇓⇓–19,23 Second, it was performed on a large dataset by MGBM standards.14,17,23 Third, this new form of analysis compares different methodologies and establishes an initial pathway to analyze the aggressiveness of MGBMs using pretreatment data. Fourth, the study provides real clinical practice data, while limitations of clinical trials are commonly encountered. Fifth, it only uses simple morphologic features that can be obtained straightforwardly from segmented tumors.
Regarding the limitations, public MGBM data is sparse. Specifically, The Cancer Imaging Archive28 only contained 13 patients with MGBM satisfying the inclusion criteria, and many of them were censored. As a result, we could not validate our findings on external public databases. Also, the overall size of our population (97 patients) was relatively small, and 7% of patients were censored. The second limitation was the lack of genetic and molecular information for the cohorts, which precluded the identification of a possible correlation between the groups found on the basis of imaging data and biologic features. The third limitation is that although there was great effort to homogenize data, given the multicenter nature of the study, there were differences in the imaging protocols or clinical follow-up. The fourth limitation is that due to these differences, the manual segmentation process has a degree of subjectivity, though all segmentations were performed by the same image expert.
Conclusions
This study addressed the prognostic value of meaningful morphologic imaging parameters obtained from pretreatment volumetric CE-T1-weighted MRI of patients with MGBM. Age, surgery, CE rim width, and surface regularity were significant independent parameters in terms of survival, and a combined model linking age, surgery, and CE rim width improved the results. The index obtained allowed patients to be classified into 2 groups with substantially different prognoses.
Acknowledgments
We thank J.A. Ortiz Alhambra (Mathematical Oncology Laboratory) and A. Fernández-Romero (Mathematical Oncology Laboratory) for their help in the tumor segmentation tasks. We also thank C. López (Radiology Department, Hospital General de Ciudad Real), M. Claramonte (Neurosurgery Department, Hospital General de Ciudad Real), L. Iglesias (Neurosurgery Department, Hospital Clínico San Carlos), J. Avecillas (Radiology Department, Hospital Clínico San Carlos), J. M. Villanueva (Radiology Department, Hospital Universitario de Salamanca), and J.C. Paniagua (Radiology Department, Hospital Universitario de Salamanca) for their help in the data collection.
Footnotes
Drs Pérez-Beteta and Molina-García contributed equally to this work.
Disclosures: Juan M. Sepúlveda—UNRELATED: Consultancy: Pfizer, Bayer AG; Payment for Development of Educational Presentations: Astellas Pharma, Pfizer; Travel/Accommodations/Meeting Expenses Unrelated to Activities Listed: Ipsen. Estanislao Arana—UNRELATED: Employment: Ivo Foundation, Comments: consultant radiologist.
This work was supported by the Ministerio de Economía y Competitividad/Fondo Europeo de Desarrollo Regional (FEDER), Spain (grant No. MTM2015–71200-R) and the James S. McDonnell Foundation 21st Century Science Initiative in Mathematical and Complex Systems Approaches for Brain Cancer (Collaborative Award 220020450).
Indicates open access to non-subscribers at www.ajnr.org
REFERENCES
- Received September 25, 2018.
- Accepted after revision February 25, 2019.
- © 2019 by American Journal of Neuroradiology


Jump to section
Related Articles
Cited By...
- No citing articles found.