
Abstract
BACKGROUND AND PURPOSE: DTI has been proved valuable for the diagnosis of degenerative cervical myelopathy, whereas its capacity for predicting the outcome of surgery is still under debate. Here we conduct a prospective cohort study to analyze the capacity of DTI for evaluating and predicting laminoplasty surgery outcome for degenerative cervical myelopathy.
MATERIALS AND METHODS: We recruited 55 patients with degenerative cervical myelopathy who underwent DTI before surgery and at 3- and 6-month follow-up stages, and 20 healthy subjects. For clinical assessment, the modified Japanese Orthopedic Association scale was recorded for each patient at different stages. DTI metrics were compared between patients before surgery and healthy subjects. Spearman correlation and receiver operating characteristic were used to analyze the evaluation and prediction capacity of DTI for the modified Japanese Orthopedic Association scale, respectively. We analyzed different vertebral levels: maximal compression level, average of all compression levels, and C2 level.
RESULTS: DTI metrics were significantly different between patients before surgery and healthy subjects. Before surgery, DTI for the maximal compression level or DTI for the average of all compression levels had no significant correlation with the modified Japanese Orthopedic Association scale. For all stages, DTI at the C2 level was correlated with the modified Japanese Orthopedic Association scale. DTI metrics at the C2 level before surgery were significantly correlated with the postoperative modified Japanese Orthopedic Association scale recovery rate. Receiver operating characteristic analysis demonstrated that fractional anisotropy at C2 was capable of predicting the postoperative modified Japanese Orthopedic Association scale recovery rate (P = .04).
CONCLUSIONS: The DTI metrics before laminoplasty surgery, especially fractional anisotropy at the C2 level, have the potential for evaluating and predicting the degenerative cervical myelopathy surgery outcome.
ABBREVIATIONS:
- AC
- all compression
- AD
- axial diffusivity
- DCM
- degenerative cervical myelopathy
- FA
- fractional anisotropy
- MC
- maximal compression
- MD
- mean diffusivity
- mJOA
- modified Japanese Orthopedic Association scale
- RD
- radial diffusivity
- ROC
- receiver operating characteristic
Degenerative cervical myelopathy (DCM) is one of the most common causes of chronic spinal cord dysfunction.1 Decompression surgery, including anterior and posterior surgery, is widely used in the treatment of DCM. However, the surgery outcome can vary among different patients. Therefore, a reliable tool is required to evaluate and predict the surgery outcome for patients with DCM.
Noninvasive MR imaging is routinely used for the diagnosis of DCM, especially T2-weighted MR imaging, which can provide high-resolution images of anatomic structures and superior contrast in the spinal cord. In recent years, diffusion MRI2 has been used for the evaluation of spinal cord function. By measuring the Brownian motion of water molecules, diffusion MR imaging can depict microstructures in living tissue. On the basis of diffusion MR imaging, DTI acquires diffusion-weighted images along multiple directions; then, quantitative metrics can be calculated, including fractional anisotropy (FA), axial diffusivity (AD), radial diffusivity (RD), and mean diffusivity (MD).
Previous studies have shown that DTI has higher sensitivity in the diagnosis of DCM compared with T2-weighted MR imaging.3,4 The ADC is higher and FA values are lower in patients with DCM than in healthy individuals,5,6 and there are significant differences between preoperation and postoperation.7,8 In addition, it has been shown that FA is significantly correlated with clinical assessment of the modified Japanese Orthopedic Association scale (mJOA),9⇓⇓⇓-13 the most frequently used clinical assessment for patients with DCM.
Although DTI has proved valuable for the diagnosis of DCM, its capability for predicting the outcome of surgery is still under debate. Here, we briefly summarize the results from previous publications (Table 1). We included 7 articles studying the correlation between preoperative DTI metrics (FA) and postoperative mJOA scale, reported from 2013 to 2019. Two articles9,14 claimed a nonsignificant correlation, while the rest5,15⇓⇓-18 claimed a significant correlation. Note, Shabani et al18 showed a negative correlation between preoperative FA and the postoperative ΔmJOA (difference between post- and preoperative mJOA), while the other studies showed a positive correlation. Wen et al15 claimed that the mean FA value of C3 through C7 vertebral levels before surgery is significantly correlated with the postoperative mJOA recovery rate, while the FA value at the maximal compression (MC) level is not. Different correlation methods, prediction indexes, and surgery methods were adopted in these studies, which are listed in Table 1.
Summary of previous studies about prediction of DCM surgery outcome using DTI
The purpose of this study was to further investigate the evaluation and prediction ability of DTI for the surgery outcome of patients with DCM. Specifically, only patients with posterior laminoplasty surgery with nonmetal coral implants were included. Different from practices in previous studies, we acquired DTI data not only before surgery but also at 3 and 6 months after surgery. Using the acquired data, we analyzed the difference in preoperative DTI metrics at different vertebral levels between patients and healthy subjects, the correlation between DTI and mJOA at different stages before and after surgery, and the correlation between the preoperative DTI and the postoperative mJOA recovery rate.
MATERIALS AND METHODS
Subjects and Clinical Assessment
From January 2017 to December 2017, fifty-five patients diagnosed with DCM (21 women, 35–72 years of age; mean, 58.6 ± 6.8 years) and 20 healthy subjects (6 women, 50–65 years of age; mean, 57.29 ± 5.0 years) were recruited with written consent. This study was approved by the Review Board of Research Ethics in Jishuitan Hospital. The information for all patients is summarized in On-line Table 1. The inclusion criteria were patients with DCM with the following: 1) spinal cord compression of >3 vertebral levels caused by disk herniation, ossification of the posterior longitudinal ligament, ossification of the ligamentum flavum, cervical spondylosis, or spinal canal stenosis; 2) ages from 18 to 80 years; 3) regular conservative treatment that was ineffective, with posterior cervical laminoplasty planned; and 4) no clear contraindication for surgery. The exclusion criteria were those who were not able to undergo MR imaging, had a history of spine surgery, or had injury of spinal cord or nerve root due to an operation, from which the patient was not sufficiently recovered at the final-stage follow-up.
All patients underwent posterior cervical laminoplasty with nonmetal coral implants. Therefore, no metal artifacts were expected on the MR images. Each patient was clinically assessed using the mJOA before surgery and at 3 follow-up stages: 3 months (completed in 44 patients), 6 months (completed in 37), and 1–2 years (completed in 52) after the operation. The clinical assessment was scored by 2 board-certified spine surgeons. For each patient, he or she was scored by the same surgeon at different follow-up stages.
In addition, for each patient, we calculated the mJOA recovery rate to represent the surgery outcome, defined as the following: final-stage follow-up mJOA – preoperative mJOA) / (17 – preoperative mJOA) × 100%, where 17 refers to the full score of the mJOA.
MR Imaging Data Acquisition
MR imaging data were acquired on an Ingenia 3T scanner (Philips Healthcare) with a 16-channel head-neck coil. Three MR images were obtained for each patient, before surgery and at 3- and 6-month follow-up. DTI data were acquired using a single-shot EPI sequence on the axial view, with 17 slices in total covering the vertebral levels from C2 to C7, shown in Fig 1. The imaging plane was parallel to the intervertebral disk at the maximal compression level. The reduced-FOV technique (FOV = 60 × 160 mm2), outer volume suppression,19,20 was used to reduce image distortion, with 2 saturation bands applied at both the anterior and posterior sides to suppress foldover artifacts. Three b-values were used, b = 0, 1000 s/mm2, and 2000 s/mm2. The parameters were the following: number of signal averages = 1; number of diffusion directions = 32; sensitivity-encoding factor = 2; partial Fourier factor = 0.75; TE/TR = 77/4500 ms; in-plane resolution = 1.5 × 1.5 mm2; acquisition matrix size = 40 × 106; section thickness = 4 mm; section gap = 2 mm; total scan time = 5 minutes. In addition to DTI, the sagittal and axial T1-weighted and T2-weighted turbo spin-echo sequences were used for structural imaging. For each healthy subject, DTI, T1-weighted-, and T2-weighted-TSE images were acquired using the protocols identical to those of the patients. The reproducibility of DTI measurements was evaluated in our previous study,13 in which the percentage coefficients of variation were below 10% for all DTI metrics (Table 1 in the original article), suggesting a reliable intrascan reproducibility for them.
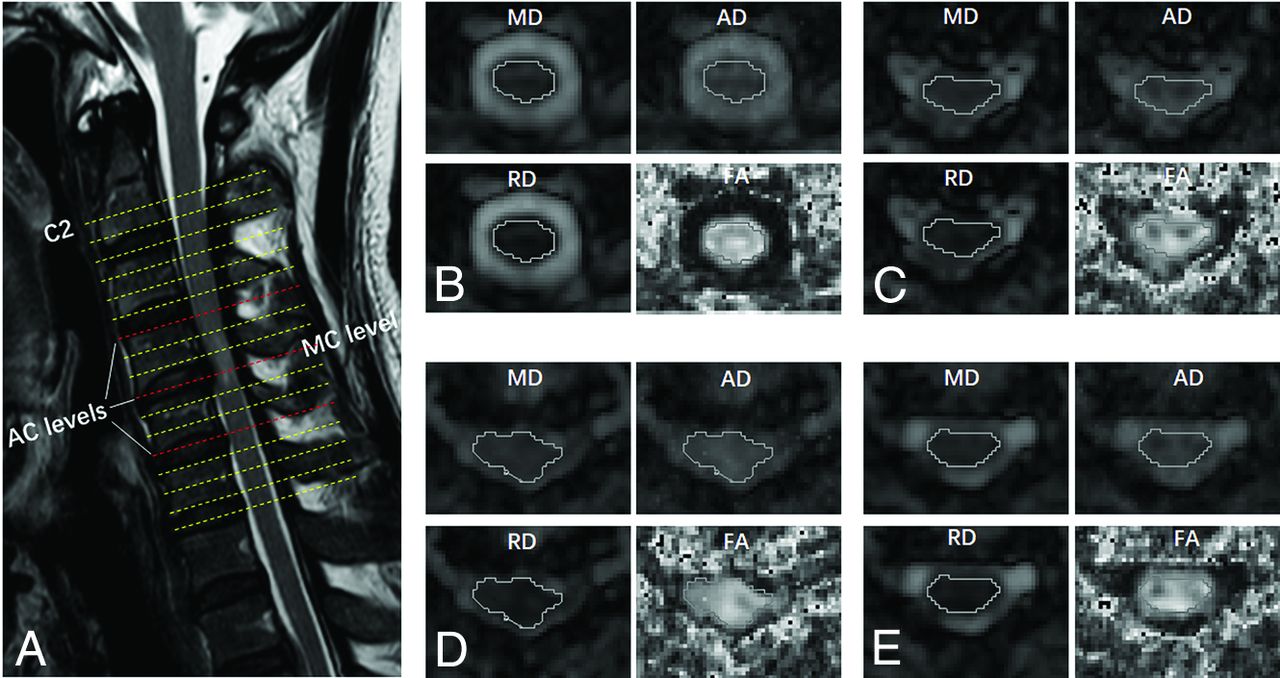
Example of DTI planes and ROI drawings from 1 patient. A, T2-weighted structural image with the locations of the C2 level and AC levels. B, ROI drawing at C2. C–E, ROI drawings at the AC levels. D, The MC level. Four DTI metrics were measured, including FA, AD, RD, and MD.
Image Processing
The diffusion-weighted images from the DTI data were preprocessed using the motion-correction function in the Spinal Cord Toolbox (https://sourceforge.net/projects/spinalcordtoolbox/)21 to register the images of different b-values and directions, which is a novel function that the Spinal Cord Toolbox offers with section-by-section translation estimation while ensuring regularization constraints along the section direction. Then, the DTI metrics FA, AD, RD, and MD were calculated from the registered images using the FMRIB Software Library (FSL; http://www.fmrib.ox.ac.uk/fsl).22 The processing steps using the Spinal Cord Toolbox and FSL were performed in Linux by batch processing without manual intervention. Afterward, the DTI metrics were loaded into DTIStudio (Johns Hopkins University)23 in Windows and measured with ROI analysis.
For each patient, ROIs were manually drawn along the contour of the whole spinal cord at all compressed levels as well as at the C2 level containing both the white and gray matter. An example of an ROI drawing is shown in Fig 1 Specifically, the ROIs were drawn on the MD map at first and then applied to all other metrics maps because the boundary between the spinal cord and CSF can be clearly identified on the MD map. Then, the average values of all voxels inside the ROI were recorded. Note that the edge of the spinal cord was excluded from the ROI to reduce the contamination of CSF. For healthy subjects, the DTI metrics at all vertebral levels from C2 to C7 were measured using the same ROI-analysis strategy.
Statistics
Statistical analysis was performed using SPSS Statistics, Version 20.0 (IBM).
The difference in DTI metrics between the patients before surgery and the healthy subjects (control group) was analyzed using an independent 2-sample t test (equal variance), t' test (unequal variance), or Mann-Whitney U test. If the means of the samples were normally distributed, a t test or t' test was used; otherwise, the Mann-Whitney U test was used. The MC level, the average of all compression (AC) levels, and the C2 level were analyzed independently. Specifically, for the MC level, the patients were first divided into 3 groups: the MC levels at C3–4; C4–5; and C5–6 or C6-7. Then DTI was compared between each patient group and the control group (Table 2). For the average of AC levels, DTI metrics for the patients were compared with the average of C3–4 to C5–6 levels for the healthy subjects.
Comparison of DTI metrics between patients before surgery and the control group for the MC level
The Spearman correlation was used to evaluate the relationship between mJOA and DTI at the same stage (before surgery and at 3- or 6-month follow-up stages) and to evaluate the relationship between the preoperative DTI and postoperative mJOA recovery rate.
We incorporated 3 T1-weighted and T2-weighted features into a linear regression model, including the axial spinal cord area, the spinal cord flattened rate (anterior-posterior diameter of the spinal cord divided by the transverse diameter of the spinal cord), and signal changes in the T1-weighted and T2-weighted images. When we considered the influence of multicollinearity in regression analysis, each DTI metric was incorporated into the regression model separately. In other words, for each analysis, 3 traditional MR imaging metrics and 1 DTI metric were incorporated into the regression model using a stepwise linear regression strategy. The correlation was examined between the incorporated metrics and the preoperative mJOA as well as the mJOA recovery rate. The MC, AC, and C2 levels were analyzed separately.
In addition, we divided patients into 3 subgroups based on the signal changes in the T1-weighted and T2-weighted images: patients with no signal changes (group 1), with signal changes in only T2-weighted images (group 2), and in both T1-weighted and T2-weighted images (group 3). The correlation between the DTI metrics and the preoperative mJOA or mJOA recovery rate was analyzed in each subgroup.
Receiver operating characteristic (ROC) analysis was used to evaluate the predictive capability of preoperative DTI metrics for the mJOA recovery rate. The patients were considered to have a positive recovery if the rate was >50% and to be negative otherwise. According to the positive or negative recovery, the state variables in ROC analysis were set to 1 or 0. After the ROC analysis, the cutoff value was determined to be the value with the maximum Youden index (sensitivity + specificity –1), and the sensitivity and specificity of different DTI metrics were computed on the basis of the cutoff values.
In all statistical approaches above, the DTI metrics for the MC level, the average of AC levels, and the C2 level were analyzed independently. Due to scanning errors, the C2 level was missing on the preoperative DTI for 3 patients, so the subject size of preoperative DTI metrics at the C2 level was 52. The threshold for significance was set to .05.
RESULTS
Comparison of DTI metrics between patients before surgery with the healthy subjects is shown in Tables 2⇓-4. For the MC level and average of AC levels, the patients had significantly lower FA and higher MD, AD, and RD than the healthy subjects, except AD at the MC level of group 1. At the C2 level, FA was significantly lower in the patients (P = .02), while MD, AD, or RD had no significant difference compared with the healthy subjects.
Comparison of DTI metrics between patients before surgery and the control group for the average of AC levels
Comparison of DTI metrics between the patients before surgery and the control group for the C2 level
Before surgery, Spearman correlations showed that mJOA had no significant correlation with the DTI metrics for the MC level or with those for the average of AC levels. For the C2 level, mJOA was correlated with AD (r = 0.36, P = .008), RD (r = –0.29, P = .04), and FA (r = 0.35, P = .01) (Table 5).
Spearman correlations between the DTI metrics at different levels and mJOA before surgery
At the 3-month follow-up, none of the DTI metrics for the MC level had significant correlations with mJOA. At 6-month follow-up, MD, RD, and FA for the MC level were correlated with mJOA. Specifically, MD and RD showed negative correlations (r = –0.31, P = .04 and r = –0.32, P = .03, respectively), and FA showed a positive correlation (r = 0.33, P = .03) (Table 6). For the C2 level, DTI metrics had significant correlations with mJOA at both 3- and 6-month follow-up, with the detailed values listed in Table 7.
Spearman correlations between the DTI metrics at the MC level and mJOA at 2 follow-up stages after surgery
Spearman correlations between the DTI metrics for C2 level and mJOA at 2 follow-up stages after surgery
The preoperative DTI metrics for MC or the average of AC levels had no correlations with the mJOA recovery rate, while at the C2 level, AD, RD, and FA had significant correlations with the mJOA recovery rate (Table 8). Notably, FA showed the strongest correlation among the 3 metrics, with r = 0.51 and P < .001.
Spearman correlations between the preoperative DTI metrics of different levels and the postoperative mJOA recovery rate at the final follow-up (1 year)
The results of linear regression analysis incorporating DTI, T1-weighted, and T2-weighted features are shown in Tables 9 and 10, where the features with significant results are listed. For the correlation with the preoperative mJOA (Table 9), only the axial spinal cord area showed significant correlation when the DTI metrics at the MC or AC levels were included, while all DTI metrics and the spinal cord flattened rate showed significant correlation when the DTI metrics at the C2 level were included. For the correlation with the mJOA recovery rate (Table 10), the DTI metrics and the spinal cord flattened rate showed significant correlation when every DTI metric at the C2 level or the FA at the AC levels was included, while only the axial spinal cord area showed significant correlation when the other DTI metrics (MD, AD, and RD at the AC levels and all DTI metrics at the MC level) were included.
Results of linear regression to examine the correlation between DTI, T1-weighted, and T2-weighted features and preoperative mJOA
Results of linear regression to examine the correlation between DTI, T1-weighted, and T2-weighted features and the mJOA recovery rate
For the correlation analysis in each subgroup, in group 1 with no signal changes, the AD value at the C2 level was correlated with the preoperative mJOA (r = 0.596, P = .041), and the FA value at the C2 level was correlated with the mJOA recovery rate (r = 0.634, P = .027). In group 2 with T2-weighted signal changes only, the FA value of the C2 level was correlated with the mJOA recovery rate (r = 0.484, P = .042). In group 3 with both T1-weighted and T2-weighted signal changes, the AD values of AC levels and the AD, FA, and RD values of the C2 level were correlated with the mJOA recovery rate (r = 0.462, 0.469, 0.457, and −0.446; P = .03, .028, .033, and .037, respectively).
The ROC analysis suggests that for the MC or average of AC levels, no DTI metrics were predictive of the mJOA recovery rate. For the C2 level, FA showed predictive capability with an area under the curve = 0.68, P = .04, sensitivity = 0.56, specificity = 0.81 (Fig 2 and Table 11).

ROC analysis of the predictive value of DTI metrics for the postoperative mJOA recovery rate. Results for the average of all AC levels, MC level, and the C2 level, respectively. The area under the curve values for different metrics are shown in Table 11.
Prediction capability of the preoperative DTI metrics at different levels for the postoperative mJOA recovery rate using ROC analysis
DISCUSSION
In this study, we investigated the evaluation and prediction capability of DTI for laminoplasty surgery outcome in patients with DCM. We found that DTI metrics were significantly different between patients before surgery and healthy subjects, findings consistent with those in previous studies.4,7,10,15 Before surgery, DTI metrics including AD, RD, and FA for the C2 level were significantly correlated with the preoperative mJOA, while DTI metrics for the MC or the average of AC levels were not. AD, RD, and FA for C2 before the operation were significantly correlated with the postoperative mJOA recovery rate. The results of regression analysis incorporating T1-weighted and T2-weighted features supported the correlation analysis results when using the DTI metrics alone, suggesting that the DTI metrics at the C2 level have the predictive value for surgery outcome. Particularly, DTI metrics were found to be correlated with the mJOA recovery rate for each subgroup of patients on the basis of T1-weighted and T2-weighted signal changes; this correlation indicates that it is possible to define a subgroup of patients that can only be categorized using DTI alone. In addition, ROC analysis demonstrated that FA for C2 was capable of predicting the mJOA recovery rate (P = .04).
We obtained DTI scans for the patients with DCM before surgery and at 3- and 6-month follow-up stages. To the best of our knowledge, this was the first time that DTI data were collected at 3 different stages in the same patients with DCM. The scans at different stages helped to reveal the relationships between DTI and mJOA in a long time range and to investigate the capability of DTI in evaluating and predicting surgery outcome.
We found that before surgery, the DTI metrics for the MC level were not significantly correlated with mJOA. This was surprising because most previous studies5,6,9,11,15,17,18 reported significant correlation. After surgery, the DTI metrics for the MC level and mJOA were significantly correlated at 6-month follow-up, but not at 3-month follow-up. One possible explanation is that the MC level was affected by severe image artifacts. Partial volume and motion effects could be aggravated by compression before surgery, and image distortion could be intensified by residual inflammation from surgery at 3-month follow-up, whereas at 6-month follow-up, the artifacts would be reduced so that the MC level was less affected. Other factors such as different statistical methods or patient inclusion criteria may also account for our inconsistency with previous studies.
For the C2 level, the DTI metrics were significantly correlated with the mJOA at different stages: before surgery and at 3- and 6-month follow-up. This is not surprising because it has been proved that compression might affect the distal spinal cord, even in the noncompressed regions,24⇓⇓⇓-28 which may represent Wallerian degeneration that has spread from a more caudal area of stenosis.29 Additionally, our results show that preoperative FA for the C2 level was correlated with the postoperative mJOA recovery rate. This correlation indicates that DTI has the potential to predict DCM surgery outcome. For the MC or the average of the AC levels, however, the DTI metrics were not capable of predicting the mJOA recovery rate on the basis of the data in this study. This feature may also be due to the increased artifact level caused by compression. Another possible reason is that the DTI metrics at the compression levels are affected not only by altering of the intra- and extracellular environments but also by the aligned-fiber effect. In other words, FA might be elevated to some extent if the fibers are aligned due to compression so that FA reduction resulting from spinal cord dysfunction will be compensated.14
Although most previous results reported that preoperative FA for the MC level was significantly correlated with both the preoperative and postoperative mJOA, there were several studies that reported nonsignificant correlations. Jones et al9 found that the preoperative FA for the MC and C2–C3 levels was correlated with the preoperative mJOA but was not correlated with the postoperative mJOA. They observed that FA at C2–C3 was more strongly correlated than at the MC level and speculated that it is due to the imaging artifacts (eg, EPI distortion) at the stenotic region, providing inconsistent DTI parameters. Wen et al15 claimed that the mean FA of C3–C7, instead of the MC level or the C2 level alone, was able to predict the postoperative mJOA. While this finding is not fully consistent with the results in this study, it provides evidence that the spinal cord function is also associated with the DTI measurements at sites distant from the MC level. Iwasaki et al14 also presented a nonsignificant correlation between the preoperative FA for the MC level and the postoperative mJOA. These studies (including the present study) have some differences in the methods, such as surgery strategy, statistics, prediction indexes, and so forth (Table 1).
To lower the image distortion, we used a reduced FOV technique, outer volume suppression, in the DTI data acquisition by applying saturation bands to suppress the signal outside the FOV along the phase-encoding direction. As shown in a previous study,30 another reduced FOV technique, 2D radiofrequency excitation, is more effective in signal suppression, though it can lead to a smaller signal strength inside the FOV than outer volume suppression. Inner volume imaging–based reduced FOV has also been applied to DTI for patients with DCM,31⇓⇓-34 which can achieve a shorter radiofrequency pulse duration compared with 2D radiofrequency excitation. However, the DTI sequence with 2D radiofrequency excitation or inner volume imaging–based reduced FOV was not available on the MR imaging system used in this study. Thus, we tried our best to optimize the outer volume suppression–based DTI on our system (3T Ingenia), including using B1 shimming, subject-specific volume B0 shimming, and the maximal gradient strength used for saturation. On the basis of our inspection, no obvious foldover artifacts were present on the diffusion-weighted images and calculated DTI metrics for all healthy volunteers and patients in this study. In the future, we will compare the performance difference in quantifying the spinal cord DTI metrics between outer volume suppression and 2D radiofrequency excitation when the latter is available.
As mentioned in the Materials and Methods section, the imaging plane of DTI was parallel to the intervertebral disk at the maximal compression level, which is a prescription commonly used in the previous studies. Due to the natural bending of the spinal cord, it is difficult to apply orthogonality to the nerve fibers along all cervical levels (eg, C2–C7), and the angles between the imaging plane and fiber directions may introduce bias for measuring DTI metrics. An ideal way to tackle this issue is to align the image plane of each section with the corresponding disk level through modifying the DTI pulse sequence. The viability for this modification requires investigation.
The methodology of this study had 2 major limitations. First, the diagnosis of patients included in the study was not uniform, eg, the surgical outcomes could be different between patients with ossification of the posterior longitudinal ligament and other patients with DCM, because usually the spinal cord of patients with ossification of the posterior longitudinal ligament has already been compressed for a long time; thus, their surgical outcome is relatively worse. Second, the DTI metrics of the white matter and gray matter were not analyzed separately. In this study, it is difficult to distinguish the WM and GM at the compressed levels, especially for the preoperative patients in whom the compressed spinal cord may present as only a few pixels. Even at noncompressed levels, measuring the GM and WM separately is not easy because of the limited resolution of DTI.
While we could not distinguish the WM and GM at the MC level for patients with severe compression, we were able to draw ROIs within the WM at the C2 level. For example, we drew an ROI on the dorsal column at the C2 level for all patients before surgery. The results shown in On-line Table 2 suggest that the AD of the dorsal column at the C2 level is significantly correlated with the mJOA recovery rate (r = 0.341, P = .018) and has a tendency to be correlated with the mJOA before surgery (r = 0.264, P = .07). When we used ROIs containing the whole spinal cord at the C2 level, as shown in the Results section, FA, AD, and RD were all correlated with the mJOA recovery rate. Although in theory, the spinal cord function is mainly related to WM, the ROI drawn in the dorsal column can also be contaminated by GM due to low image resolution. Additionally, the dorsal column is a proprioceptive sensibility pathway in charge of proprioception/vibratory sense and discriminative touch, while the mJOA represents the overall sensation and motion function of the spinal cord. Furthermore, it is impractical to define the ROI of the entire WM freehand. One potential solution is to register diffusion-weighted images to the high-spatial-resolution structural images from which the GM and WM are better distinguished. We have tried to use the registration function provided by the Spinal Cord Toolbox, and it worked well for healthy subjects but failed for the preoperative patients; this outcome could be due to the influence of compression levels. Thus, a better registration algorithm is desirable for such special cases.
Overall, this study found that DTI showed the potential for predicting the mJOA recovery rate, which supports the conclusions in most previous studies. Both the Spearman correlation and ROC analysis yielded positive results for predicting the mJOA recovery rate after 1-year follow-up using the DTI metrics at the C2 level. In practice, DTI in the spinal cord inevitably faces technical limitations of spatial resolution, signal-to-noise ratio, and motion artifacts. Emerging advanced acquisition equipment such as ultra-high-field MR imaging systems35 may alleviate these issues.
CONCLUSIONS
We provide a comprehensive analysis of the evaluation and prediction capability of DTI for laminoplasty surgery outcomes. Results showed that the DTI metrics at the C2 level before surgery have the potential for predicting the postoperative mJOA recovery rate.
Footnotes
Xiao Han and Xiaodong Ma are co-first authors.
This work was supported by Capital's Funds for Health Improvement and Research (code CFH2020-2-1121), Beijing JST Research Funding (code ZR-201912), National Natural Science Foundation of China (code 11871459), and Beijing Jishuitan Hospital “Nova Program” (code xkxx201614).
Indicates open access to non-subscribers at www.ajnr.org
References
- Received February 2, 2020.
- Accepted after revision June 9, 2020.
- © 2020 by American Journal of Neuroradiology


Jump to section
Related Articles
Cited By...
- No citing articles found.