Abstract
BACKGROUND AND PURPOSE: Diagnostic-quality amyloid PET images can be created with deep learning using actual ultra-low-dose PET images and simultaneous structural MR imaging. Here, we investigated whether simultaneity is required; if not, MR imaging–assisted ultra-low-dose PET imaging could be performed with separate PET/CT and MR imaging acquisitions.
MATERIALS AND METHODS: We recruited 48 participants: Thirty-two (20 women; mean, 67.7 [SD, 7.9] years) were used for pretraining; 328 (SD, 32) MBq of [18F] florbetaben was injected. Sixteen participants (6 women; mean, 71.4 [SD. 8.7] years of age) were scanned in 2 sessions, with 6.5 (SD, 3.8) and 300 (SD, 14) MBq of [18F] florbetaben injected, respectively. Structural MR imaging was acquired simultaneously with PET (90–110 minutes postinjection) on integrated PET/MR imaging in 2 sessions. Multiple U-Net–based deep networks were trained to create diagnostic PET images. For each method, training was done with the ultra-low-dose PET as input combined with MR imaging from either the ultra-low-dose session (simultaneous) or from the standard-dose PET session (nonsimultaneous). Image quality of the enhanced and ultra-low-dose PET images was evaluated using quantitative signal-processing methods, standardized uptake value ratio correlation, and clinical reads.
RESULTS: Qualitatively, the enhanced images resembled the standard-dose image for both simultaneous and nonsimultaneous conditions. Three quantitative metrics showed significant improvement for all networks and no differences due to simultaneity. Standardized uptake value ratio correlation was high across different image types and network training methods, and 31/32 enhanced image pairs were read similarly.
CONCLUSIONS: This work suggests that accurate amyloid PET images can be generated using enhanced ultra-low-dose PET and either nonsimultaneous or simultaneous MR imaging, broadening the utility of ultra-low-dose amyloid PET imaging.
ABBREVIATIONS:
- CNN
- convolutional neural network
- NS
- nonsimultaneous
- S
- simultaneous
- SUVR
- standard uptake value ratio
PET allows the interrogation of amyloid deposition in the brain, a hallmark of Alzheimer disease neuropathology,1⇓-3 while MR imaging with its exquisite soft-tissue contrast allows imaging morphology–based features such as cortical atrophy, representative of neurodegeneration.4 These complementary strengths allow MR imaging to assist in PET image-processing and enhancement.5,6
While the absolute quantification of radiotracer concentrations is a strength in PET, radioactivity associated with the radiotracers will also present a risk to participants, especially in vulnerable populations. This will affect the scalability of large-scale clinical longitudinal PET studies.
With the advent of deep learning–based machine learning methods such as convolutional neural networks (CNNs), it is possible to generate diagnostic-quality amyloid PET images using an actual ultra-low injected radiotracer dose and simultaneously acquired MR imaging inputs.7
Because most patients with dementia undergo MR imaging routinely as part of their work-up to exclude a focal cause, a single PET/MR imaging examination provides a “one-stop shop” for functional and structural information.8 In terms of logistics, a single scan also provides convenience and cost-effectiveness for both the imager and the imaged. However, there are still limitations to its widespread use because simultaneous PET/MR imaging scanners remain relatively uncommon, and multicenter imaging studies such as the Alzheimer’s Disease Neuroimaging Initiative collect data on stand-alone PET/CT and MR imaging scanners.9 Therefore, any multimodal deep learning–based solution that will attain widespread use must be compatible with the more common practice of acquiring PET and MR imaging images separately. On the other hand, changes in the spatial distribution of amyloid are expected to be minimal within a short time interval (eg, 1 month).10 Thus, we have begun investigating whether similar results can be obtained when MR imaging is performed separately from PET, testing the hypothesis that the multimodal images collected within this short time interval will still be representative of the condition of the imaged participant. A secondary objective of this work was to investigate the effect of different deep learning training methods in relation to these inputs.
MATERIALS AND METHODS
Patient Characteristics
Forty-eight participants (32 for the pretrained network presented in Chen et al11 and 16 scanned with the true ultra-low-dose protocol presented in Chen et al;7 diagnoses can be found in Table 1) were recruited for this study. The study was approved by the Stanford University institutional review board, and written informed consent for imaging was obtained from all participants or an authorized surrogate decision-maker.
Participants recruited in this study and their clinical diagnoses
Data from 32 (20 women; mean, 67.7 [SD, 7.9] years of age) participants were used for pretraining the network. They received 334 (SD, 30) MBq of the amyloid radiotracer [18F] florbetaben (Life Molecular Imaging) with the PET acquisition between 90 and 110 minutes after injection. Sixteen (6 women; mean, 71.4 [SD, 8.7] years of age) different participants were scanned with the ultra-low-dose protocol. These participants were scanned in 2 PET/MR imaging sessions, with 6.5 [SD, 3.8] and 300 [SD, 14] MBq injections of [18F] florbetaben, respectively (2.2% [SD, 1.3%] dose compared with the corresponding standard-dose sessions), representing an approximately 50-fold reduction in radiation dose.
Imaging Acquisition
In all participants, the T1, T2, and T2 FLAIR-weighted MR images (acquisition details in Chen et al11) were acquired simultaneously with PET (90–110 minutes after injection) on an integrated PET/MR imaging scanner (Signa PET/MR; GE Healthcare) with TOF capabilities (Fig 1). For the 16 participants scanned with the true ultra-low-dose protocol, 7 were scanned on the same day (ultra-low-dose protocol followed by the standard-dose protocol), while the 9 others were scanned on separate days (1- to 42-day interval; mean, 19.6 days). Identical MR imaging acquisitions were performed across the 2 scanning sessions for all except 4 T2-weighted sequences (4/96 planned acquisitions) for which the same image from the other scan would be used as a substitute. For PET, TOF ordered subsets expectation maximization with 2 iterations and 28 subsets and accounting for randoms, scatter, dead time, and attenuation (vendor’s atlas-based method relying on 2-point Dixon imaging12 for the 32 data sets used for network pretraining and the zero-TE-based method for the remaining 16 data sets) was used for all PET image reconstructions.

Example of the ultra-low-dose protocol. The participants were scanned in 2 sessions (could be scanned on separate days or back-to-back on the same day) and the 2 sets of MR images obtained from the sessions were used in separate neural network training to test the effect of S versus NS input.
The standard-dose PET images (yellow-bordered images in Fig 1) in their native space were used as a reference to which all other images were coregistered. The MR images acquired during the standard-dose session were coregistered (to account for residual motion) to the PET images using the software FSL (http://www.fmrib.ox.ac.uk/fsl)13 with 6 df and correlation ratio (cost function). All images were resliced to the PET dimensions: 89 slices (2.78 -mm section thickness) with 256 × 256 (1.17 × 1.17 mm2) voxels. Similarly, for the data set with the true ultra-low-dose protocol, the MR imaging and PET images were also separately coregistered to their corresponding standard-dose PET images to account for differences among scans. The voxel intensities of the PET and MR images were normalized by their Frobenius norm, and a head mask, derived from the T1-weighted image through intensity-thresholding and hole-filling, was applied to the volumes, which were used as input to the CNN.
CNN Implementation
The CNN structure proposed in Chen et al (Fig 2)11 was used. Briefly, the structure is based on the popular U-Net,14 in which the encoder portion is composed of layers that perform 2D convolutions (using 3 × 3 filters), batch normalization, and rectified linear unit activation operations. We used 2 × 2 max pooling to reduce the dimensionality of the data. A residual connection was used in the central layers to connect its input and output. In the decoder portion, the data in the encoder layers were concatenated with those in the decoder layers. Linear interpolation was performed to restore the data to its original dimensions. We used 1 × 1 convolutions and hyperbolic tangent activation in the final layer to obtain the output, which was then added with the input low-dose image to obtain the enhanced PET image. The network was trained with an initial learning rate of 0.0002 and a batch size of 4 over 100 epochs. The L1-norm was selected as the loss function, and adaptive moment estimation as the optimization method.15

Ultra-low-dose CNN structure. The arrows denote computational operations, and the tensors are denoted by rectangles with the number of channels indicated above each rectangle. Input, output, and the ground truth of the network are also indicated. The network was trained either from scratch (method 1), from a pretrained network using the same structure with all layers trainable (method 2), or with just the last layer (red box) trainable (method 3). BN indicates batch normalization; Conv, convolution; Max, maximum; ReLU, rectified linear unit; tanh, hyperbolic tangent.
In this work, the inputs to the network are the multicontrast MR images (T1, T2, and T2 FLAIR-weighted) and the true ultra-low-dose PET image, with the standard-dose PET image used as the ground truth. Three approaches were taken with network training: In the first, training was from scratch on the 16 cases in the actual ultra-low-dose study (method 1), while the other approaches were fine-tuned on the basis of the pretrained network presented in an earlier work, in which case for the ultra-low-dose PET channel, a sampled 1%-dose PET image (used to simulate ultra-low-dose acquisitions) was used. During tuning, either all layers (method 2) of the U-Net were fine-tuned using the true ultra-low-dose data sets or just the last layer (method 3). Eight-fold cross-validation was used to efficiently use all data sets (14 for training, 2 for testing per fold). For all methods, the training was performed twice: once using PET/MR imaging input from the same scanning session (simultaneous [S]) and once using PET and MR imaging from different sessions (nonsimultaneous [NS]) (Fig 1).
Data Analysis
By means of the software FreeSurfer (http://surfer.nmr.mgh.harvard.edu),16,17 a brain mask derived from the T1 images was used for voxel-based analyses. For each axial section, the image quality of the enhanced and low-dose PET images within the brain was compared with the standard-dose image using peak SNR, structural similarity,18 and root-mean-square error. Absolute relative change values within the brain were also calculated for the enhanced and low-dose images with the equation 100 × | PETi – PETFD |/PETFD, with PETFD denoting the full-dose images and PETi denoting the other images. Paired t tests were performed at the P = .05 level to test for the significance of the metrics derived from NS versus S input, with Bonferroni corrections for multiple comparisons. FreeSurfer-derived cortical parcellations and cerebral segmentations based on the Desikan-Killiany Atlas19 were used to form 4 larger ROIs (Online Supplemental Data). The whole cerebellum was used as a reference region for calculating the standard uptake value ratio (SUVR). To assess tracer uptake agreement between images derived from NS versus S input, we took the average of the 4 larger regional (frontal, lateral temporal, parietal, cingulate) SUVR values to obtain a composite “global” SUVR value of the association cortex correlated across participants. The 2 types of enhanced (using method 3) PET images from each participant were also anonymized and presented in random order to 2 clinicians (G.Z., M.Z.) who had been certified to read amyloid PET imaging to further confirm our results. The amyloid uptake status (positive, negative) of each image (16 participants, 2 image types) was determined, and the agreement of the readings between image types was assessed.
RESULTS
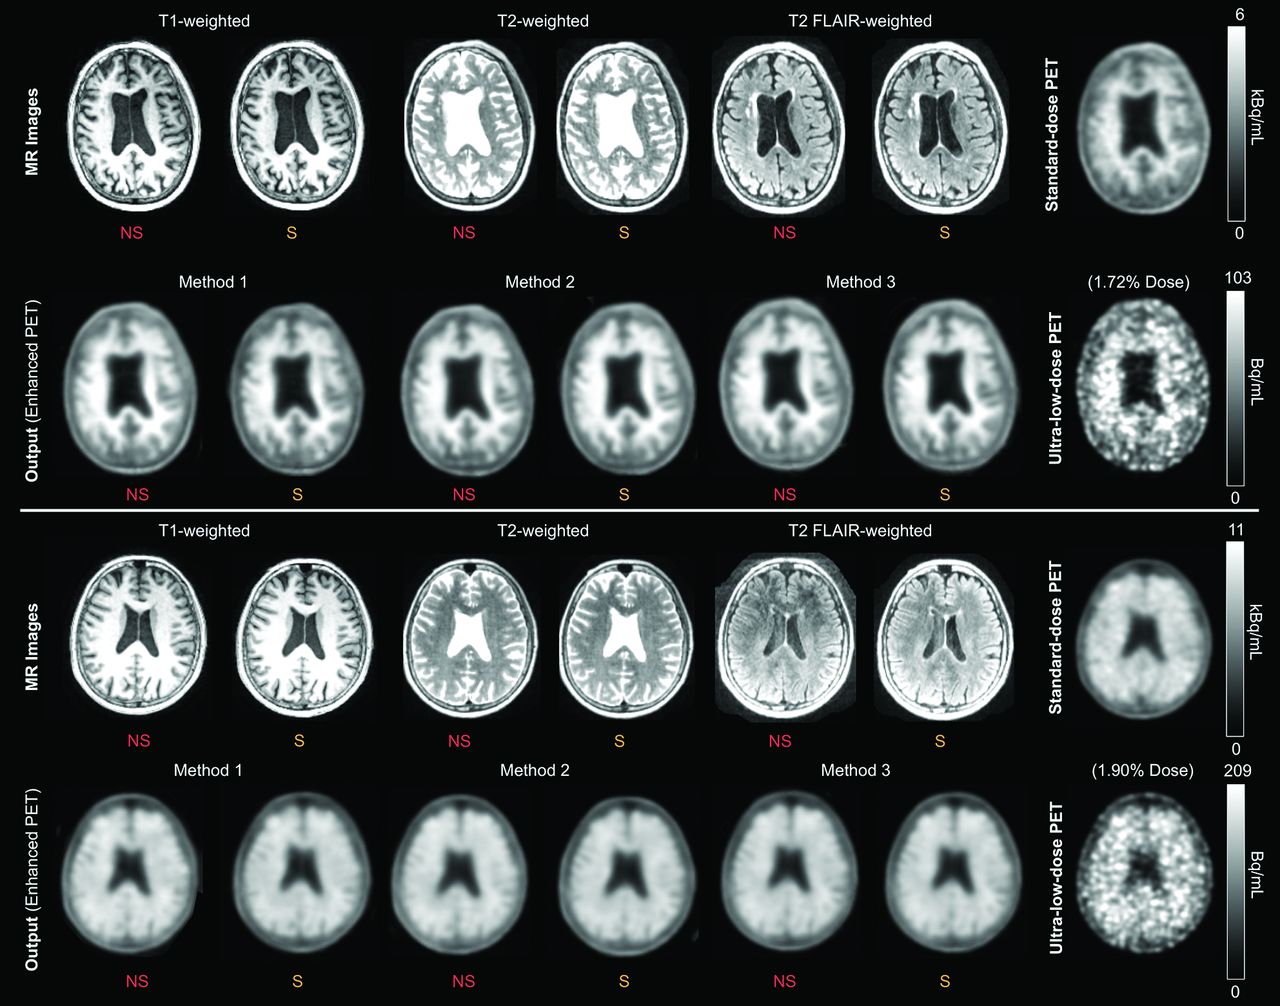
Qualitatively, all enhanced images showed marked improvement in noise reduction compared with the ultra-low-dose image (Fig 3). The uptake patterns of the enhanced images resembled the ground truth and followed the morphology shown by the MR images, a result in accordance with the previous work.11 The 3 metrics, peak SNR, structural similarity, and root-mean-square error, showed significant image-quality improvement (Fig 4) from the ultra-low-dose images compared with the enhanced images (P < .001), and the metrics between the images enhanced from the S versus NS input were not statistically significant using paired t tests (Table 2); when we subdivided the data according to diagnosis (8 controls versus 8 with mild cognitive impairment or Alzheimer disease) or by time between scanning sessions (0/1 days versus 8+ days), the difference in the metrics was not statistically significant. The absolute relative changes also showed great improvement after enhancement (Table 3 and Online Supplemental Data).

Representative amyloid PET images (upper section: negative for amyloid; lower section: positive for amyloid) with the corresponding MR images. All sets of CNN-enhanced ultra-low-dose PET images show greatly reduced noise compared with the ultra-low-dose PET image and resemble the standard-dose PET image.

Image quality metrics comparing the ultra-low-dose (LD) PET and the CNN-enhanced images with the corresponding ground truth standard-dose PET images. PSNR indicates peak SNR; RMSE, root-mean-square error; SSIM, structural similarity.
P values for image-quality metric comparisons between images enhanced with S and NS inputa
Means of absolute relative change (%) within the brain
The SUVRs in the global region ranged between 0.9 and 2.3 for all participants and image types, indicating the presence of participants positive and negative for amyloid in our data set (cutoff value used at our institution = 1.19). The correlation of SUVRs between different image types was high (Fig 5 and Table 4), showing the quantitative accuracy of the CNN-enhanced images for both enhanced image types compared with the standard-dose ground truth.

Correlation of SUVRs in the composite global regions of images enhanced using NS versus S data. The dashed red line denotes the line of identity.
Correlation coefficient of SUVR within the composite global region across image types
The clinical reads from the 2 readers showed high agreement among the image types; only 1 pair of images of 64 total reads was interpreted differently.
DISCUSSION
In this study, we aimed to show that S and NS MR imaging yields similar performance in providing morphologic information for enhancing ultra-low-dose amyloid PET images. With the development of ultra-low-dose PET scanning, this technique provides the opportunity for more efficient workflow (potentially splitting doses among patients and subjects to be scanned) and providing the opportunity for more frequent follow-up under current radiation safety thresholds. However, because morphologic information is advantageous for the accuracy of the image enhancement11 and PET/MR imaging scanners are relatively uncommon for widespread use of this technology, it must be possible to use data acquired nonsimultaneously (such as that obtained with PET/CT and coregistered with MR imaging close to the time of the PET scan).
We also aimed to assess whether the pretrained network affects the need for simultaneity. Because the pretrained network was trained with simultaneous acquisitions, the inherent bias might possibly affect the training results using the new data set. Therefore, we tried 3 different network training methods and analyzed their results. The 3 methods represent different levels of constraint imposed on the network: For method 1, in which the networks were trained from scratch, no effect of the pretrained network was found. For method 2, while the network was pretrained, the weights of the network only served as a starting point for further training because all layers were trainable. Method 3, with the use of the pretrained network and with only the final layer of the network trainable, represented the most constraint imposed on network training.
From the statistical analysis of the image metrics, no significant differences were found between the images enhanced with NS or S input. The absolute relative change of the uptake within the brain shown in both types of enhanced images was also closer to the full-dose images. SUVR values were also shown to correlate very well between image types. All 3 network training methods also yielded similar results. Clinical reads also showed that the 2 types of enhanced images were interpreted similarly. This shows that for this population, our interval between scanning sessions, and the morphologic MR images used as input to the network, simultaneity is not a strict requirement for MR imaging–assisted ultra-low-dose PET enhancement. However, we have also observed that higher P values were obtained when using the pretrained network to initialize training. This observation implies that the network, pretrained with simultaneous PET/MR imaging data, further constrains the training process to yield more similar results than when the network is trained from scratch.
While we found no significant performance differences using either the NS or S data as input and achieved encouraging quantitative results, there are several limitations to this study. First, due to the slowdowns in research scans associated with the coronavirus disease 2019 (COVID-19) pandemic, we have only acquired 16 amyloid data sets. Although data augmentation and the use of a 2D network mitigate the shortcomings of having a low number of participants, in the future our goal is to acquire a larger, representative sample size using a variety of different PET radiotracers, to test our hypothesis and to gather more cases for network training. Second, in this study, we have assessed the results only through the use of quantitative metrics. We aim to perform reader studies to evaluate the diagnostic value of the CNN-enhanced images. Third, in terms of acquisition, because all data sets were collected on the PET/MR imaging, MR imaging–based attenuation correction was used during reconstruction. Given the similarities in PET uptake between images reconstructed with CT attenuation correction and MR imaging attenuation correction,20,21 we do not anticipate this to be a major issue. However, confirmation with separate ultra-low-dose and standard PET/CT and separate coregistered MR imaging would be valuable.
On the MR imaging side, investigating the effects of how sequences acquired using different protocols or scanners would affect network performance is also worthy of further investigation and could lead to not just increased generalizability of our results but also the ability to pool MR images across scanners or protocols. Finally, the question of the length of time between the 2 studies that would invalidate these conclusions was not explored because the time interval between the 2 studies in our cases ranged only up to 42 days and was limited to patients with cognitive issues. Simultaneous PET/MR imaging is likely still preferable for disease entities in which changes would be expected to occur more quickly.
CONCLUSIONS
This work has shown that accurate amyloid PET images in patients with cognitive decline can be generated using trained U-Nets with both S and NS multimodal ultra-low-dose PET/MR images, and the training can be done either from scratch or from a pretrained network. The ability to use NS PET and MR images for ultra-low-dose imaging would broaden the utility of this deep learning technique to data acquired from stand-alone PET/CT and MR imaging machines.
Footnotes
This work was supported by the Foundation of the American Society of Neuroradiology; Life Molecular Imaging; GE Healthcare; the Michael J. Fox Foundation for Parkinson’s Research; National Taiwan University, 111L7415 National Institutes of Health, K99-AG068310-01A1, P41-EB015891, P50-AG047366; and Ministry of Science and Technology (Taiwan), 110-2222-E-002-015-MY3.
Disclosures: Kevin T. Chen—RELATED: Grant: National Institutes of Health, Foundation of the American Society of Neuroradiology, Ministry of Science and Technology (Taiwan), Michael J. Fox Foundation for Parkinson’s Research; Life Molecular Imaging; GE Healthcare*; Support for Travel to Meetings for the Study or Other Purposes: National Institutes of Health, Foundation of the American Society of Neuroradiology*; UNRELATED: Payment for Lectures Including Service on Speakers Bureaus: Taiwan Oncology Society; Travel/Accommodations/Meeting Expenses Unrelated to Activities Listed: Institute of Electrical and Electronics Engineers; International Symposium on Cerebral Blood Flow, Metabolism and Function. Mohammad Mehdi Khalighi—UNRELATED: Other: GE Healthcare, Comments: Co-Principal Investigator on a study funded by GE Healthcare. Elizabeth Mormino—RELATED: Grant: National Institutes of Health*; UNRELATED: Consultancy: Eli Lilly, Roche, Genentech, Neurotrack; Grants/Grants Pending: National Institutes of Health, Alzheimer’s Association.* Greg Zaharchuk—UNRELATED: Board Membership: Subtle Medical; Grants/Grants Pending: various National Institutes of Health projects, GE Healthcare*; Payment for Lectures Including Service on Speakers Bureaus: Biogen; Patents (Planned, Pending Or Issued): assorted patents on deep learning; Royalties: Cambridge University Press; Stock/Stock Options: Equity, Subtle Medical, Inc. *Money paid to the institution.
Indicates open access to non-subscribers at www.ajnr.org
References
- 1.
- 2.
- 3.
- 4.
- 5.
- 6.
- 7.
- 8.
- 9.
- 10.
- 11.
- 12.
- 13.
- 14.
- 15.
- 16.
- 17.
- 18.
- 19.
- 20.
- 21.
- Received April 16, 2021.
- Accepted after revision November 15, 2021.
- © 2022 by American Journal of Neuroradiology