
Abstract
BACKGROUND AND PURPOSE: Interpretation of fMRI depends on accurate functional-to-structural alignment. This study explores registration methods used by FDA-approved software for clinical fMRI and aims to answer the following question: What is the degree of misalignment when registration is not performed, and how well do current registration methods perform?
MATERIALS AND METHODS: This retrospective study of presurgical fMRI for brain tumors compares nonregistered images and 5 registration cost functions: Hellinger, mutual information, normalized mutual information, correlation ratio, and local Pearson correlation. To adjudicate the accuracy of coregistration, we edge-enhanced echo-planar maps and rated them for alignment with structural anatomy. Lesion-to-activation distances were measured to evaluate the effects of different cost functions.
RESULTS: Transformation parameters were congruent among Hellinger, mutual information, normalized mutual information, and the correlation ratio but divergent from the local Pearson correlation. Edge-enhanced images validated the local Pearson correlation as the most accurate. Hellinger worsened misalignment in 59% of cases, primarily exaggerating the inferior translation; no cases were worsened by the local Pearson correlation. Three hundred twenty lesion-to-activation distances from 25 patients were analyzed among nonregistered images, Hellinger, and the local Pearson correlation. ANOVA analysis revealed significant differences in the coronal (P < .001) and sagittal (P = .04) planes. If registration is not performed, 8% of cases may have a >3-mm discrepancy and up to a 5.6-mm lesion-to-activation distance difference. If a poor registration method is used, 23% of cases may have a >3-mm discrepancy and up to a 6.9-mm difference.
CONCLUSIONS: The local Pearson correlation is a special-purpose cost function specifically designed for T2*–T1 coregistration and should be more widely incorporated into software tools as a better method for coregistration in clinical fMRI.
ABBREVIATIONS:
- AFNI
- Analysis of Functional Neuro Images
- CR
- correlation ratio
- HEL
- Hellinger
- LAD
- lesion-to-activation distance
- LPC
- local Pearson correlation
- MI
- mutual information
- NMI
- normalized mutual information
- NR
- nonregistered
Interpretation of fMRI depends on accurate functional-to-structural alignment. However, accurate placement of the activation area on the anatomic underlay is fraught with challenges. The images to be superimposed are acquired sequentially, not simultaneously, and patients are not always cooperative in holding still across the entire examination. Registration is then required to account for patient movement by placing the images back into the same reference space. Additionally, the image sequences are multimodal in that the anatomic data are T1-weighted gradient-echo, whereas the functional data are T2*-weighted echo-planar. The latter also has intrinsic geometric distortion with signal drop-out and is typically acquired at a lower resolution (Fig 1, upper row). Functional-to-structural misalignment may be subtle and not easily recognized (Fig 1, lower row). When functional-to-structural misalignment occurs, error is introduced when interpreting the functional significance of apparent gyral activation and when judging lesion-to-activation distances (LADs), which can impact surgical risk assessment.

Sample patient with a right temporal lobe tumor. The upper row illustrates the challenge in functional-to-anatomic multimodal alignment between T2* EPI (A) and T1-weighted MPRAGE images (B). Note the inherently poor resolution of EPI. These images also show signal drop-out from susceptibility artifacts near the sinuses and craniotomy (asterisks). The lower row highlights the great difficulty in judging accurate alignment simply by visual inspection. The fusion image of the average EPI mask over the MPRAGE image (C) shows signal drop-out at the skull base (asterisks), which can potentially confound registration algorithms. The fusion image of edge-enhanced EPI (D) delineates structural boundaries in EPI data and reveals slight misalignment (arrows) due to patient motion between MPRAGE and EPI, primarily in the inferior-superior direction along with some rotation.
This coregistration between functional and structural images is an important postprocessing step that can affect the final interpretation, yet it is our observation that the registration step is not well-understood, even by most neuroradiologists experienced with functional imaging and vendor application specialists. Most publications only briefly remark that “images were coregistered” with no further elaboration. It seems to us that most fMRI users just assume that the coregistration step should work as intended without understanding what is actually happening. In our experience with presurgical fMRI studies, coregistration often seemed to underperform expectations; furthermore, there seemed to be too much variability in fMRI activation localization using different registration methods.
It is important to contextualize the aims of this study. While there is an inexhaustible number of possible ways to perform coregistration, our project has a distinct focus on the current state of clinical use. Thus, we are primarily interested in the performance of the coregistration step in FDA-approved commercial software. The cost functions evaluated in this study emerge from a survey of the current state of the industry.
A variety of research (Analysis of Functional Neuro Images [AFNI; http://afni.nimh.nih.gov/afni]; FSL [http://www.fmrib.ox.ac.uk/fsl]; statistical parametric mapping [SPM; http://www.fil.ion.ucl.ac.uk/spm/software/spm12]) and FDA-approved commercial (Prism Clinical Imaging, https://www.prismclinical.com/pages-output/prism-process/; NordicNeuroLab, http://www.nordicneurolab.com/; Invivo, http://www.invivocorp.com/; Brainlab, https://www.brainlab.com/; Siemens, https://usa.healthcare.siemens.com/magnetic-resonance-imaging/options-and-upgrades/clinical-applications/syngo-mr-neuro-fmri; GE Healthcare, https://www.gehealthcare.com/products/advanced-visualization/all-applications/brainwave) platforms are available for fMRI postprocessing. The following brief survey of the major commercial software packages illustrates the variety of approaches taken by the vendors. NordicNeuroLab, Invivo, Brainlab, Siemens, and GE Healthcare have a default workflow that automatically applies coregistration, and most also provide the option of manual nudging with 6 df. In these cases, only 1 cost function is available, it is chosen by the vendor, the choice is usually not obviously disclosed, it cannot be changed by the user, and it is applied universally to all modalities to be registered. Brainlab1 and GE Healthcare use mutual information. Invivo and Siemens use normalized mutual information. NordicNeuroLab uses a variant of mutual information that uses adaptive sampling with an octree partition.2 The workflow of Prism is more elaborate in several ways. It uses AFNI as its engine. It does not automatically coregister, though there is the option to activate formal coregistration, during which one may select the cost function from a list of choices, including Hellinger (default selection), local Pearson correlation, mutual information, normalized mutual information, correlation ratio, and least squares. A second cost function (mutual information by default) runs in the background and warns the user about a discrepancy between the results of the primary and secondary cost functions. The primary and secondary metrics selected can be different for each pair of images to be registered. Last, manual nudging is allowed with 3 df for translation. (Compiled by personal e-mail communication with Chad Neller and Jim Reuss from Prism, Cathy Elsinger from NordicNeuroLab, Erik Peterson from Invivo, John Murray from BrainLab, David Carpenter from Siemens, and Olaf Roeder from GE. 12/12/2016–11/6/2017.)
This survey serves to illustrate the variability among vendors and that in most cases, the vendors make the decision for you. The presumption that the vendor has chosen the best registration algorithm may not necessarily be correct. There is always a need for more validation studies, and vendors are responsive to quality-improvement initiatives in partnership with physicians.
The most important work to date comparing cost functions against one another is by Cox et al3 and Saad et al,4 who introduced the local Pearson correlation (LPC) cost function specifically designed for T2*–T1 coregistration. They demonstrated that LPC outperforms mutual information, correlation ratio, and Hellinger across AFNI, FSL, and SPM platforms. Nevertheless, this survey of commercial vendors reveals that only Prism makes LPC available, though not even by default.
The present study explores the performance of registration methods used by FDA-approved software for clinical fMRI and aims to answer the following question: What is the degree of misalignment when registration is not performed, and how well do current registration methods perform?
Materials and Methods
Patient Selection
This is a retrospective evaluation of presurgical fMRI studies of consecutive patients scanned between April 2016 and March 2017. Inclusion criteria were fMRI studies with at least 1 motor or language task, the presence of brain tumor for the purpose of LAD measurement, and an activation area within 40 mm of the tumor margin. Studies were excluded if performed for indications other than tumor, if deemed clinically nondiagnostic due to gross patient motion or noncompliance with the task, or if no activation area was present within 40 mm of the tumor margin.
Scanning Technique
Images were acquired on a 3T Tim Trio scanner (Siemens, Erlangen, Germany). A 32-channel head coil was used. A sagittal 3D T1-weighted MPRAGE sequence was acquired with the following parameters: 1 × 1 × 1 mm isotropic resolution, TR = 1690 ms, TI = 1100 ms, TE = 2.56 ms, flip angle = 12°, FOV = 256 × 224 mm, matrix = 256 × 224, one hundred seventy-six partitions. Axial blood oxygen level–dependent fMRI was acquired by using T2* echo-planar imaging with the following parameters: 3.5 × 3.5 × 3.5 mm isotropic resolution, no interslice gap, TR = 2100 ms, TE = 27 ms, flip angle = 77°, FOV = 224 × 224 mm, matrix = 64 × 64, thirty-eight slices.
fMRI Tasks
Motor tasks used in these protocols included ≥1 of the following: finger motion, foot motion, or tongue motion, depending on the tumor location and the judgment of the supervising radiologist. Language tasks included ≥1 of the following: verb generation (in which a written noun is displayed and the patient is asked to covertly generate an appropriate verb), antonym generation (in which a written word is displayed and the patient is asked to covertly generate an appropriate antonym), and letter fluency (in which a written letter is displayed and the patient is asked to covertly generate words that begin with that letter). The block design consists of 21-second intervals, alternating between active and control blocks, totaling 3 minutes for the motor task and 4 minutes for each language task. Stimuli are presented by a projector-mirror system, and a finger response system is used to track patient participation.
Postprocessing
Postprocessing of blood oxygen level–dependent fMRI data was rendered automatically on a Prism Process (Prism Clinical Imaging) workstation following built-in steps that included within-series motion correction, spatial smoothing, and calculation of activation maps using a general linear model, which disregards EPI volumes deemed outliers and incorporates motion parameter estimates as a nuisance covariate. This automated processing on the Prism workstation used default options for spatial smoothing (a modest amount of Gaussian blur with a full width at half maximum of 4 mm) and for spatial extent thresholds/clustering (a correlation coefficient threshold of 0.35 in conjunction with a cluster radius of 5 mm and a cluster volume of 210 mm3), with additional statistical thresholding determined by the neuroradiologist during visual inspection of the activation maps.
The T1-weighted anatomic images were skull-stripped. No formal coregistration was performed at this initial processing step. These initial images are hereafter referred to as nonregistered (NR).
For assessing the effects of the registration method, we exported the NR images from Prism into the AFNI format for off-line coregistration. AFNI is the image-processing engine also used in Prism. The 3dAllineate function in AFNI was used to coregister EPI and T1-weighted images using Hellinger (HEL), mutual information (MI), normalized mutual information (NMI), correlation ratio (CR), and the local Pearson correlation (LPC) cost functions separately. We chose the default interpolation options of the 3dAllineate function, which uses linear interpolation internally during the steps of the alignment process (–interp option). As a weight function, we used a simple binary mask derived from the skull-stripped MPRAGE image.
Image Evaluation
The transformation parameters, consisting of 3 df in translation and 3 df in rotation, were automatically calculated by each registration algorithm. These transformation parameters were recorded for HEL, MI, NMI, CR, and LPC. Results were unambiguously congruent among the first 4 cost functions but notably divergent from LPC (see the Results section and Fig 2). Statistical analysis confirmed that LPC was significantly different from each of the other 4 methods, but neither HEL, MI, NMI, nor CR differed from one another. These results are not surprising because the first 4 cost functions belong to a category of information theory–based methods grounded in the joint histogram of the image intensities, whereas the modus operandi of the LPC method is entirely different. These results justify the use of HEL, which happens to be the default option in both AFNI and Prism, as a representative cost function for the category of information theory–based methods for further analysis against the LPC.
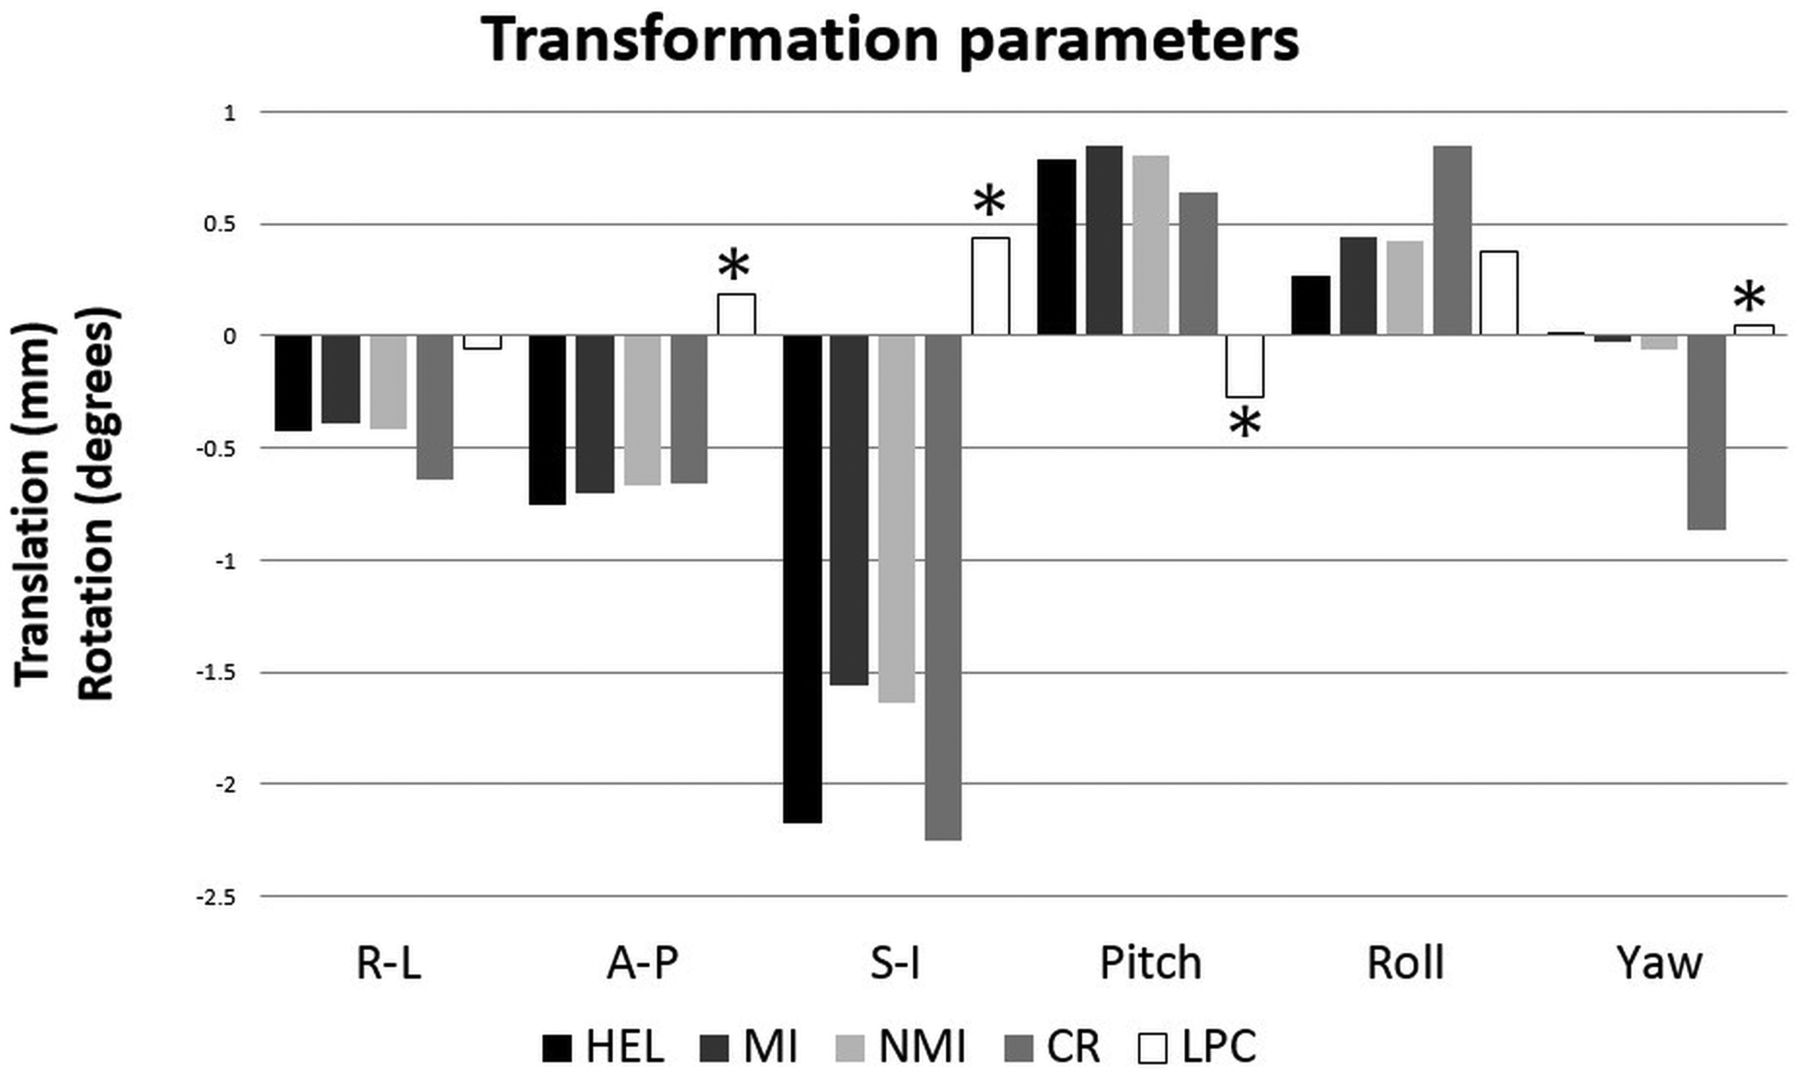
Graph plotting the average transformation parameters for translation and rotation as calculated by several metrics: Hellinger, mutual information, normalized mutual information, correlation ratio, and local Pearson correlation. The transformation effects of LPC are in the opposite direction (asterisks) for most translations and rotations, most notably the inferior translation and rotation in pitch. R-L indicates right-left; A-P, anterior-posterior; and S-I, superior-inferior.
The NR, HEL, and LPC brain activation images were imported back into Prism to standardize the image display among the 3 methods. All images were resampled and cubic spline–interpolated to the 1-mm isotropic voxel size of the MPRAGE images. The blood oxygen level–dependent fMRI threshold level was visually optimized, as is routine practice in clinical work, by a board-certified neuroradiologist (F.D.R.) with 6 years of experience interpreting fMRI studies; but for each patient, the threshold level was held constant across all registration methods being compared. T1-weighted MPRAGE window-level settings were exaggerated for high contrast to easily delineate the tumor margin.
All activation areas located within 40 mm of the tumor margins were identified on any of the axial, coronal, and sagittal planes on either motor or language tasks. This distance was somewhat arbitrarily selected simply for collecting samples for subsequent analysis. The LAD was measured for each of these activation areas on all 3 registration methods.
To adjudicate the accuracy of spatial alignment among these 3 methods, the 3dedge3 function in AFNI was applied to the EPI data to create edge-enhanced EPI maps, which afford direct visual inspection of misalignment with respect to anatomic detail on the MPRAGE images. Following the work of a prior study,5 we rated these edge-enhanced versions of the NR, HEL, and LPC images for accurate alignment with the ventricular and sulcal margins using the following rating system: 1, grossly misaligned; 2, >5-mm error; 3, two- to five-millimeter error; and 4, zero- to two-millimeter error.
Statistical Analysis
Statistical analysis of the differences in transformation parameters among HEL, MI, NMI, CR, and LPC was performed using a repeated-measures ANOVA with the registration method and transformation parameter as levels of within factors. We performed statistical analysis of the differences in LAD among NR, HEL, and LPC for each imaging plane separately using repeated-measures ANOVA, treating the registration method as the within-subject factor and subjects as levels of a between factor. Treating observations in each subject as coming from separate “groups” allows the modeling of a subject-by-method interaction effect and can help remove any bias in the main effect toward a particular method caused by a few subjects. Huynh-Feldt corrections to the number of dfs in the F-tests were used on the basis of a moderate departure from sphericity (Greenhouse-Geisser epsilon of >0.75).
Results
Thirty consecutive patients undergoing presurgical fMRI were examined. Five patients were excluded because they were scanned for indications other than tumor or were deemed clinically nondiagnostic. Of the patients included, 5 fMRI runs were excluded because there was no activation area within 40 mm of the tumor margin. Therefore, a total of 25 patients were evaluated with a combined total of 75 motor and language tasks. A total of 320 LADs were identified and measured, consisting of 56 in the axial plane, 112 in the coronal plane, and 152 in the sagittal plane.
The transformation parameters as calculated by each cost function were unambiguously congruent among HEL, MI, NMI, and CR but notably divergent from LPC (Fig 2). In fact, the transformation effects of the first 4 cost functions were in the opposite direction for most of the translations and rotations compared with LPC. The most notable discordance was inferior translation and rotation in pitch (ie, nodding the head). A repeated-measures ANOVA was performed with registration method and transformation parameters as levels of within factors. The analysis showed a highly significant effect of the registration method (P < .001). In Bonferroni-corrected pair-wise comparisons, the LPC method was significantly different from each of the other 4 methods (P < .001), whereas neither of HEL, MI, NMI, nor CR differed from one another at the P < .05 level. These results justify the use of HEL, which happens to be the default option in both AFNI and Prism, as a representative cost function for the category of information theory–based methods for further analysis against LPC. Direct visual inspection of edge-enhanced EPI revealed that HEL worsened misalignment with respect to NR in 59% of cases, primarily exaggerating inferior translation; no cases were worsened by LPC. HEL improved alignment in 11% of cases; LPC improved 41% of cases (Fig 3).

Histogram summarizing the objective assessment of coregistration using edge-enhanced images for both HEL and LPC compared with the initial nonregistered condition. In the case of the HEL metric, the accuracy of function-to-structural alignment actually worsens in 59% of cases and improves in 11% of cases. However, in the case of the LPC metric, none of the cases worsened and 41% improved.
Figure 4 illustrates a typical case. The bottom row shows the edge-enhanced EPI superimposed on the anatomic T1-weighted images. Attention to the ventricular margin, tumor margin, and peripheral sulcal margins reveals alignment that is slightly too high on NR (rated 2 for 2- to 5-mm error), too low on HEL (rated 2 for >5-mm error), and just right on LPC (rated 4 for 0- to 2-mm error). The upper row shows an activation area from the antonym task near the left parietal lobe tumor on a coronal section. The LADs were 2.6 mm for NR, 12.9 mm for HEL, and 7.4 mm for LPC. Incidentally, these images also show an activation area in the ventral temporo-occipital junction, which was inferiorly displaced with the HEL method and inadvertently localized below the tentorium within the cerebellum.

The upper row displays activation areas from the antonym task superimposed on coronal MPRAGE images (A–C). The high-contrast window-level setting helps demarcate the tumor in the left parietal lobe (asterisks). Lesion-to-activation distance between the tumor and the nearest activation area (large yellow arrows) is quite different: 2.6 mm in NR (A), 12.9 mm in HEL (B), and 7.4 mm in LPC (C). Notice that the activation area in the ventral temporo-occipital junction (green arrowheads) is displaced in the cerebellum in HEL (B). The lower row consists of edge-enhanced EPI superimposed on MPRAGE images (D–F). Visual inspection reveals that edge-enhanced EPI (small blue arrows) is too high in the initial NR (D), too low in HEL (E), but just right in LPC (F).
The 320 LADs were analyzed for differences among NR, HEL, and LPC. The repeated-measures ANOVA test showed significant differences in the coronal (P < .001) and sagittal (P = .04) planes, but not in the axial plane (P = .55). Pair-wise comparisons between registration methods confirmed significant differences for LPC versus NR (P < .001) and for LPC versus HEL (P < .001) but not for HEL versus NR for those planes that exhibit a significant effect of method (coronal and sagittal).
Histogram analysis of differences in LAD measured among NR, HEL, and LPC (Fig 5) revealed that the maximum LAD difference was <3 mm in most cases; however, 105 (33%) cases had a >3-mm discrepancy, almost all in the coronal and sagittal planes, even up to a 10.9-mm LAD difference. Figure 6 isolates the LAD differences between LPC, which is taken to represent accurate alignment based on the edge-enhanced analysis, and nonregistered. This contrast, therefore, reveals the degree of misalignment when registration is not performed. In this case, 27 (8%) cases have >3 mm discrepancy, almost all in the coronal and sagittal planes and up to a 5.6-mm LAD difference. Figure 7 isolates the LAD differences between LPC, which yields accurate alignment, and HEL, which has been shown to systematically introduce misregistration error. This contrast emphasizes the degree of misalignment that may result if a poor registration method is chosen. In this situation, 75 (23%) cases have a >3-mm discrepancy, almost all in the coronal and sagittal planes, and up to a 6.9-mm LAD difference.

Histogram displaying the maximum differences in LAD among LPC, HEL, and NR. Data are also sorted by imaging plane. Notice that the LAD difference is <3 mm in most cases, and this is especially true in the axial plane. However, a nontrivial number of cases have a >3 mm discrepancy, particularly in the coronal and sagittal planes.

Histogram of the maximum differences in LAD between LPC and NR. Data are also sorted by imaging plane. Because edge-enhanced analysis has shown LPC to produce accurate alignment, the contrast between LPC and NR reveals the degree of misalignment when registration is not performed. The most pronounced LAD differences are found in the coronal and sagittal planes.

Histogram of the maximum differences in LAD between LPC and HEL. Data are also sorted by imaging plane. Because it has been shown that LPC produces accurate alignment and that HEL systematically introduces misregistration error, the contrast between LPC and HEL serves to illustrate the degree of misalignment that may result if a poor registration metric is chosen. The most pronounced LAD differences are found in the coronal and sagittal planes.
Discussion
Registration consists of iterative algorithms that minimize an intensity-based cost function, which is a quantitative metric of how well 2 volumes are being aligned.5⇓–7 The transformation model may involve 6 df with 3 for translation and 3 for rotation (called rigid-body registration) or 9 df epsilons, adding 3 for scaling, or 12 df epsilons, adding 3 for shearing (called “full affine registration”), or >12 df epsilons, consisting of a diverse family of nonlinear algorithms. There is currently no consensus on which complex nonlinear registration techniques are reliable enough to guide clinical interpretations.
Rigid-body transformation remains the industry standard for fMRI registration. This standard makes sense because we are aligning images taken from the same patient during the same session so that true structural differences between undistorted images with different weightings are not expected. However, in fMRI, the underlying T2* images are distorted nonuniformly, resulting in misalignment that rigid-body registration cannot fully correct. Proper alignment is also affected by signal drop-out in the T2* images due to air-tissue interfaces such as the nasal sinuses. The choice of metric or cost function is crucial but not yet standardized to obtain the best rigid-body registration despite the presence of these distortions. Most vendors supporting clinical software have made the choice of which cost function is used, usually mutual information or normalized mutual information, as reviewed earlier. In the case of Prism, the clinical imaging platform used at our institution, the default cost function is HEL, though alternative metrics are at least also available, including LPC. Validation of these choices is lacking.
Correct localization of fMRI activation is essential if LAD is to be used for prognostic value and risk assessment. Even a small amount of misalignment can lead to misinterpretation of the functional significance of fMRI activation, such as in the case of activation being classified as cerebellar instead of cerebral (Fig 4). Not only in the clinical setting but also in basic science research, correct anatomic localization of fMRI activation is an elementary expectation.
A number of publications have explored the significance of LAD for presurgical fMRI risk assessment. Concerning motor function, 1 study reported a higher risk of new postoperative deficits with an LAD of <5 mm, but complete resection without deficits was achieved for an LAD of >10 mm.8 For language function, Kundu et al9 found that the LAD with respect to the Broca area was 17.5 mm for the group with postoperative deficits but 26.8 mm for the group with no deficits. Similarly, the LAD with respect to the Wernicke area was 13.9 mm with deficits but 29.6 mm with no deficits. Wood et al10 found an overall correlation between LAD and mortality and furthermore reported that motor deficits increased linearly with a closer LAD but language deficits increased exponentially with a closer LAD (<20 mm), while leveling off and not further diminishing with farther LADs (>20 mm), which the authors posit may reflect the more distributed nature of language networks. Bailey et al11 found that the LAD, particularly for expressive language, failed to predict postoperative deficits. The authors suggested that their findings, though counterintuitive at first glance, actually corroborate the added value of presurgical fMRI because neurosurgeons would react appropriately and take a more cautious surgical approach to successfully minimize postoperative deficits. Another study scrutinized the accuracy of motor and language activation sites in fMRI when judged against the criterion standard of intraoperative electrocortical stimulation and found that all such correlations were within 20 mm and 87% of correlations were within 10 mm.12 The discrepancies likely reflect the combined error of technical factors, including spatial resolution, smoothing, geometric distortion, patient motion, misregistration, and stereotactic localization error and stimulation effects.
While these investigations into the prognostic value of LADs and the validity of fMRI results are meaningful, surprisingly, some references even neglected to mention the crucial postprocessing step of coregistration at all. This present study brings attention specifically to the choice of cost function because it has been underappreciated and its accurate implementation impacts image interpretation. Given that it matters which registration algorithm is applied, it is disconcerting that so many clinical (and basic science) fMRI articles give it so little attention. None of the studies cited above specified the cost function, presumably because the choice is thought to be “standard” and because better choices cannot be distinguished from poor choices. Two of them explained that EPI was manually nudged “for perceived optimal spatial coregistration.”9,10 However, visual checking and manual nudging are user-dependent and difficult to standardize.
In this study, the performance of several cost functions was compared alongside LPC. HEL was specifically chosen because this is the default cost function in AFNI and Prism, which is the FDA-approved postprocessing software used at our institution. HEL13 and the more common MI14 are both information theory–based cost functions and widely used for generic multitechnique registration.
LPC, introduced by Cox et al3 in 2008 and Saad et al4 in 2009, is a special-purpose cost function specifically designed for T2*–T1 coregistration by taking advantage of known differences in contrast between the 2 modalities, though it is not yet widely used. It exploits the strong negative correlation that CSF is bright on T2* images but dark on T1 images. This cost function is further distinguished by being more heavily weighted toward the CSF signal and by incorporating localized estimates with a scalar nonlinear stretching to accentuate larger correlations to accommodate nonuniformity artifacts. LPC was demonstrated to outperform a range of other cost functions, including MI, CR, and HEL.
An alternative rigid-body algorithm that bears similarities to LPC is boundary-based registration, which incidentally is made available in the FSL research platform. It, too, has proved superiority in T2*–T1 coregistration compared with the correlation ratio and normalized mutual information.15
Other groups have explored more exotic approaches using nonlinear techniques to correct the underlying geometric distortions inherent in EPI for the purpose of optimizing fMRI coregistration.16⇓–18 Direct head-to-head comparisons between rigid and nonlinear techniques have been undertaken in both fMRI19 and PET/MR imaging.20 In the fMRI study, the authors concluded that their particular nonlinear algorithm was superior to affine transformation, which happened to use normalized mutual information. In the PET/MR imaging study, of the limited selection of metrics evaluated, the 9-df transformation and the 12-df full affine transformation fared better than the 6-df rigid transformation or the 12+-df nonlinear algorithm. However, neither LPC nor boundary-based registration was used in these analyses. For nonlinear registration algorithms to be validated, they must be shown to reliably preserve accurate distances in patient scans. If this is shown to be the case at a future time, the option should exist for these algorithms to be placed alongside, or even in place of, the existing best standard for fMRI registration.
Our methodology has several potential limitations. Patient sample size was not large, and data collection was limited to a single institution. Moreover, only a select number of cost functions were compared, but as explained previously, this decision was influenced by the cost functions currently in clinical use and the options available in Prism (which uses an AFNI engine). For instance, AFNI does not offer boundary-based registration, and Prism cannot support FSL outputs. Second, evaluation of the tumor margin may be considered suboptimal on non-contrast-enhanced T1-weighted images so that tumor and edema were probably not perfectly differentiated. However, even on contrast-enhanced images, identifying nonenhancing tumor is still a problem, and regardless, the only detail pertinent to the current analysis is that the same tumor margin is used across all registration methods for consistent LAD measurements. Last, the activation areas were chosen on the basis of proximity, but their clinical significance was not considered and correlative intraoperative mapping was not available.
There are several future directions worth considering. The performance of the local Pearson correlation can be compared between different registration models, for instance 6-parameter rigid body versus 12-parameter full affine. Furthermore, a separately acquired field map can be used for correction of geometric distortion. Therefore, registration with and without field map–based correction can be assessed. Head-to-head comparison between LPC and boundary-based registration would also be interesting. Our results are preliminary in this regard and may serve as a catalyst for more definitive work.
Conclusions
Comparison of transformation parameters, visual inspection of edge-enhanced EPI, and statistical analysis of LAD differences in the different planes are all concordant with the fact that HEL and other similar cost functions introduce systematic error, primarily in terms of exaggerated inferior translation. This inferior shift is not surprising because registration algorithms must deal with missing data in the form of signal drop-out near the skull base from susceptibility artifacts in T2* echo-planar imaging. On the other hand, the LPC algorithm, which uses a different modus operandi, performs superbly. On the basis of our patient series, we found that if formal coregistration is not performed in routine clinical fMRI, patient motion between EPI runs and between EPI and MPRAGE images (the dominant source of initial misalignment) causes up to a 5.6-mm error. If a poorer registration metric is used (ie, HEL instead of LPC), yet another source of misalignment may further muddle the situation, contributing up to a 6.9-mm error. It is important that fMRI users be aware of the limitations and variabilities in registration methods to avoid potential adverse outcomes, and that the LPC metric appears promising for routine T2*–T1 co-registration.
A few general recommendations follow. In the research world, while there are existing pipelines in both AFNI (using LPC) and FSL (using boundary-based registration) for optimal T2*–T1 coregistration, there is no guarantee that individual researchers using even these platforms will run the correct scripts. The peer-review process should have the expectation that one disclose the registration methodology, including cost function, df, software platform, and quality control. Our primary interest lies with commercial vendors supporting clinical fMRI. Thus, we note that Prism is the only software FDA-approved for clinical use that makes LPC available, though not by default. Vendors are encouraged to incorporate LPC (or perhaps boundary-based registration) as the default registration metric for T2*–T1 coregistration. fMRI users would also benefit if commercial software made available quality-control measures similar to the edge-enhanced rendering applied in this study. National organizations such as the American Society of Functional Neuroradiology and the Quantitative Imaging Biomarker Alliance fMRI section may consider incorporating recommendations for the standardization of the cost function and possibly specific quality-control measures to promote best practices. While there is no current industry standard for optimal functional-to-structural alignment, our results and review argue that there should be.
Acknowledgments
We thank Beverly Meacham, MR imaging technologist from the University of Kentucky; Chad Neller and Jim Reuss from Prism; Cathy Elsinger from NordicNeuroLab; Erik Peterson from Invivo; John Murray from Brainlab; David Carpenter from Siemens; and Olaf Roeder from GE Healthcare.
Footnotes
Paper previously presented, in part, at: Annual Meeting of the American Society of Functional Neuroradiology, October 9–11, 2017; Portland, Oregon.
References
- Received January 9, 2018.
- Accepted after revision August 25, 2018.
- © 2018 by American Journal of Neuroradiology


