
Abstract
BACKGROUND AND PURPOSE: Vestibular symptoms are common after concussion. Vestibular Ocular Motor Screening identifies vestibular impairment, including postconcussive visual motion sensitivity, though the underlying functional brain alterations are not defined. We hypothesized that alterations in multisensory processing are responsible for postconcussive visual motion sensitivity, are detectable on fMRI, and correlate with symptom severity.
MATERIALS AND METHODS: Twelve patients with subacute postconcussive visual motion sensitivity and 10 healthy control subjects underwent vestibular testing and a novel fMRI visual-vestibular paradigm including 30-second “neutral” or “provocative” videos. The presence of symptoms/intensity was rated immediately after each video. fMRI group-level analysis was performed for a “provocative-neutral” condition. Z-statistic images were nonparametrically thresholded using clusters determined by Z > 2.3 and a corrected cluster significance threshold of P = .05. Symptoms assessed on Vestibular Ocular Motor Screening were correlated with fMRI mean parameter estimates using Pearson correlation coefficients.
RESULTS: Subjects with postconcussive visual motion sensitivity had significantly more Vestibular Ocular Motor Screening abnormalities and increased symptoms while viewing provocative videos. While robust mean activation in the primary and secondary visual areas, the parietal lobe, parietoinsular vestibular cortex, and cingulate gyrus was seen in both groups, selective increased activation was seen in subjects with postconcussive visual motion sensitivity in the primary vestibular/adjacent cortex and inferior frontal gyrus, which are putative multisensory visual-vestibular processing centers. Moderate-to-strong correlations were found between Vestibular Ocular Motor Screening scores and fMRI activation in the left frontal eye field, left middle temporal visual area, and right posterior hippocampus.
CONCLUSIONS: Increased fMRI brain activation in visual-vestibular multisensory processing regions is selectively seen in patients with postconcussive visual motion sensitivity and is correlated with Vestibular Ocular Motor Screening symptom severity, suggesting that increased visual input weighting into the vestibular network may underlie postconcussive visual motion sensitivity.
ABBREVIATIONS:
- BESS
- Balance Error Scoring System
- DHI
- Dizziness Handicap Inventory
- FEF
- frontal eye fields
- MT/V5
- middle temporal visual area
- PCSS
- Post Concussion Symptom Scale
- PCVMS
- postconcussive visual motion sensitivity
- PIVC
- parietoinsular vestibular cortex
- VOMS
- Vestibular Ocular Motor Screening
- VVAS
- Visual Vertigo Analog Scale
Up to 3.8 million concussions occur annually in the United States, with estimated direct and indirect costs totaling more than $12 billion.1,2 Vestibular symptoms occur in up to 80% of patients in the first few days following injury.3⇓-5 Persistent dizziness has been reported to occur in up to one-third of postconcussive patients reporting acute vestibular symptoms, and a positive Vestibular Ocular Motor Screening (VOMS) outcome is associated with protracted recovery.3,6,7 The link between visual and vestibular motion-processing is critical for spatial orientation and balance control, and oculomotor dysfunction, balance, and vestibular networks share multisensory integration pathways implicated as the primary deficits in postconcussive dizziness and imbalance.8⇓⇓-11
Similar to patients with other vestibular disorders, patients with postconcussive vestibular impairment may compensate through an increased reliance on other somatosensory input, leading to the re-weighting of sensory data including visual and vestibular cues.5,12⇓-14 We hypothesized that while these changes may be beneficial in the acute phase, persistent overreliance on a specific sensory system may become pathologic and maladaptive during recovery. This may lead to persistent and debilitating dizziness syndromes such as “visual motion sensitivity,” which are characterized by inappropriate responses including disorientation, dizziness, imbalance, and headaches triggered by visual environmental motion.5,12
The alterations in multisensory processing that likely underlie visual motion sensitivity are currently largely theoretic and represent an important knowledge gap in our understanding of these symptoms.15 We hypothesized that alterations in multisensory processing involving the primary vestibular cortex and associated input are responsible for postconcussive visual motion sensitivity (PCVMS). The purpose of this study was to define functional brain activation in patients with PCVMS compared with control subjects and to correlate these changes with clinical symptom severity. To this end, we have developed a novel visual-vestibular task-based fMRI paradigm, which is presented here for the first time.
MATERIALS AND METHODS
Study Population
This study was approved by the Emory University and Shepherd Center Institutional Review Boards, and all subjects provided informed consent. Twelve subjects with subacute PCVMS and 10 age-matched controls without a history of concussion or vestibular impairment were recruited. Inclusion criteria for subjects with PCMVS were a diagnosis of concussion, as defined by the World Health Organization Collaborating Center for Neurotrauma Task Force16 2–12 weeks before enrollment; and clinical evidence of vestibular impairment, defined as a subjective report of dizziness and/or imbalance, clinical visual motion-sensitivity symptoms,17 and provocation of symptoms during VOMS.18 Exclusion criteria were being younger than 18 years of age or older than 50 years, a history of moderate or severe head injury, intracranial hemorrhage, seizure disorder, prior neurologic surgery, peripheral neuropathy, musculoskeletal injuries affecting gait and balance, and chronic drug or alcohol use. In addition, subjects with abnormal head impulse testing findings or videonystagmography consistent with peripheral vestibular hypofunction or benign paroxysmal positional vertigo were excluded.
Clinical Testing
Both groups completed the Post Concussion Symptom Scale (PCSS).19 Self-report and subjective measures included the Dizziness Handicap Inventory (DHI),20 Visual Vertigo Analog Scale (VVAS),21 and VOMS.18 Objective measures included balance assessment with the Balance Error Scoring System (BESS),8 drop stick reaction time,22 and videonystagmography.
Video Optic Flow Assessment
Motion optic flow from each neutral and provocative 30-second video (defined below) was estimated using the Farneback algorithm23 from OpenCV (Open Source Computer Vision Library). Each video was converted into gray-scale, and then a Farneback algorithm (parameters: window size = 3, levels = 1, iterations = 15, pixel neighborhood size = 3, SD of Gaussian-to-smooth derivatives used for a basis for polynomial expansion = 5) was applied. Mean flow between each pair of frames was averaged across the entire video, providing an estimate of flow. A 2 (group: PCVMS versus control) × 2 (video: provocative versus neutral) mixed-design ANOVA was used to evaluate group-level change in symptoms from baseline in response to the videos.
MR Imaging Acquisition
All MR imaging scans were acquired on a 3T Tim Trio scanner (Siemens) with a 12-channel head coil. Sequences included the following: T1-weighted 3D-MPRAGE (FOV = 256 mm, 176 slices, 1-mm3 isotropic voxels, TR = 2250 ms, TE = 3.98 ms, TI = 850 ms, flip angle = 9°), gradient-echo fieldmap (37 slices, TR = 488 ms, TE1 = 4.92 ms, TE2 = 7.38 ms, flip angle = 60°, in-plane resolution = 3 × 3 mm2, section-thickness = 3 mm, gap =0.5 mm), and task-based fMRI (37 slices, TR = 2000 ms, TE = 30 ms, flip angle = 90°, FOV = 204 mm, matrix-size = 68 × 68, in-plane resolution = 3 × 3 mm2, section thickness = 3 mm, gap = 0.5 mm, generalized autocalibrating partially parallel acquisition = 2, with 603 volumes).
A novel task-based, block design visual-vestibular fMRI paradigm was developed for this study (Online Supplemental Data). Videos were chosen from our vestibular rehabilitation therapy program, which includes progressive exposure to complex visual stimuli. Provocative videos were defined as those from which patients noted an increase in headache, dizziness, nausea, or fogginess symptoms while viewing. Subjects randomly viewed 5 provocative videos and 5 neutral videos containing nonprovocative content. Immediately after each 30-second video, subjects rated their predominant symptom followed by the symptom intensity on a 5-point Likert scale. Each question was presented for 7.5 seconds. After the 15-second question period, subjects fixated on a crosshair for 15 seconds. This process was then repeated until each subject had viewed all 10 videos.
MR Imaging Analysis
fMRI data processing was performed with FSL FEAT, Version 6.00 (https://fsl.fmrib.ox.ac.uk/fsl/fslwiki/FEAT). Prestatistics processing was applied including the following: motion correction using MCFLIRT (https://fsl.fmrib.ox.ac.uk/fsl/fslwiki/MCFLIRT);24 distortion correction using Boundary-Based Registration (BBR; https://fsl.fmrib.ox.ac.uk/fsl/fslwiki/FLIRT_BBR) and FUGUE (https://fsl.fmrib.ox.ac.uk/fsl/fslwiki/FUGUE);25,26 nonbrain removal using the FSL Brain Extraction Tool (BET; https://fsl.fmrib.ox.ac.uk/fsl/fslwiki/BET);27 spatial smoothing using a Gaussian kernel of full width at half maximum of 5 mm; grand mean intensity normalization of the entire 4D dataset by a single multiplicative factor; and high-pass temporal filtering (Gaussian-weighted least-squares straight line fitting, with ς =50.0 seconds). Independent Component Analysis was performed with MELODIC (https://fsl.fmrib.ox.ac.uk/fsl/fslwiki/MELODIC).28 Components from head motion and physiologic noise were manually identified and filtered out using the FSL_Regfilt script (http://wikis.la.utexas.edu/imagelab/book/fsl-regfilt.html). FLIRT (https://fsl.fmrib.ox.ac.uk/fsl/fslwiki/FLIRT) was used for registration to high-resolution structural and/or standard space images.24,29 Registration from high-resolution structural-to-standard space was further refined using FNIRT (https://fsl.fmrib.ox.ac.uk/fsl/fslwiki/FNIRT) nonlinear registration.30,31
Time-series statistical analysis was performed on the preprocessed data using FILM (https://fsl.fmrib.ox.ac.uk/fsl/fslwiki/FEAT) with local autocorrelation correction.32 Regressors of interest were generated using stimulus-onset timing for provocative videos, neutral videos, and rating conditions convolved with a double-γ hemodynamic response function. Temporal derivatives of these regressors were included to achieve a better fit to the data. Confound regressors included 6 head-motion parameters and motion-outlier volumes. A contrast was defined as brain areas showing greater response to provocative videos than neutral videos (provocative-neutral). Contrast of parameter estimates from each subject were subsequently used to perform higher-level analyses carried out using FLAME (https://fsl.fmrib.ox.ac.uk/fsl/fslwiki/FEAT) stage 1 with automatic outlier detection.33⇓-35 Group mean activation maps were generated for PCVMS and control groups. A 2-sample unpaired t test was performed to find differences in activation between the groups for the first-level contrast provocative-neutral. Resultant Z (Gaussianised t) statistic images were thresholded nonparametrically using clusters determined by Z > 2.3 and a corrected cluster significance threshold of P = .05.
fMRI ROIs and VOMS-fMRI Correlations
ROIs were selected from areas found to have statistically significant differences in activation between patients with PCVMS and controls as well as those that are hypothesized to be related to visual-vestibular processing.36,37 Spheric ROIs of 5-mm radii were created for the following (Online Supplemental Data): the parietoinsular vestibular cortex, frontal eye fields (FEF), posterior hippocampus, middle temporal visual area (MT/V5), middle frontal gyrus, inferior frontal gyrus, and inferior parietal lobule. fMRI mean parameter estimates within each ROI for provocative-neutral contrast defined above were extracted from each subject.
VOMS testing was performed immediately before the MR imaging session and included assessment of symptoms (headache, dizziness, nausea, and fogginess) at rest and after smooth pursuit, horizontal saccades, vertical saccades, near-point convergence, horizontal vestibular-ocular reflex, vertical vestibular-ocular reflex, and visual motion-sensitivity testing. For each subject, the results of the pre-MR imaging VOMS testing were transformed as follows: 1) sum of domain scores for the initial, nonprovoked results (initial aggregate); 2) sum of domain scores on initial testing subtracted from the sum of all provocation testing conditions (Δ aggregate); 3) sum of domain scores for each individual provocation testing condition; 4) difference between the sum of domain scores on the initial and each individual provocative testing condition (Δ condition); and 5) domain score that demonstrated the highest change between initial and provocative testing (highest condition). Correlation analysis was performed between ROI brain activation and VOMS testing using the Pearson correlation coefficient, with a significance threshold of P ≤ .05 and reported with 95% CIs.
Statistical Analysis
Unless otherwise noted, differences between groups on demographic, clinical, and video metrics were evaluated using a 2-tailed Student t test, χ2 test, ANOVA, or Mann-Whitney U nonparametric test when appropriate. P values ≤ .05 were considered statistically significant.
RESULTS
Demographic and Clinical Data
The PCVMS group consisted of 12 patients (1 male, 11 females; 29.3 [SD, 12.9] years of age with 15.8 [SD, 2.6] years of schooling) who were evaluated for vestibular impairment 2–12 weeks following a concussion (mean, 39.8 days; median, 22 days). The control group consisted of 10 patients (9 men, 1 woman; 27.5 [SD, 4.0] years of age with 19.8 [SD, 0.8] years of schooling). There was no statistically significant difference between age (2-tailed t test, P = .70) or ethnicity (χ2 test, P = .89) of these 2 groups; however, both sex (2-tailed t test, P < .001) and years of schooling (2-tailed t test, P < .001) were significantly different between the groups. All subjects in both groups were right-handed.
None of the control subjects had experienced a concussion in the preceding 6 months. For the PCVMS group, 5 subjects reported a sports-related concussion; 6 subjects, a non-sports-related concussion; and 1 subject had both. The results of subjective and objective testing are shown in Table 1. The PCVMS group reported significantly more symptoms on the PCSS, the Dizziness Handicap Inventory, and the VVAS, and they were significantly more impaired on all VOMS domains.
Clinical testing in patients with PCVMS and control subjectsa
Video Optic Flow and Symptom Response
Provocative videos had significantly greater mean and maximum optic flow values in comparison with neutral videos (2-tailed t test, P < .01; Online Supplemental Data). In addition, there was significantly greater variance in optic flow in provocative than in neutral videos (2-tailed t test, P < .01; Online Supplemental Data).
All subjects rated the type and intensity of subjective symptoms immediately after viewing each video during the fMRI acquisition (Online Supplemental Data). Due to a technical error, the response data from a single subject with PCVMS was not recorded. None of the control subjects reported symptoms while viewing neutral videos. The mean [SD] symptom-intensity increase over baseline for the control group was 0 [SD, 0] for neutral and 0.12 [SD, 0.48] for provocative videos. The PCVMS group reported significantly increased mean symptom intensity after viewing both neutral videos (0.55 [SD, 2.63]) and provocative videos (2.08 [SD, 2.16]) in comparison with the control group (main effect of group, F (1, 416) = 16.28, P < .001). The increase in mean symptom intensity between viewing neutral and provocative videos was statistically significant for both the PCVMS (2-tailed t test, P < .001) and control (2-tailed t test, P = .011) groups.
Visual-Vestibular fMRI
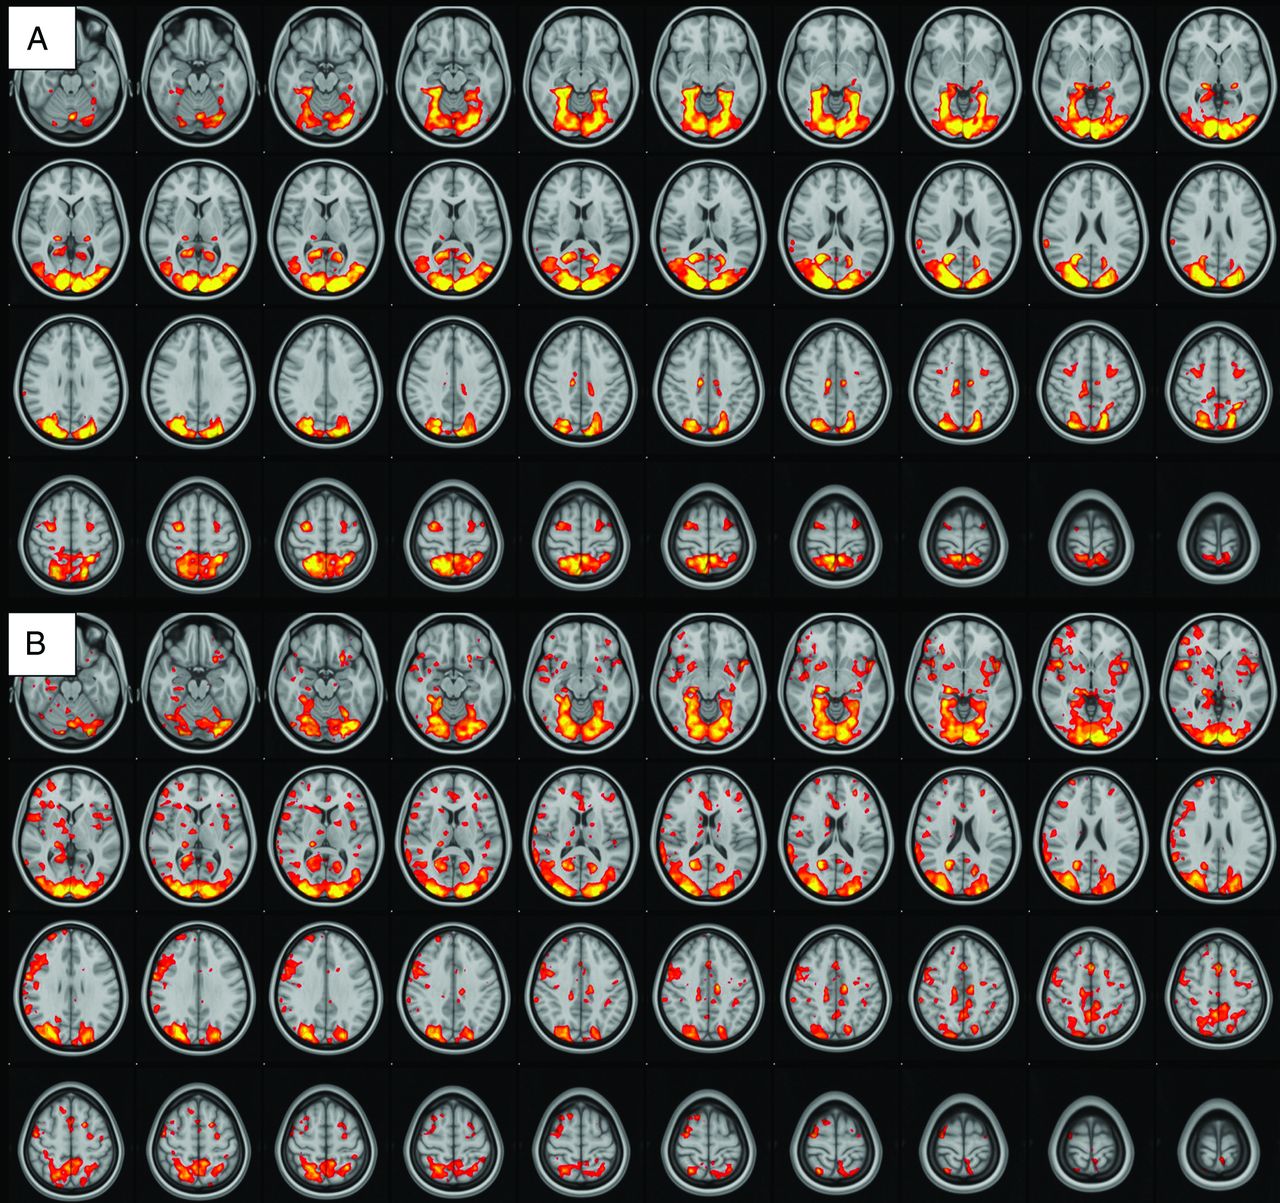
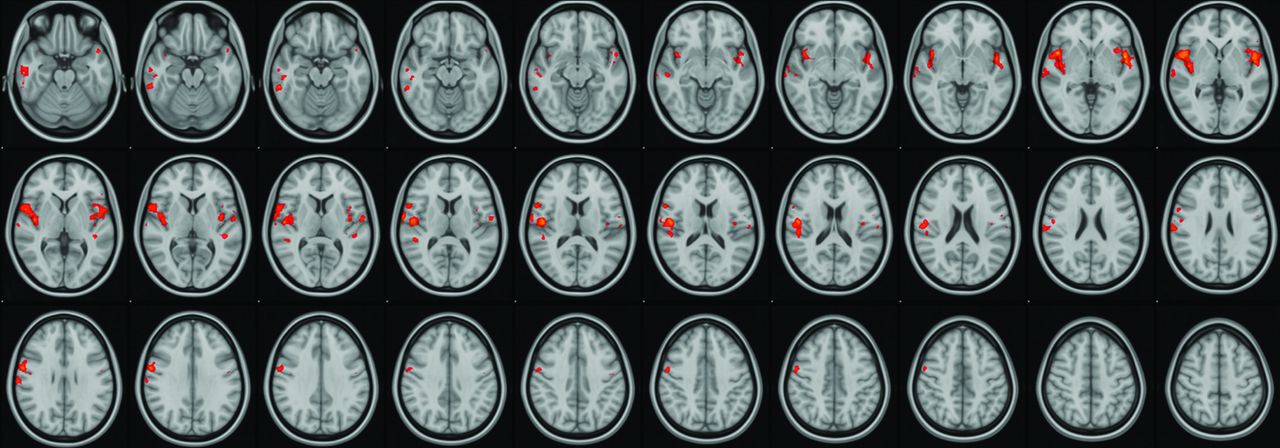
There was robust mean activation in both groups when viewing provocative videos in comparison with neutral videos (provocative-neutral) in several brain regions (Fig 1). Selective increased activation was demonstrated in the PCVMS versus control groups (PCVMS>control) for provocative-neutral contrast in several brain regions (Fig 2 and Online Supplemental Data). In particular, activation was seen in the bilateral central opercular and insular cortices and the right inferior frontal and supramarginal gyri. The control>PCVMS group contrast did not reveal any statistically significant activation.

fMRI visual-vestibular paradigm group results. Group mean activation for provocative-neutral contrast in control subjects (A) and patients with PCVMS (B). Widespread activation is seen in the bilateral occipital lobe primary and secondary visual areas, parietal lobes, PIVC, frontal lobes in the region of the FEF, and cingulate gyri.

fMRI visual-vestibular paradigm PCVMS results. Selective increased activation was demonstrated in the PCVMS>control group for provocative-neutral contrast in several regions, including the opercular cortex, insular cortex, inferior and middle temporal gyri, precentral gyrus, inferior frontal gyrus, and supramarginal gyrus.
fMRI-VOMS Correlations
Moderate-to-strong statistically significant correlations were found between the transformed VOMS obtained immediately before the MR imaging and activation in several ROIs when viewing provocative videos in comparison with neutral videos (provocative-neutral) in the FEF, posterior hippocampus, and MT/V5 (Table 2). No other statistically significant correlations between the remaining ROIs and VOMS scores were found.
Correlation between fMRI brain activation and VOMS testing scores in patients with PCVMS and control subjects
DISCUSSION
Using a novel task-based fMRI visual-vestibular paradigm, we found evidence of altered functional brain activation involved in multisensory processing of visual-vestibular stimuli in patients with PCVMS. Moreover, we have demonstrated that significant correlations exist between regional functional brain activation and clinical symptom severity assessed with VOMS.
Because most adult patients with concussion recover within 2 weeks,38 we chose to focus on patients with subacute vestibular impairment symptoms. As expected, our PCVMS population demonstrated significantly increased PCSS symptoms. Because vestibular impairment was part of our inclusion criteria for this group, it is also not surprising that subjects with PCVMS reported significantly greater impairment on the Dizziness Handicap Index, the VVAS, and VOMS. Notably, there was no statistically significant difference between groups on more objective clinical measurements of balance (BESS) and reaction time (drop stick), which is concordant with prior studies demonstrating that balance measures such as the BESS fail to differentiate those with concussions from controls outside of the acute phase.39⇓-41 Our results provide some of the first concrete evidence that central mechanisms involving the vestibular network and its input are likely responsible for visual motion sensitivity–related dysfunction, which, to date, has been largely theoretic.15
Our novel task-based fMRI visual-vestibular paradigm includes a combination of naturalistic videos with either provocative or neutral content for patients with PCVMS. Because head motion is prohibited in the MR imaging environment, this paradigm provides a surrogate for visual-vestibular sensory conflict because participants may experience a subjective sense of motion induced by these videos, while vestibular sensory input indicates that the participant is stationary. The provocative videos used in the current study demonstrated significantly more objective optic flow and induced more symptoms in patients with PCVMS, indicating that these videos replicate symptom-producing scenarios these patients experience outside the magnet. The current fMRI paradigm provides a novel framework in which to study differential brain activation in patients with PCVMS.
The vestibular network includes the vestibular end organs, brain stem nuclei, thalami, and the parietoinsular vestibular cortex (PIVC).36,42,43 In this study, we focused on the central mechanism of vestibular impairment and excluded subjects with peripheral vestibular end organ dysfunction. In addition to the PIVC, prior studies have reported that vestibular stimuli activate the more anterior insula and operculum, FEF, hippocampus, and parahippocampal areas, among others.36,43 Similar to language lateralization, PIVC activation occurs asymmetrically with vestibular stimulation, with the primary vestibular cortex localized to the nondominant hemisphere,44 concordant with our findings.
A recent fMRI study reported that whereas isolated visual stimulation produces activation in the primary and associative visual cortices and isolated vestibular stimulation activates the PIVC and inferior parietal lobe, bimodal visual/vestibular stimulation produces additional activation of the middle and inferior frontal gyri.37 These regions have been suggested to represent multisensory convergence zones for the vestibular and visual networks, with input from the parietal, occipital, and temporal lobes.37 In addition, Brandt et al45 hypothesized the presence of a multisensory orientation area that receives input from the thalamus and visual cortices and co-localizes to the nondominant hemisphere with the PIVC. This region is thought to serve as a primary site of multisensory processing related to higher vestibular spatial orientation. Our results support the importance of these regions in processing complex, provocative visual stimuli. We found selective increased activation in patients with PCVMS in both the hypothesized multisensory orientation area, including the nondominant hemisphere PIVC and adjacent cortex, as well as in the nondominant inferior frontal gyrus, the putative multisensory convergence zone for the vestibular and visual networks.
The posterior hippocampus also provides input to the PIVC and is hypothesized to be involved in spatial memory and contributes to vestibular dysfunction–related visual dependency.43 A prior study by Kontos et al46 reported decreased N-acetylaspartate/choline ratios, which reflect the ratio of neurons to metabolism in a region, within several hippocampal subdivisions in patients with postconcussive vestibular impairment, which were moderately-to-highly associated with impaired VOMS scores. We found similar positive correlations between VOMS testing and fMRI activation within the nondominant posterior hippocampus as well as correlations with the left FEF and left MT/V5 visual-association area.
While DTI has demonstrated decreased fractional anisotropy in several areas in patients with head injury and vestibular impairment, these have been located in the posterior fossa, medial temporal lobes, inferior occipital lobes, and centrum semiovale.47,48 No abnormal DTI metrics were reported in the vestibular-auditory network or in regions known to provide input into the PIVC. In conjunction with our functional results, in which we found increased (as opposed to decreased) activation, we hypothesized that the primary deficit in PCVMS may be altered multisensory processing, with particular increased weighting of visual-vestibular stimuli, and not primary injury or disruption of the PIVC and associated input.
While increased reliance on visual stimuli may be beneficial acutely in patients with postconcussive vestibular impairment, possibly to compensate for disrupted somatosensory input into the PIVC, persistent overreliance may become pathologic and maladaptive during recovery, manifesting as visual motor sensitivity in the subacute and chronic time periods. This increased visual reliance has clear implications for postconcussion vestibular rehabilitation therapy, which currently focuses on gaze stability and gait and balance exercises.49 Based on our fMRI results and preliminary clinical studies, the addition of interventions targeted to visual-vestibular processing may be more efficacious.50 We recently reported improved outcomes in patients with PCVMS using a combination rehabilitation intervention of conventional vestibular therapy coupled with a visual desensitization program that included progressively provocative videos similar to those used in the current visual-vestibular task-basedfMRI paradigm.51 This vestibular rehabilitation program may be further improved by incorporating therapies that target the areas of increased brain activation in patients with PCVMS detailed above.
The current study has several limitations. Despite the robust and statistically significant results found in our study, the sample size was relatively small. There were also significant differences between our patient populations, with control subjects having fewer women and a greater mean number of years of schooling than subjects with PCVMS. These differences, unfortunately, arose due to unequal drop-out of enrolled subjects across the 2 groups, which was, in part, related to the multisession study design, which required subjects to undergo both a research MR imaging and vestibular evaluation at different times and locations. Sex differences in response to traumatic brain injury have been reported, with women generally found to have a survival advantage.52 Because the postconcussive patients in our current study had more women than men, it may be that a larger effect would have been found if the 2 groups had been sex-matched. However, while it is possible that some of our group-level results may be due to sex and education differences, the correlations between symptom severity and regional fMRI activation are not reliant on matching the 2 group populations.
Furthermore, because the group-level analysis was partly used to identify ROIs for use in the symptom correlational analysis, the group mismatch has minimal consequences as these ROIs were substantiated by the more impactful finding of significant correlations between symptom severity and selective increased activation in patients with PCVMS, providing strong evidence to support the importance of these regions in driving PCVMS symptomatology. Finally, our study compared patients with PCVMS with healthy controls; therefore, our results may reflect general concussion changes as opposed to postconcussive vestibular impairment. However, selective fMRI activation using our visual-vestibular paradigm was again positively correlated with symptom severity, suggesting that our findings reflect PCVMS in particular.
CONCLUSIONS
Using a novel fMRI visual-vestibular paradigm, we found that patients with subacute PCVMS demonstrated increased activation in putative multisensory processing centers involved in visual-vestibular sensory processing. Furthermore, selective regional brain activation on fMRI was positively correlated with symptom severity. These findings suggest that increased weighting of input into the vestibular network may underlie PCVMS.
Footnotes
This work was supported by the Georgia State/Georgia Tech Center for Advanced Brain Imaging Neural Engineering Center Seed Grant and the Emory University Department of Radiology and Imaging Sciences Seed Grant.
Disclosures: Jason W. Allen—RELATED: Grant: Georgia State/Georgia Tech Center for Advanced Brain Imaging Neural Engineering Center Seed Grant and Emory University Department of Radiology and Imaging Sciences Seed Grant.* Anna Trofimova—RELATED: Grant: Georgia State/Georgia Tech Center for Advanced Brain Imaging Neural Engineering Center Seed Grant and Emory University Department of Radiology and Imaging Sciences Seed Grant*; UNRELATED: Grants/Grants Pending: Radiological Society of North America Research and Education Foundation Resident Research Grant.* Jeremy L. Smith—RELATED: Grant: Georgia State/Georgia Tech Center for Advanced Brain Imaging Neural Engineering Center Seed grant and Emory University Department of Radiology and Imaging Sciences Seed Grant.*; UNRELATED: Consultancy: Bold & Stark LC, Comments: rodent data analysis for Albert Einstein College of Medicine. Julia E. Hurtado—UNRELATED: Employment: Shepherd Center. Russell K. Gore—RELATED: Grant: Shepherd Center, Comments: Georgia State/Georgia Tech Center for Advanced Brain Imaging Neural Engineering Center Seed Grant and Emory University Department of Radiology and Imaging Sciences Seed Grant; funding for imaging and subject reimbursement; I was not compensated for the effort*; UNRELATED: Employment: Shepherd Center, Comments: employed physician; Grants/Grants Pending: Shepherd Center, Comments: Arthur M. Blank Family Foundation Grant.* *Money paid to the institution.
Paper previously presented, in part, at: Annual Meeting of the American Society of Neuroradiology May 18–23, 2019; Boston, Massachusetts.
References
- Received September 3, 2020.
- Accepted after revision November 16, 2020.
- © 2021 by American Journal of Neuroradiology


Jump to section
Related Articles
Cited By...
- No citing articles found.