
Abstract
BACKGROUND AND PURPOSE: An enlarged vestibular aqueduct is the most commonly reported imaging abnormality in children with sensorineural hearing loss. MR imaging is often used to evaluate pediatric sensorineural hearing loss; however, there are no well-established size criteria on MR imaging to diagnose an enlarged endolymphatic duct. The first purpose of the study was to determine a range of normal endolymphatic duct sizes on MR imaging and compare it with that in high-resolution CT. The second purpose was to assess the sensitivity and specificity of MR imaging in diagnosing an enlarged endolymphatic duct in patients with an enlarged vestibular aqueduct on CT.
MATERIALS AND METHODS: Endolymphatic duct midaperture measurements were analyzed in 52 patients with no history of sensorineural hearing loss. Comparison of CT and MR imaging was made in a second cohort of 41 patients with a normal midaperture width on CT. The sensitivity and specificity of MR imaging were then evaluated in a third cohort of 24 patients with a documented enlarged vestibular aqueduct on CT.
RESULTS: In 94 ears, normal endolymphatic duct midaperture measurements ranged from 0 to 0.9 mm on MR imaging. A significant correlation (P <.001) and moderate agreement were found between CT and MR imaging in 81 ears with a normal vestibular aqueduct on CT. Twenty-four patients had bilateral (n = 14) or unilateral (n = 10) enlarged vestibular aqueducts on CT, and the sensitivity and specificity of MR imaging were 97% and 100%, respectively, for a diagnosis of an enlarged endolymphatic duct.
CONCLUSIONS: MR imaging measurements of the normal endolymphatic duct are similar to those established for CT. MR imaging is a useful tool for the diagnosis of enlarged vestibular aqueduct.
ABBREVIATIONS:
- CHARGE
- Coloboma of the eye, Heart defects, Atresia of the choanae, Retardation of growth and/or development, Genital and/or urinary abnormalities, and Ear abnormalities and deafness
- ELD
- endolymphatic duct
- EVA
- enlarged vestibular aqueduct
- HRCT
- high-resolution CT
- SNHL
- sensorineural hearing loss
- VA
- vestibular aqueduct
The most common abnormality reported in the literature in children with sensorineural hearing loss (SNHL) is an enlarged vestibular aqueduct (EVA) as demonstrated on high-resolution CT (HRCT). The abnormality is commonly bilateral, and patients typically present with progressive and, at times, sudden hearing loss. The sudden hearing loss may be related to head trauma, sometimes minor in severity.1 The criteria of an EVA have been revised across time with a normal midaperture width of 1.5 mm on HRCT suggested as a cutoff by Valvassori and Clemis.2 More recently, a cutoff of 1 mm was suggested on the basis of an audiologic and HRCT correlation (Cincinnati criteria), and further reductions in the normal width in the healthy population have been reported with oblique reconstruction planes (Pöschl plane).3,4
There are differing opinions in the literature as to the optimal imaging technique to evaluate children with SNHL. Previous studies have reported decreased sensitivity in diagnosing EVA with MR imaging compared with CT.5 By means of 3D fluid-sensitive sequences, the endolymphatic duct (ELD), which is housed inside the vestibular aqueduct (VA), can be visualized. The endolymphatic sac and associated anomalies of the cochlea and vestibule are demonstrated with increased frequency on MR imaging compared with CT.6 Additionally, MR imaging can determine the status of the cochlear nerve, an important finding for treatment options and the potential for cochlear implantation success.7,8
The purpose of this study was to determine a range of normal midaperture ELD sizes in a large cohort of patients without SNHL, to compare measurements of the normal VA and ELD obtained on both HRCT and MR imaging, respectively, and to evaluate the sensitivity and specificity of MR imaging compared with HRCT in a smaller cohort of patients with EVA, using HRCT as the criterion standard.
MATERIALS and METHODS
This is a retrospective study approved by the institutional review board and Health Insurance Portability and Accountability Act–compliant.
Healthy patients were selected from a group of patients referred for MR imaging evaluation of cholesteatoma. Inclusion criteria were the availability of a diagnostic axial 3D fluid-sensitive sequence (T2 FSE or T2 sampling perfection with application-optimized contrasts by using different flip angle evolution [SPACE sequence; Siemens]) with coverage including the entirety of the membranous labyrinth as well as a temporal bone HRCT. MR imaging was considered diagnostic if the basal turn of the osseous spiral lamina could be discerned. Exclusion criteria were an unavailable audiogram, any degree of SNHL, or a syndrome associated with hearing loss. The presence of conductive hearing loss was not exclusionary and was assumed to be the result of middle ear inflammation and/or cholesteatoma.
A second cohort of patients that had both a diagnostic temporal bone MR imaging and HRCT was then evaluated. The inclusion criterion was the presence of a normal midaperture width of the VA on HRCT. Patients were included regardless of audiogram or SNHL being present, to compare only agreement between the 2 modalities. High-resolution CT and MR imaging measurements were performed in separate sessions approximately 2 weeks apart by a single reader.
In the third cohort, a search of the electronic medical record was performed for patients in whom temporal bone imaging had been performed with both diagnostic MR imaging and HRCT. The presence of any associated relevant syndromes was noted. The temporal bone HRCTs were evaluated for the presence of an EVA, defined as a midaperture width of ≥1 mm. The dataset included patients with bilateral and unilateral enlarged VA. Two subspecialty-certified neuroradiologists with >20 years of experience (T.N.B.) and 6 years of experience (R.L.C.) in interpreting temporal bone imaging studies independently performed midaperture measurements on both HRCT and MR imaging in separate sessions approximately 2 weeks apart. Additionally, the position and subjective size of the tympanic facial nerve were evaluated on HRCT and categorized as normal or abnormal.
All CTs were obtained using a standard temporal bone protocol on a 128-section multidetector CT scanner (Somatom Definition Flash; Siemens). Axial images were obtained parallel to the lateral semicircular canal with 0.6-mm collimation, 0.5- to 1.0-mm thickness, and a 0.3-mm increment, parallel, using a standard bone window algorithm (window/level, 3400–500/500).
All MR imaging examinations were performed on a 1.5T (Achieva, Philips Healthcare; Aera, Siemens) or 3T scanner (Magnetom Skyra; Siemens). VA measurements were made using an axial 3D fluid-sensitive sequence (T2 FSE or T2 SPACE) (1400TR/250TE/2NEX), with coverage including the entirety of the membranous labyrinth. A variable window width and level were used to optimize for evaluation of the VA.
All studies were reviewed on a PACS workstation with a midaperture diameter of the ELD measured using an electronic caliper. Images were magnified 2–3 times depending on the original FOV. The VA/ELD midpoint was determined in the axial plane on both CT and MR imaging as the point half-way between its origin at the labyrinth near the common crus and its opercular edge. If the operculum could not be well-defined, the posterior wall of the petrous bone at the level of the posterior semicircular canal was used as a surrogate. The width was measured as a line perpendicular to the course of the VA/ELD at the midpoint. If the VA and ELD were not visualized, the width was recorded as 0 mm.
Statistical Analysis
In the healthy cohorts, Spearman and intraclass correlations were performed when comparing HRCT with MR imaging measurements, and mean (SD) was calculated for both MR imaging and HRCT. Sensitivity and specificity with confidence intervals for a diagnosis of an enlarged ELD were calculated using a cutoff of a 1-mm midaperture width. Intraclass correlation coefficients were calculated to assess interrater agreement for both HRCT and MR imaging measurements in the third cohort.
RESULTS
The healthy cohort included 52 patients with an age range of 2–17 years (mean, 10.3 years) and a male/female ratio of 2:1. Ninety-four ears had diagnostic MR imaging studies with an audiogram available for review and no documented SNHL. The ELD midaperture diameter ranged from 0 to 0.9 mm (mean, 0.39 [SD, 0.14] mm). Ninety-eight percent of midaperture widths were ≤0.8 mm (Fig 1).

Axial MR imaging shows a normal ELD measuring 0.7 mm at the midaperture (arrow).
The second group with both CT and MR imaging available included 41 patients and 81 ears with an age range of 0.3–15 years (mean, 10.8 years; male/female ratio = 1.3:1). The midaperture width of 81 ears with diagnostic imaging of the temporal bone on both HRCT and MR imaging was measured (a single patient had diagnostic imaging of only 1 ear). VA size on CT ranged from 0 to 0.8 mm (mean, 0.51 mm; 95% measuring ≤0.8 mm). In this same group, the ELD midaperture width measured by MR imaging ranged from 0 to 0.8 mm (mean, 0.36; 95% measuring ≤0.8 mm). A significant correlation was present between measurements on HRCT and MR imaging, with a Spearman correlation of 0.65 (P < .001) (Fig 2). Agreement between the modalities was moderate, with an intraclass coefficient of 0.618 (95% CI, 0.463–0.736). Overall, MR imaging tends to have smaller midaperture ELD widths compared with the VA on HRCT (Fig 3). Many small VAs on HRCT (normal-sized) were not visualized on MR imaging (Fig 4).
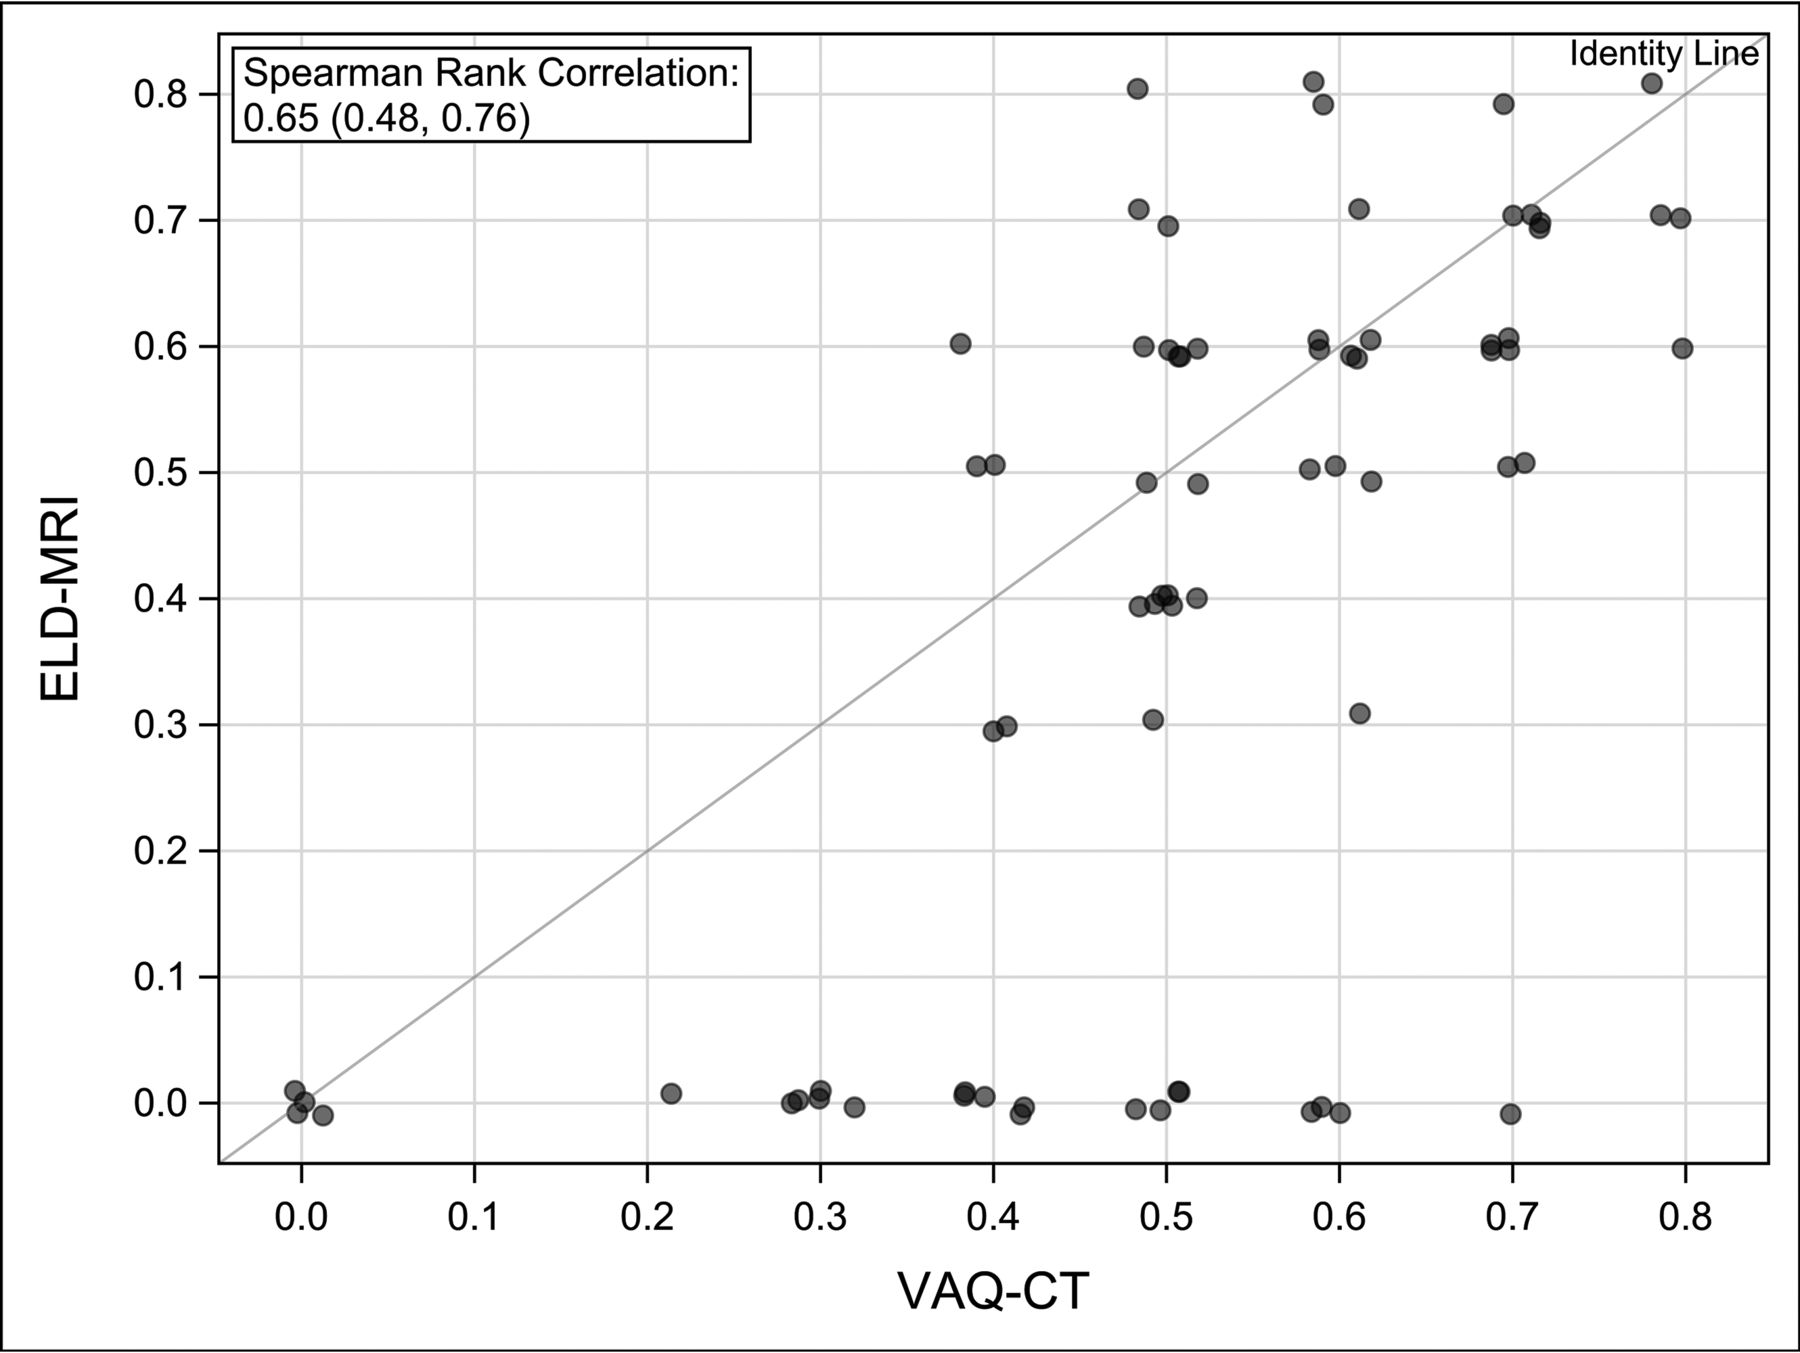
Scatterplot comparing midaperture measurements on CT and MR imaging.

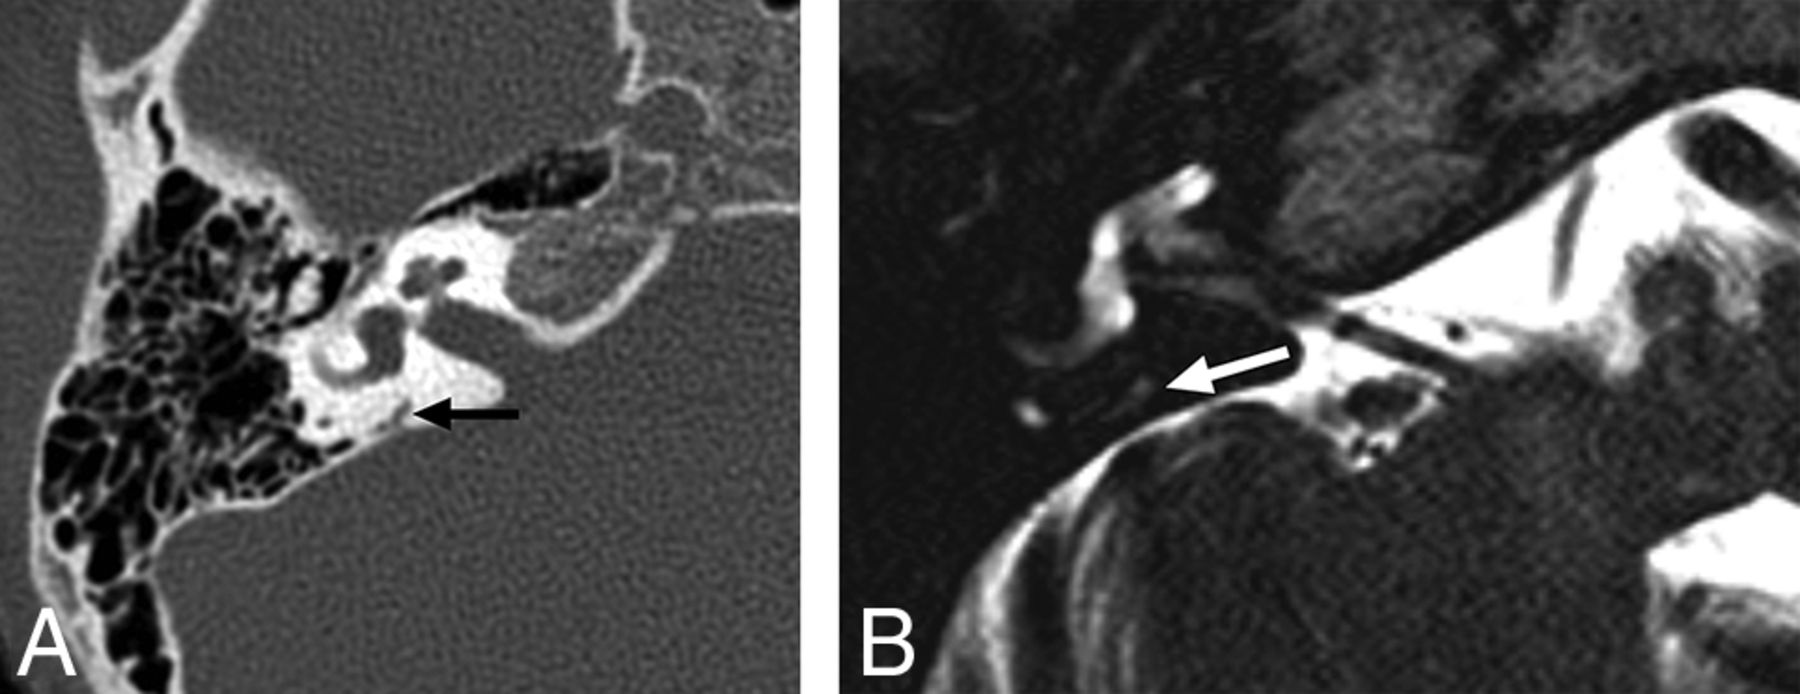
A, Axial HRCT shows a normal VA measuring 0.7 mm (arrow). B, MR imaging in the same patient shows the ELD measuring 0.5 mm (arrow).

A, Axial HRCT shows a normal VA measuring 0.4 mm (arrow). B, MR imaging in the same patient shows nonvisualization of the ELD.
The third group had a diagnosis of EVA on HRCT with a diagnostic MR imaging available for review. This group included 24 patients and 48 ears, with an age range from 0.5 to 15 years (mean, 6.6 years; M/F ratio = 1:1.4). Three patients had a diagnosis of Coloboma of the eye, Heart defects, Atresia of the choanae, Retardation of growth and/or development, Genital and/or urinary abnormalities, and Ear abnormalities and deafness (CHARGE) syndrome. Bilateral EVA was present in 14 patients, and unilateral, in 10, with 38 ears having an EVA on CT (Fig 5). The mean VA size was 1.7 mm, and the median VA size was 1.6, with a range of 0–4 mm. By means of a cutoff of 1-mm midaperture width, only 1 ear was misdiagnosed as normal on MR imaging, with the ELD measuring 0.9 mm on MR imaging compared with the VA measuring 1.6 mm on HRCT (Fig 6). All normal VAs on CT were measured as normal ELDs on MR imaging. With HRCT as the standard, sensitivity for demonstrating an enlarged ELD using MR imaging was 97% (95% CI, 86%–100%) with a specificity of 100% (95% CI, 69%–100%) for the first reader. For the second reader, sensitivity was 89% (95% CI, 75%–97%) and specificity was 90% (95% CI, 56%–100%). Intraclass correlation coefficients calculated for interrater agreement were 0.89 (95% CI, 0.81–0.93) on MR imaging and 0.91 (95% CI, 0.84–0.95) on CT.
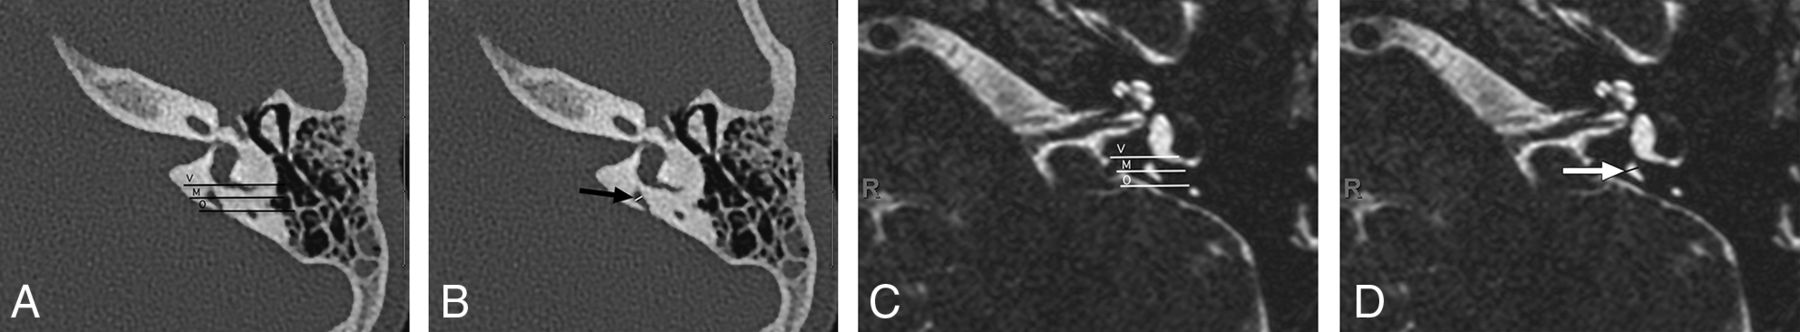
Axial HRCT (A and B) shows the vestibular (V) and opercular (O) planes used to define the VA midpoint (M), and an EVA measuring 1.3 mm (arrow). MR imaging (C and D) in the same patient shows the corresponding vestibular (V), opercular (O), and midpoint (M) planes and an enlarged ELD measuring 1.2 mm (arrow).

Axial HRCT (A and B) shows the vestibular (V) and opercular (O) planes used to define the VA midpoint (M), and an EVA measuring 1.6 mm (arrow). MR imaging (C and D) in the same patient shows the corresponding vestibular (V), opercular (O), and midpoint (M) planes and a normal-sized ELD measuring 0.9 mm (arrow).
All patients with nonsyndromic hearing loss had normally positioned tympanic portions of the facial nerve without surgical implications. Three patients with CHARGE syndrome had abnormal facial nerves with bilateral oval window atresia. All 3 patients had hypoplastic facial nerves with 1 displaced into the oval window in both ears. All facial nerves were difficult to visualize with little confidence in the relation of the facial nerve to the round window.
DISCUSSION
The ability to accurately diagnose EVA in children is important, allowing for appropriate counseling of the patient to avoid contact sports, and detection of associated inner ear anomalies, genetic associations, and other imaging findings that may influence surgical planning for cochlear implantation. Advantages of HRCT include its availability and speed as well as lower cost compared with MR imaging. There is excellent osseous detail for visualization of the VA. It also allows assessment of other structures such as the facial nerve canal, which are not well-evaluated on MR imaging and may have implications for surgical planning. However, the risks associated with the use of ionizing radiation in the pediatric population cannot be ignored. Advantages of MR imaging include a lack of radiation exposure and the ability to directly visualize the endolymphatic duct and sac and, most important, the cochlear nerve using high-resolution volumetric T2-weighted sequences. On the other hand, MR imaging is more costly and time-consuming than CT, often requiring the use of anesthesia or sedation, which comes with additional risks. The decision to use MR imaging versus CT in a patient with suspected EVA must involve all of these factors.
There continues to be debate regarding the diagnostic utility of HRCT versus MR imaging in the evaluation of patients with SNHL and possible EVA. Much of the early research was in support of HRCT as the best imaging technique in this group of patients; however, several more recent studies have suggested an increased role for MR imaging, given the advances in image quality and technology in recent years. Deep et al9 reported a concordance rate of 88% between HRCT and MR imaging in the diagnosis of EVA in 32 patients when both midpoint and opercular measurements were taken into account. However, more cases were detected by CT alone than by MR imaging alone, and in 12% of cases, the ELD was not visualized on MR imaging when a diagnosis of EVA was made by HRCT measurements. A study by Yang and Liu,10 which compared midpoint aperture and opercular measurements on HRCT and MR imaging in 25 patients with EVA and an enlarged ELD, showed that measurements at the midpoint were wider on HRCT than on MR imaging, while measurements at the operculum were wider on MR imaging than on HRCT, suggesting a complementary role of the 2 modalities in diagnosing EVA or an enlarged ELD. Another study by Connor et al,11 which compared CT and MR imaging measurements in 53 subjects, showed 93% agreement between the 2 modalities and no difference in diagnostic ability.
Despite recent studies showing the greater utility of MR imaging, normal ranges for ELD measurements are yet to be established. One study by Dahlen et al,12 in 1997, evaluating 88 ears using MR imaging showed an average midpoint measurement of 0.8 mm and a range of 0.5–1.4 mm. The authors concluded that a midpoint measurement of ≥1.5 mm on MR imaging is abnormal. This finding corresponds well with the cutoff suggested by Valvassori and Clemis,2 but not the more recent cutoff proposed in the Cincinnati criteria. Given the advances in the quality of MR imaging in the decades since that study, further investigation is warranted.
In our cohort of patients with normal HRCT findings and no history of SNHL, the average midaperture ELD measurement on MR imaging was 0.39 mm, with a range of 0–0.9 mm. These values correspond well to the Cincinnati cutoff for HRCT measurements but remain lower than those described by Dahlen et al.12 This difference may reflect the improved resolution of modern MR imaging resulting in mitigation of the “blooming effect,” in which a bright endolymph signal was thought to contribute to an artifactual larger size of the ELD with older MR imaging technology.12
Our study also shows a high degree of correlation of midaperture measurements between CT and MR imaging in subjects with normal VAs on CT, with a Spearman correlation of 0.65. Moreover, in patients with known EVA on CT, MR imaging showed a sensitivity of up to 97% and a specificity of up to 100% for an enlarged ELD. Only 1 case was diagnosed by HRCT alone. The findings for the third cohort also demonstrate a high degree of reproducibility of VA/ELD measurements, with good-to-excellent agreement between the 2 readers.
Some have argued that CT and MR imaging are complementary in cases of suspected EVA or an enlarged ELD because of the additional information supplied by HRCT regarding the course of the facial nerve. In our cohort of 24 patients with documented EVA, 3 were found to have an abnormal facial nerve on HRCT. However, all of these had a diagnosis of CHARGE syndrome and would have undergone HRCT regardless. None of the subjects with nonsyndromic hearing loss had an abnormal facial nerve.
Limitations are primarily centered on the limited number of subjects with EVA who had both CT and MR imaging. An increased number of patients are needed to better determine the sensitivity and equivalency because the lower-margin confidence interval for sensitivity lies below 90%.
CONCLUSIONS
In patients without SNHL, ranges of endolymphatic duct measurements by MR imaging are similar to those of CT of the VA with an upper limit of 0.9 mm (98%). MR imaging tends to underestimate the size of a normal VA. MR imaging was able to diagnose an enlarged VA with a sensitivity of 97% and could potentially be used to make this diagnosis.
References
- Received August 18, 2020.
- Accepted after revision May 2, 2021.
- © 2021 by American Journal of Neuroradiology


