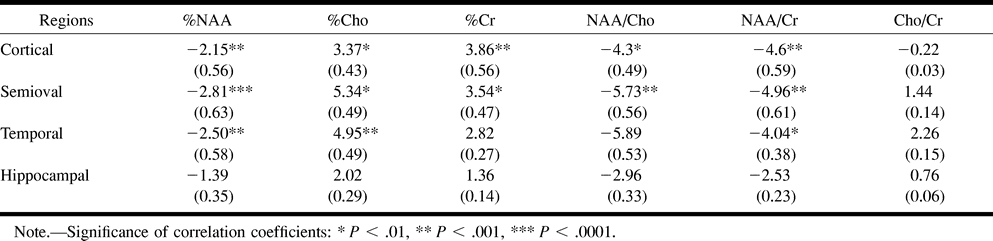
TABLE 1:
Rates (in % of decade) and correlation coefficients (r) of the linear regressions calculated between the metabolite ratios in four cerebral regions and the age of the subjects
Rates (in % of decade) and correlation coefficients (r) of the linear regressions calculated between the metabolite ratios in four cerebral regions and the age of the subjects