


Abstract
Neuroaxonal pathology is a main determinant of disease progression in multiple sclerosis; however, its underlying pathophysiological mechanisms, including its link to inflammatory demyelination and temporal occurrence in the disease course are still unknown. We used ultra-high field (7 T), ultra-high gradient strength diffusion and T1/T2-weighted myelin-sensitive magnetic resonance imaging to characterize microstructural changes in myelin and neuroaxonal integrity in the cortex and white matter in early stage multiple sclerosis, their distribution in lesional and normal-appearing tissue, and their correlations with neurological disability. Twenty-six early stage multiple sclerosis subjects (disease duration ≤5 years) and 24 age-matched healthy controls underwent 7 T T2*-weighted imaging for cortical lesion segmentation and 3 T T1/T2-weighted myelin-sensitive imaging and neurite orientation dispersion and density imaging for assessing microstructural myelin, axonal and dendrite integrity in lesional and normal-appearing tissue of the cortex and the white matter. Conventional mean diffusivity and fractional anisotropy metrics were also assessed for comparison. Cortical lesions were identified in 92% of early multiple sclerosis subjects and they were characterized by lower intracellular volume fraction (P = 0.015 by paired t-test), lower myelin-sensitive contrast (P = 0.030 by related-samples Wilcoxon signed-rank test) and higher mean diffusivity (P = 0.022 by related-samples Wilcoxon signed-rank test) relative to the contralateral normal-appearing cortex. Similar findings were observed in white matter lesions relative to normal-appearing white matter (all P < 0.001), accompanied by an increased orientation dispersion (P < 0.001 by paired t-test) and lower fractional anisotropy (P < 0.001 by related-samples Wilcoxon signed-rank test) suggestive of less coherent underlying fibre orientation. Additionally, the normal-appearing white matter in multiple sclerosis subjects had diffusely lower intracellular volume fractions than the white matter in controls (P = 0.029 by unpaired t-test). Cortical thickness did not differ significantly between multiple sclerosis subjects and controls. Higher orientation dispersion in the left primary motor-somatosensory cortex was associated with increased Expanded Disability Status Scale scores in surface-based general linear modelling (P < 0.05). Microstructural pathology was frequent in early multiple sclerosis, and present mainly focally in cortical lesions, whereas more diffusely in white matter. These results suggest early demyelination with loss of cells and/or cell volumes in cortical and white matter lesions, with additional axonal dispersion in white matter lesions. In the cortex, focal lesion changes might precede diffuse atrophy with cortical thinning. Findings in the normal-appearing white matter reveal early axonal pathology outside inflammatory demyelinating lesions.
Introduction
Neuroaxonal degeneration in multiple sclerosis is a main determinant of disease progression and an important predictor of the clinical outcome (Filippi et al., 2012). Although MRI is essential in the diagnostic work-up and monitoring of disease course and treatment effects in multiple sclerosis, conventional imaging has limited sensitivity to the microstructural changes that accompany the development of neuroaxonal pathology both in the cortex and white matter, before the establishment of irreversible tissue loss (MAGNIMS Study Group, 2015; Filippi et al., 2016).
The temporal dynamics and pathophysiological mechanisms underlying neuroaxonal degeneration in multiple sclerosis are still uncertain. Axonal and neuronal injury could be the consequence of demyelination with loss of trophic support from oligodendrocytes, but also occur in the absence of focal demyelination, in the so-called normal-appearing tissue (Friese et al., 2014). Increasing neuropathological and imaging evidence suggests that these events could start from the earliest disease stages of multiple sclerosis (Kuhlmann et al., 2002; Lucchinetti et al., 2011; Simon, 2012; Louapre et al., 2014; Guttmann et al., 2016). Studies using non-conventional MRI techniques, such as magnetization transfer and diffusion imaging, have indeed demonstrated the presence of pathological changes in the normal-appearing white matter (NAWM) in all disease stages (Guo et al., 2002; Agosta et al., 2006; Vrenken et al., 2007). These techniques are, however, not able to disentangle the heterogeneous processes that characterize multiple sclerosis pathology.
The non-invasive study of cortical demyelination in multiple sclerosis remains a challenge. Advances in neuroimaging have demonstrated that the detection of cortical demyelinating lesions in vivo can be improved through dedicated MRI sequences. Particularly, T2* imaging at ultra-high field strength MRI has been shown to have increased sensitivity for subpial lesions and diffuse demyelination relative to other MRI sequences (Pitt et al., 2010; Jonkman et al., 2016; Kilsdonk et al., 2016). Current knowledge of the frequency, distribution and tissue characteristics of cortical lesion pathology in early disease is, however, limited and ultra-high field strength MRI has not yet been systematically applied in vivo in studies of early multiple sclerosis. Furthermore, although previous pathological and advanced imaging studies have shown that cortical grey matter pathology is a main determinant of the clinical outcome in multiple sclerosis, the temporal occurrence of metabolic, micro- and macro-structural pathology in the cortex has yet to be determined (Chard and Miller, 2009). As the foundations of long-term disability may be laid very early in the clinical course of the disease, the ability to track cortical pathological processes in vivo, from the earliest disease stages, could prove beneficial for improving disease monitoring.
The neuropathological correlates of cortical lesions in early stage multiple sclerosis are also largely unknown. Previous histopathological examinations described transected neurites and apoptotic neurons associated with cortical demyelination, but these observations mostly derived from progressive multiple sclerosis ex vivo samples (Peterson et al., 2001; Bø et al., 2003; Haider et al., 2016). Only one previous study that used biopsies on atypical multiple sclerosis cases at disease onset reported on the presence of cortical demyelinating lesions, including the subpial type, in the earliest disease stages (Lucchinetti et al., 2011). In that work, in addition to demyelination, several cortical lesions showed evidence of neuritic injury, pyknotic neurons, and reduced oligodendrocyte density, all occurring on a background of meningeal inflammation.
The neurite orientation dispersion and density imaging (NODDI) model is a clinically feasible application of recent diffusion MRI models that incorporate multiple shells with different b-values to differentiate between compartments of different length-scales within a voxel. Specifically, NODDI models the water diffusion in three compartments: the free isotropic Gaussian diffusion in CSF or oedema; the hindered anisotropic Gaussian diffusion in the extracellular space; and the restricted anisotropic non-Gaussian diffusion in the intracellular space. NODDI also models the orientation dispersion, inferring information about the underlying orientational coherence or structural integrity of the tissue (Zhang et al., 2012; Colgan et al., 2016). Hence, in contrast to traditional diffusion tensor model metrics (mean diffusivity, fractional anisotropy), the NODDI model allows for biologically specific inference of the microstructural properties of tissues (Assaf et al., 2004, 2008; Sotiropoulos et al., 2012; Zhang et al., 2012).
In this study, we used ultra-high field strength, 7 T T2* imaging and ultra-high gradient strength diffusion MRI with NODDI modelling to characterize, in early stage multiple sclerosis, the extent and microstructural properties of pathology in the cortex and white matter, both in lesional and normal-appearing tissue. We combined these methods with MRI-based myelin imaging (Alonso-Ortiz et al., 2015), which uses the ratio of T1- and T2-weighted images to reduce the effect of field inhomogeneities and obtain a combined myelin-sensitive image contrast (Glasser and Van Essen, 2011; Glasser et al., 2014, 2016).
We hypothesized that demyelination and microstructural neuroaxonal pathology could be detected early in the disease in both the cortex and the white matter. We assessed whether microstructural abnormalities in myelin and neuroaxonal integrity in early stage multiple sclerosis were closely associated in lesional and normal-appearing tissue. In the cortex, we hypothesized that the advanced imaging tools proposed in this study would be more sensitive than conventional diffusion and atrophy assessments in disclosing early cortical microstructural pathology. Finally, we investigated how these different aspects of multiple sclerosis pathology relate to neurological disability.
Materials and methods
Participants and clinical assessments
This prospective cohort study was approved by the local institutional review board and written informed consent was obtained from all participants. General inclusion criteria were: age between 18 and 60 years, absence of significant medical history (other than multiple sclerosis for patients) and of MRI contraindications. Eligibility criteria in patients included a diagnosis of relapsing-remitting multiple sclerosis (Polman et al., 2011; Lublin et al., 2014) with a disease duration ≤5 years in line with Chard and Miller (2009), being on stable disease-modifying treatment or no treatment for at least 3 months, absence of clinical relapse within 3 months and of corticosteroids use within 10 month from study enrolment. We enrolled 50 participants: 26 subjects with early stage multiple sclerosis and 24 age- and gender-matched healthy controls. The demography of the participants is detailed in Table 1. Four healthy controls [one female, three males; mean age 35.3 years, standard deviation (SD) 8.8 years] were recruited for assessing the scan-rescan reproducibility of the diffusion metrics. Physical disability in multiple sclerosis subjects was assessed using the Expanded Disability Status Scale (EDSS) (Kurtzke, 1983).
Demographic and clinical characteristics of early stage multiple sclerosis subjects and healthy controls
| Multiple sclerosis subjects | Healthy controls | |
|---|---|---|
| Gender, n (females/males) | 26 (21/5) | 24 (17/7)† |
| Age, years, mean ± SD | 39.0 ± 8.2 | 37.7 ± 10.6‡ |
| Disease duration, years, mean ± SD | 2.5 ± 1.4 | - |
| EDSS scores, median (range) | 1.5 (0–4) | - |
| Disease-modifying treatments (n) | Dimethyl fumarate (n = 11) | |
| Glatiramer acetate (n = 6) | ||
| Interferon beta-1a (n = 4) | ||
| Natalizumab (n = 1) | ||
| None (n = 4) |
†P = 0.51 versus multiple sclerosis subjects by Fischer’s exact test.
‡P = 0.64 versus multiple sclerosis subjects by unpaired t-test.
SD = standard deviation.
Image acquisition and analysis
The image processing pipeline is detailed below and summarized in Fig. 1.
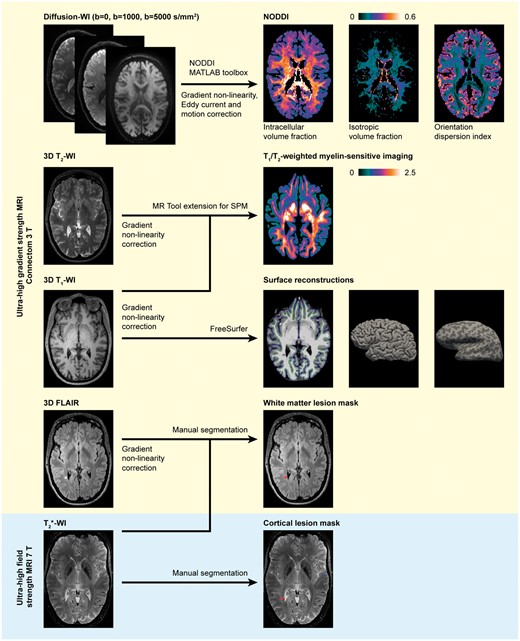
Overview of the image acquisition and processing pipeline. Ultra-high gradient strength MRI processed for NODDI, myelin-sensitive imaging, FreeSurfer reconstruction and lesion masks in a 46-year-old female multiple sclerosis subject with 1.7-year disease duration and an EDSS score of 2. Images presented in the native space for each modality. FLAIR = fluid-attenuated inversion recovery; SPM = statistical parametric mapping; WI = weighted imaging.
Ultra-high gradient strength MRI
All participants were imaged on the 3 T MGH-USC Connectome Scanner (MAGNETOM Skyra CONNECTOM, Siemens Healthcare), using a gradient system that is capable of generating up to 300 mT/m gradient strength (McNab et al., 2013; Setsompop et al., 2013), with a 64-channel head coil (Keil et al., 2013). Multi-shell diffusion-weighted images were acquired using a 2D echo-planar imaging sequence (1.5 mm isotropic voxel size, b-values 1000 and 5000 s/mm2 with 64 and 128 diffusion weighting directions). We applied higher b-values and number of diffusion weighting directions than in the original NODDI protocol, as previous studies have demonstrated that a high b-value and high angular resolution are beneficial for estimating the orientation dispersion index accurately (Zhang et al., 2012; Fick et al., 2016). The choice of b-values was based on the total acquisition time and the capability of the specific scanner to accommodate stronger diffusion weightings and high angular resolution with short echo times, thus reducing signal loss. Anatomical images were acquired using 3D sequences with 1.0 mm isotropic voxel size: T1-weighted multi-echo magnetization-prepared rapid gradient-echo images in all participants (van der Kouwe et al., 2008), T2-weighted images (available in 24 multiple sclerosis subjects and 15 control subjects) and fluid-attenuation inversion recovery (FLAIR) in all multiple sclerosis subjects.
Ultra-high field strength MRI
A Siemens 7 T scanner (MAGNETOM, Siemens Healthcare) with a 32-channel head coil was used for imaging 16 controls and all multiple sclerosis subjects except one due to the presence of metallic implants not approved for 7 T. In these subjects, a 2D single-echo fast low-angle shot spoiled T2* gradient-echo sequence (two slabs covering the supratentorial brain) was acquired at ultra-high resolution (0.33 × 0.33 × 1.0 mm). Further imaging parameters are listed in Supplementary Table 1.
Cortical surface reconstruction
The 3 T T1-weighted images were used for cortical surface reconstructions, cortical thickness measurements and for creating masks of the cortex, white matter and CSF in FreeSurfer (v. 5.3.0, http://freesurfer.net) (Fischl, 2012). Topological surface reconstruction defects caused by white matter and leukocortical lesions were corrected with semi-automatic lesion in-painting in FreeSurfer.
Lesion quantification in cortex and white matter
Lesions were manually segmented using Slicer (v. 4.2.0, https://www.slicer.org) (Fedorov et al., 2012), through the consensus of two experienced raters (C.A.T. and C.M.). Cortical lesions were segmented on 7 T images and classified as intracortical or leukocortical as previously detailed (Louapre et al., 2015). White matter lesions were identified primarily on 3 T FLAIR images with the complementing guidance of 7 T T2* images. Examples of lesion segmentations are shown in Fig. 1. Lesion volumes in both white matter and cortex were quantified using fslstats (FMRIB Software Library, FSL, v. 5.0, Oxford, UK, http://fsl.fmrib.ox.ac.uk/fsl). Prior to assessing cortical lesion volumes, cortical lesion masks from the two 7 T T2* slabs were registered onto the 3 T anatomical Freesurfer reconstructions using a boundary-based registration method as previously detailed (Greve and Fischl, 2009; Mainero et al., 2015).
Diffusion modelling
Diffusion-weighted images were corrected for gradient non-linearities, eddy-current distortions and for subject motion using interspersed non-diffusion weighted images, as previously detailed (Fan et al., 2016). The diffusion preprocessing pipeline applied here has been optimized and tested to assure a satisfying eddy current artefact correction even at high b-values (Fan et al., 2016), and the results are publicly available online (ConnectomeDB, http://www.humanconnectome.org/software/connectomeDB.html and LONI IDA https://ida.loni.usc.edu). After preprocessing, the two-shell high-angular resolution diffusion-weighted volumes were then analysed using the NODDI toolbox (v. 0.9, University College London, London, UK, http://mig.cs.ucl.ac.uk/mig/mig/index.php/?n=Tutorial.NODDImatlab/) (Zhang et al., 2012). In short, a non-linear three-compartment tissue model was fitted to the diffusion-weighted data where signal contribution of the free isotropic Gaussian diffusion in CSF or oedema (isotropic volume fraction) was separated from the hindered anisotropic Gaussian diffusion in the extracellular space and the restricted anisotropic non-Gaussian diffusion in the intracellular space (intracellular volume fraction). The orientational coherence or structural integrity of the tissues was modelled with a Watson distribution, resulting in the orientation dispersion index. To facilitate comparisons with previous studies with traditional diffusion analysis, the tensor model with weighted least squares using the FDT tool in FSL (https://fsl.fmrib.ox.ac.uk/fsl/fslwiki/FDT/UserGuide#DTIFIT) was fitted to the b = 1000 s/mm2 diffusion-weighted data to obtain conventional fractional anisotropy and mean diffusivity measures.
Myelin-sensitive imaging
A method for non-invasive myelin-sensitive imaging was applied where the T1- and T2-weighted sequences were processed to obtain a myelin-sensitive contrast (Glasser and Van Essen, 2011; Glasser et al., 2014), using the MR Tool - Multimodal Mapping extension (v. 1.2, Swiss Federal Institute of Technology, Zurich, Switzerland, http://www.fil.ion.ucl.ac.uk/spm/ext) for Statistical Parametric Mapping 12 (University College London, London, UK, http://www.fil.ion.ucl.ac.uk/spm). Briefly, the processing includes bias correction and rigid registration of the T2-weighted images to the T1-weighted images with linear calibration of image intensity modes using non-brain tissue masks to produce a normalized MRI-based myelin-sensitive imaging contrast that uses the ratio of T1- and T2-weighted images (Ganzetti et al., 2014, 2015).
Analysis of diffusion and myelin-sensitive imaging in white matter and cortex
Individual maps of diffusion-based metrics were registered via their corresponding non-diffusion weighted echo-planar images to the cortical FreeSurfer reconstructions using boundary-based registration with 12 degrees of freedom (Greve and Fischl, 2009). The same tool was used to rigidly register the myelin-sensitive contrasts to the FreeSurfer reconstructions. For the purpose of studying cortical pathology specifically, only the intracortical portion of leukocortical lesions was considered by applying the anatomical cortical mask from FreeSurfer so that only the part of the lesions confined between the grey–white matter border and the pial surface was included (illustrated in Supplementary Fig. 1). To minimize partial volume effects due to the thin and convoluted shape of the cerebral cortex, a surface-based approach was also used where NODDI metrics and myelin-sensitive image intensities were sampled across the whole cortex at mid-cortical depth (50% of the distance between the FreeSurfer pial and white matter surface reconstructions).
Since T1/T2-weighted myelin-sensitive imaging and diffusion metrics are known to differ topographically across the brain (Ganzetti et al., 2014; Glasser et al., 2014, 2016), imaging metrics in cortical and/or white matter lesions were compared with the homologous non-lesioned tissue in the contralateral region. The original T1-weighted images and its right–left inverted ‘mirror’ image were both non-linearly registered to the MNI152 T1-weighted 1 mm brain template (Montreal Neurological Institute, Montreal, Canada, http://www.bic.mni.mcgill.ca/ServicesAtlases/ICBM152NLin2009) using FNIRT in FSL to find the contralateral homologous correspondence, and the non-linear warp fields were concatenated to calculate the masks of the contralateral non-lesioned homologous areas.
Scan-rescan reproducibility of diffusion metrics
Since NODDI is a relatively recent diffusion model and it has yet sparsely been used for clinical applications, the scan-rescan reproducibility of diffusion metrics, both in the cortex and in white matter, was assessed in four healthy volunteers by acquiring the diffusion-weighted scans twice, in the same day, with a short time interval between the two imaging sessions, and with repositioning of subjects. The absolute difference in diffusion metrics was calculated as: |(Scan 1 − Scan 2)|. The within-subject coefficient of variations was estimated, both in the cortex and in the white matter, as the ratio between the standard deviation and the mean of each couple (Scan 1, Scan 2) of measurements. In the cortex, the reproducibility of diffusion metrics was assessed either in the volume space, which was defined as the cortical volume between the white–grey matter boundary and the pial surface, or in the surface-based space, by sampling metrics at mid-cortical depth as previously detailed (Govindarajan et al., 2015).
Statistical analysis
Statistical analysis was performed in IBM SPSS Statistics 23 for Mac (IBM, Armonk, USA). Shapiro-Wilk’s test was used to assess normality. Group differences in nominal data were assessed with Fisher’s exact test, unpaired parametric data using unpaired t-test and unpaired non-parametric data using independent-samples Mann-Whitney U-test. Paired analyses within subjects of lesioned and non-lesioned homologous regions averaged per subject were compared with paired t-test for parametric data and related samples Wilcoxon signed rank test for non-parametric data. Since the lesion count in patients was heterogeneous, intralesional NODDI and myelin-sensitive metrics were averaged per subject. Bivariate correlations were analysed with Pearson correlation for parametric data and Spearman’s rank correlation coefficient for non-parametric data. A two-tailed P < 0.05 was considered statistically significant.
Surface-based group analysis of cortical thickness, NODDI and myelin-sensitive metrics
For surface-based group analyses of cortical thickness, NODDI metrics and myelin-sensitive contrast across the whole cortex, individual surfaces of each metric were registered to a common template surface (fsaverage) and a smoothing kernel of 10 mm full-width at half-maximum was applied. A general linear model was used to assess vertex-wise across the entire cortex: (i) differences in cortical thickness, NODDI metrics and myelin-sensitive contrast between multiple sclerosis subjects and controls; and (ii) associations of cortical thickness, NODDI metrics and myelin-sensitive contrast with EDSS in multiple sclerosis subjects. To mediate any possible partial volume effects caused by atrophy, the surface-based general linear models with NODDI metrics and myelin-sensitive contrast were corrected for the cortical thickness on a per-vertex basis. In all analyses, a correction for multiple comparisons was applied through Monte Carlo null-z simulation with 10 000 iterations and a significance level of P < 0.05.
Results
Cortical thickness and lesions in the cortex and white matter
Lesion counts and volumes in the multiple sclerosis cohort are summarized in Table 2. Cortical lesions were identified in 23 of 25 multiple sclerosis subjects (92%), and in none of the controls. In terms of cortical lesion subtypes, intracortical lesions were found in 17 multiple sclerosis subjects (68%) and leukocortical lesions were also found in 17 multiple sclerosis subjects (68%). The distribution of cortical lesions across the cortex is presented in Fig. 2. Supplementary Fig. 2 shows an example of an early multiple sclerosis subject with a high cortical lesion load. The white matter lesion volume correlated with the leukocortical lesion volume (Spearman’s ρ 0.44, P = 0.026), but not with the intracortical lesion volume (Spearman’s ρ 0.07, P = 0.74). Multiple sclerosis subjects exhibited global cortical thinning relative to controls, but this did not reach statistical significance (2.396 ± 0.08 versus 2.434 ± 0.08 mm, unpaired t-test P = 0.12), and there was also no significant difference in cortical thickness in the surface-based general linear model group comparison.
Lesion counts and volumes in the cortex and white matter of early stage multiple sclerosis subjects
| Median (range) | Mean ± SD | |
|---|---|---|
| Cortical lesion count | 2 (0–39) | 6.0 ± 9.5 |
| Cortical lesion volume | 134 (0–2190) | 289 ± 493 |
| Intracortical lesion count | 2 (0–32) | 4.3 ± 8.0 |
| Intracortical lesion volume | 81 (0–1650) | 194 ± 384 |
| Leukocortical lesion count | 1 (0–7) | 1.6 ± 1.8 |
| Leukocortical lesion volume | 28 (0–738) | 95 ± 175 |
| White matter lesion count | 19 (4–188) | 31 ± 37 |
| White matter lesion volume | 670 (100–5212) | 1098 ± 1306 |
All volumes are given in mm3.
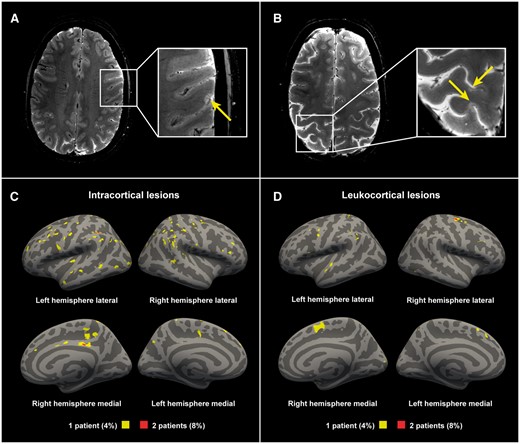
Examples of cortical lesions detected with 7 T T2*-weighted imaging. (A) A 36-year-old female multiple sclerosis subject with a disease duration of 1.8 years, EDSS score of 0; (B) A 45-year-old female multiple sclerosis subject with a disease duration of 2.9 years, an EDSS score of 3. Lesion probability maps of (C) intracortical lesions and (D) the cortical portion of leukocortical lesions in all multiple sclerosis subjects displayed on fsaverage. Yellow indicating lesions in 4% (1 of 25 subjects). Red indicating 8% (2 of 25 subjects) having overlapping lesions (maximum overlap).
Diffusion metrics in cortex and white matter
The diffusion metrics in multiple sclerosis subjects and healthy controls, and P-values from statistical group comparisons are shown in Table 3 and Fig. 3. The scan-rescan reproducibility of diffusion metrics in the cortex and white matter are reported in Supplementary Table 2.
Results from diffusion modelling and myelin-sensitive imaging in the cortex and in the white matter of early stage multiple sclerosis subjects and healthy controls
| Multiple sclerosis lesions | Contralateral normal-appearing tissue | Whole normal- appearing tissue, multiple sclerosis subjects | Whole normal- appearing tissue, controls | |||
|---|---|---|---|---|---|---|
| Cortex | ||||||
| Myelin-sensitive intensity | 1.06 ± 0.176 | 1.17 ± 0.182 | P = 0.030† | 1.09 ± 0.144 | 1.12 ± 0.143 | P = 0.70§ |
| Intracellular volume fraction | 0.408 ± 0.047 | 0.441 ± 0.050 | P = 0.015* | 0.432 ± 0.017 | 0.431 ± 0.015 | P = 0.84‡ |
| Isotropic volume fraction | 0.041 ± 0.077 | 0.025 ± 0.049 | P = 0.78† | 0.089 ± 0.031 | 0.091 ± 0.025 | P = 0.56§ |
| Orientation dispersion index | 0.508 ± 0.078 | 0.525 ± 0.068 | P = 0.30* | 0.544 ± 0.009 | 0.544 ± 0.007 | P = 0.98‡ |
| Fractional anisotropy | 0.186 ± 0.054 | 0.184 ± 0.050 | P = 0.29† | 0.181 ± 0.012 | 0.182 ± 0.006 | P = 0.85§ |
| Mean diffusivity | 0.788 ± 0.087 | 0.730 ± 0.097 | P = 0.022† | 0.795 ± 0.070 | 0.809 ± 0.031 | P = 0.59§ |
| White matter | ||||||
| Myelin-sensitive intensity | 1.32 ± 0.275 | 2.11 ± 0.312 | P = 1.8 × 10⁻⁵† | 2.25 ± 0.380 | 2.55 ± 0.653 | P = 0.25§ |
| Intracellular volume fraction | 0.478 ± 0.057 | 0.655 ± 0.061 | P = 4.8 × 10⁻¹³* | 0.622 ± 0.023 | 0.638 ± 0.027 | P = 0.029‡ |
| Isotropic volume fraction | 0.166 ± 0.069 | 0.151 ± 0.055 | P = 0.32† | 0.108 ± 0.033 | 0.108 ± 0.032 | P = 0.95§ |
| Orientation dispersion index | 0.276 ± 0.033 | 0.259 ± 0.038 | P = 3.0 × 10⁻⁵* | 0.300 ± 0.014 | 0.297 ± 0.015 | P = 0.43‡ |
| Fractional anisotropy | 0.367 ± 0.066 | 0.478 ± 0.081 | P = 8.0 × 10⁻⁶† | 0.439 ± 0.036 | 0.453 ± 0.290 | P = 0.18§ |
| Mean diffusivity | 0.934 ± 0.139 | 0.770 ± 0.119 | P = 9.0 × 10⁻⁶† | 0.714 ± 0.079 | 0.718 ± 0.041 | P = 0.66§ |
Mean ± SD reported. Mean diffusivity reported as µm2/s. *By paired t-test. †By related-samples Wilcoxon signed rank test. ‡By unpaired t-test. §By independent-samples Mann-Whitney U-test.
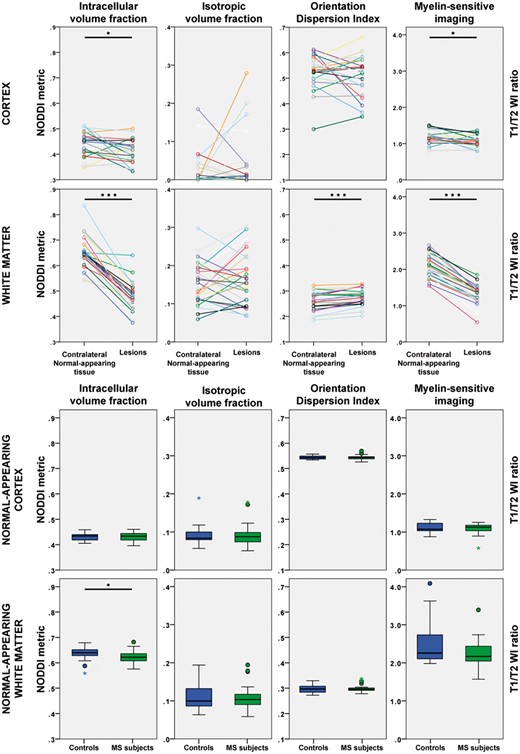
NODDI and myelin-sensitive imaging metrics in the cortex and in the white matter of early stage multiple sclerosis subjects and healthy controls. *P < 0.05; ***P < 0.001. MS = multiple sclerosis; WI = weighted imaging.
Cortical lesions were characterized by significantly lower intracellular volume fraction and higher mean diffusivity than the homologous contralateral non-lesioned cortex. There were, however, no significant differences in diffusion metrics in the normal-appearing cortex of multiple sclerosis subjects compared with the cortex of controls. There was also no significant difference in the surface-based model across the whole cortex with NODDI metrics sampled at mid-cortical depth. There was, interestingly, a notable topographical organization of the NODDI metrics across the cortex in both groups, specifically with clear banding of the metrics around the central sulci, in the sensorimotor cortex (Fig. 4).
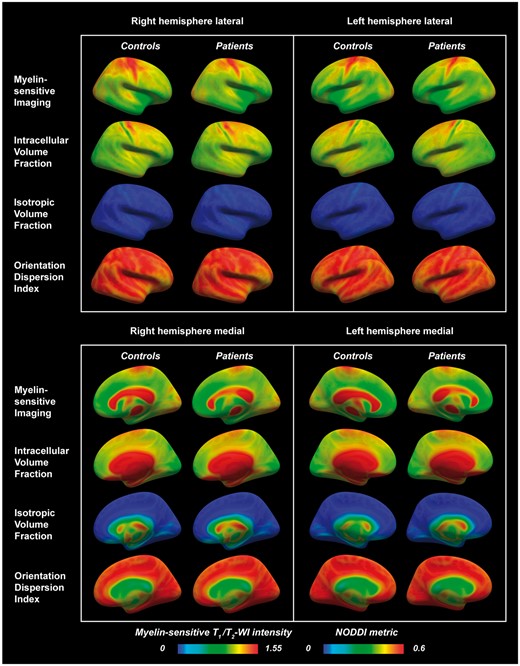
Lateral and medial views in right and left hemispheres of myelin-sensitive imaging and NODDI metrics sampled at mid-cortical depth in multiple sclerosis subjects and healthy controls and displayed on fsaverage. A trend of lower myelin-sensitive contrast in the superior frontoparietal regions was visually noted in multiple sclerosis subjects compared with controls (blue arrows). A notable topographical organization of the NODDI metrics was seen across the cortex, specifically with clear banding of the metrics in the sensorimotor cortices (purple arrows). WI = weighted imaging.
In the white matter, the intracellular volume fraction in lesions was significantly reduced by 27% compared with the contralateral NAWM. White matter lesions were also characterized by increased mean diffusivity, reflecting increased overall diffusion in the tissues. Furthermore, the orientation dispersion index was increased and the fractional anisotropy decreased, indicating less coherent underlying fibre orientation and suggestive of axonal fanning. NODDI also detected diffuse white matter changes, with a significantly lower intracellular volume fraction in the normal-appearing tissue of multiple sclerosis subjects relative to the white matter of control subjects.
Myelin-sensitive imaging in cortex and white matter
The myelin-sensitive imaging results and P-values from statistical group comparisons are presented in Table 3 and visualized in Fig. 3. In the cortex, lesions had significantly reduced myelin-sensitive image contrast compared with the contralateral non-lesioned cortex. There were no significant differences between the myelin-sensitive contrast in the normal-appearing cortex in multiple sclerosis subjects and the cortex in the controls. No significant difference was found in the surface-based comparisons across the whole cortex between multiple sclerosis subjects and controls either. However, as illustrated in Fig. 4, a trend of lower myelin-sensitive contrast in the superior frontoparietal regions was visually noted in multiple sclerosis subjects compared with controls.
In the white matter, lesions had a marked and significant reduction (37%) in the myelin-sensitive contrast, suggestive of reduced myelin content, compared with the contralateral non-lesioned white matter areas. No significant differences were, however, found between the myelin-sensitive contrast in the NAWM of multiple sclerosis subjects and the white matter of controls.
Correlations with neurological disability
In the surface-based general linear modelling, there was a positive association between the orientation dispersion index in the left primary motor and somatosensory cortices and EDSS scores (Fig. 5), which remained significant after correction for multiple comparisons and the cortical thickness on a per-vertex basis. The remaining NODDI metrics, myelin imaging and cortical thickness did not show any significant associations with the EDSS scores.
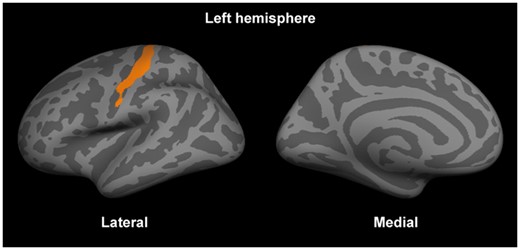
The orientation dispersion index in the primary somatosensory area in the left hemisphere was positively correlated with the expanded disability status scale scores. The significant cluster (after correction for multiple comparisons and the cortical thickness) is displayed on fsaverage.
Discussion
In this study, we combined ultra-high field 7 T and ultra-high gradient strength diffusion MRI along with T1/T2-weighted myelin-sensitive imaging to characterize myelin and neuroaxonal integrity in the brain of early stage multiple sclerosis subjects.
We found that the cortex is commonly affected by focal lesions in early multiple sclerosis (92% of multiple sclerosis subjects) and that myelin-sensitive image contrasts and advanced diffusion modelling can be helpful in characterizing in vivo microstructural tissue changes that accompany early cortical lesion pathology. Current knowledge on the distribution and frequency of focal cortical lesions in early disease stages relies mainly on conventional field strength MRI and sparse ex vivo case studies (Calabrese et al., 2010a; Lucchinetti et al., 2011). At clinical field strengths, dedicated MRI sequences, including double-inversion recovery and phase-sensitive inversion recovery, have shown that cortical lesions can be detected in both clinically and radiologically isolated syndromes at a prevalence of around one-third, with higher frequencies of around two-thirds in more advanced relapse-remitting multiple sclerosis stages (Calabrese et al., 2010b; Giorgio et al., 2011). Histopathologically, cortical demyelination has been found en passant in the biopsy needle trajectory in ∼40% of subjects with atypical multiple sclerosis onset when performing diagnostic biopsies of white matter lesions (Lucchinetti et al., 2011). Previous work has shown that the higher signal-to-noise ratio and resolution achieved at 7 T allows improved cortical lesion delineation in multiple sclerosis, and that the increased T2*-effects at ultra-high field strength can be used to increase the sensitivity to focal and diffuse cortical pathology in the disease (Mainero et al., 2009; Cohen-Adad et al., 2011; Harrison et al., 2015; Louapre et al., 2015; Kilsdonk et al., 2016). In the current study, using T2*-weighted imaging at 7 T MRI, we found that cortical lesions were present in almost all multiple sclerosis subjects, suggesting that ultra-high field MRI can greatly improve the ability to disclose early focal cortical pathology in multiple sclerosis.
The frequency of early focal cortical pathology reported in the current study is higher than that reported in the only neuropathological study of early multiple sclerosis thus far (Lucchinetti et al., 2011). Such a discrepancy may be due to the fact that non-invasive imaging methods allow for examination of the entire brain compared with invasive pathological assessments, which are inherently constrained to local brain tissue sampling. The patient cohorts also differ as we included participants with multiple sclerosis representative of a typical clinical population, while the brain tissue sampling was performed in atypical multiple sclerosis cases that underwent biopsy for diagnostic purposes. Despite the high frequency of focal cortical lesion pathology, cortical thickness measured in our cohort, was not statistically different relative to controls. Cortical thickness measurements obtained in our multiple sclerosis cohort are, however, in line with those reported previously in clinically isolated syndrome and early relapsing-remitting multiple sclerosis (Calabrese et al., 2007, 2015; Steenwijk et al., 2014; Nygaard et al., 2015; Pareto et al., 2015). Overall, our findings emphasize that, especially in small multiple sclerosis cohorts, the use of ultra-high resolution protocols at 7 T can significantly improve the ability to disclose early, focal cortical pathological changes, which can then be targeted with more advanced assessments of microstructural integrity. Our findings, thus, highlight the clinical value of cortical lesion imaging, in line with recent recommendations (Filippi et al., 2016). Interestingly, we found that the leukocortical, but not the intracortical, lesion volume correlated with the white matter lesion volume, suggesting that leukocortical lesions may share common pathological substrates with white matter lesions, while intracortical pathology may be a more independent entity. Similarly, the abovementioned biopsy study has also shown a spatial decoupling of cortical and white matter demyelination in early multiple sclerosis (Lucchinetti et al., 2011).
We used myelin-sensitive imaging and advanced diffusion modelling to characterize in vivo, in the cortex and white matter, microstructural pathological changes related to disruption of myelin and neuroaxonal integrity. In our early multiple sclerosis cohort, we found lower myelin-sensitive contrast in focal lesions in the cortex, and more profoundly so in white matter. Using NODDI modelling, we also measured significant reductions in the intracellular diffusion compartment in both cortical and white matter lesions compared with homologous non-lesioned areas. These results could reflect underlying loss and/or smaller size of neurites. The use of additional diffusion models, such as AxCaliber, could be helpful in disentangling density and diameter quantities, though at the cost of lower robustness (Assaf et al., 2008). However, findings from these models in diseased human tissue need to be confirmed pathologically.
Interestingly, despite the lower intracellular volume fraction, in our multiple sclerosis cohort, cortical lesions did not show any significant difference in the fractional anisotropy relative to the contralateral normal-appearing cortex. This suggests that the lower intracellular volume fraction may be more sensitive than the fractional anisotropy in disclosing early cortical microstructural changes, as previously demonstrated for the white matter (Chung et al., 2016). In our cohort, cortical lesions were also characterized by increased mean diffusivity, which may be a secondary effect to the loss of microstructural integrity and neurites, facilitating free diffusivity, or reflect an increased inflammatory free water component. Previous diffusion studies in multiple sclerosis have reported increased fractional anisotropy, and a few also reported increased mean diffusivity, in cortical lesions (Poonawalla et al., 2008; Calabrese et al., 2011; Filippi et al., 2013; Jonkman et al., 2016; Yaldizli et al., 2016). There are some methodological differences between those studies and ours: (i) we focused on early-stage multiple sclerosis, where cortical pathology may be less pronounced than in more advanced disease stages; (ii) we used high resolution diffusion scans with 2–5 times higher spatial resolution compared to previous studies (Calabrese et al., 2011; Filippi et al., 2012; Yaldizli et al., 2016); and (iii) we delineated cortical lesions using 7 T T2* imaging, which has been shown to exhibit relatively high sensitivity for cortical pathology and may therefore have been able to detect lesions with less severe tissue destruction compared to previous techniques (Mainero et al., 2009; Cohen-Adad et al., 2011; Harrison et al., 2015; Louapre et al., 2015; Kilsdonk et al., 2016). In white matter lesions, lower intracellular volume fraction was accompanied by increased mean diffusivity and orientation dispersion, as well as lower fractional anisotropy, suggesting a combination of demyelination, axonal loss and less coherent fibre orientation such as in axonal bending or fanning in the microenvironment, in agreement with previous histopathological studies of white matter lesions in multiple sclerosis (Schmierer et al., 2007).
We did not find significant group differences in myelin contrast of normal-appearing tissue, neither in the cortex nor in white matter. The intracellular volume fraction measured with NODDI, however, was diffusely lower in the NAWM of multiple sclerosis subjects compared with the white matter of controls. This finding, together with the absence of significant abnormalities in the myelin-sensitive imaging contrast, could be interpreted to reflect the presence of early axonal pathology outside inflammatory demyelinating lesions. It is possible, however, that the T1/T2-weighted imaging may be less specific to myelin in white matter than in the cortex (Arshad et al., 2017), and that subtle inflammation with associated demyelination could also be expected to affect the diffusion modelling (Stikov et al., 2015; Jelescu et al., 2016). Axonal transection could indeed occur within inflammatory demyelination, where it could trigger distal axonal Wallerian degeneration in normal-appearing tissue (Trapp et al., 1998). According to some experimental and pathological studies, however, the pathogenesis of axonal injury in multiple sclerosis may also be independent of inflammatory demyelination (Criste et al., 2014), and reflect the consequence of disturbances in the trophic interactions between oligodendrocytes, microglia and neurons (Trapp and Nave, 2008; Lassmann, 2013).
Our diffusion and myelin-sensitive imaging findings in the cortex highlight the presence of a pathological process that, in the early stages of multiple sclerosis, is more focal than that occurring in the underlying white matter, and predominantly confined to cortical lesions. We previously reported, in another early stage multiple sclerosis cohort (≤3 years disease duration), focal cortical increases in quantitative T2* at 7 T, indicative of underlying myelin and/or iron loss (Mainero et al., 2015). In the current study, the decreased intracellular volume fraction and myelin-sensitive contrast found in cortical lesions relative to homologous normal-appearing tissue suggest the presence of an early reduction in the neurite density along with cortical demyelination. This is in line with pathology reports that described lower neurite, glial and synaptic density in cortical demyelinating lesions in early stage multiple sclerosis (Lucchinetti et al., 2011). Our NODDI results are particularly informative because, unlike traditional diffusion measurements, NODDI takes into account the orientation dispersion in the diffusion property estimates. Additionally, NODDI specifically models the isotropic diffusion, reducing the risk of CSF contributing to the signal. In comparison with previous studies, we acquired high spatial resolution diffusion-weighted images, which also reduces the risk of partial volume contamination with cerebral fluid and white matter. The use of a surface-based method for sampling NODDI metrics and myelin-sensitive contrast at mid-cortical depth also further reduces partial volume effects by accounting for the convoluted shape of the cortex.
The myelin-sensitive imaging method applied in this study has been shown to reflect the distribution of known myelin content across the cortex (Glasser and Van Essen, 2011). A previous histopathological validation demonstrated its sensitivity to cortical demyelination in a small series of multiple sclerosis cases (Nakamura et al., 2016). The method takes advantage of the fact that the T1-weighted signal is positively correlated with myelin and the T2-weighted negatively so, making the ratio of the two weightings more myelin-sensitive. Although this contrast is not an absolute measurement of myelin content, and may also reflect iron content, the distribution of cortical iron co-localizes with the myelin distribution and can therefore be thought to indirectly reflect myelin content (Fukunaga et al., 2010; Glasser et al., 2014). There are other MRI-based measurements of myelin content that may be more specific, but these methods require dedicated, often time-consuming, sequences and the histopathologically validated reference method has limited spatial resolution. The T1/T2-weighted myelin-sensitive imaging applied here has a resolution more feasible for studies of the cortex (Glasser et al., 2016), and is based on sequences recommended for clinical use (Rovira et al., 2015; Traboulsee et al., 2016), thus facilitating clinical applications.
In alignment with previous studies (Glasser and Van Essen, 2011; Ganzetti et al., 2014, 2015; Glasser et al., 2014; Mangeat et al., 2015), we found particularly high myelin-related contrast in the primary motor, somatosensory, visual and auditory areas in both multiple sclerosis subjects and controls. Interestingly, we further observed a clear topographical distribution of all NODDI metrics across the cortex in both groups, especially in the primary somatosensory areas where the precentral gyrus was characterized by higher intracellular volume fraction, reflecting overall large cells/dendrites (Fig. 4). This corresponds well with the known cortical cytoarchitecture, with larger neurons being distributed prevalently in the precentral gyrus compared with the postcentral gyrus where there are more glial cells and fewer large neurons (Henderson et al., 1980). This pattern was accompanied by high orientation dispersion and higher myelin-sensitive contrast in the motor cortex. Taken together, these observations indicate that both T1/T2-weighted myelin-sensitive imaging and NODDI can prove valuable tools to assess myelin and cytoarchitectural integrity in the healthy brain or in neurological disorders (Kamagata et al., 2015; Caverzasi et al., 2016; Glasser et al., 2016; Morris et al., 2016; Calabrese et al., 2017).
In this study, we investigated associations between metrics from ultra-high field and gradient strength MRI with neurological disability in early stage multiple sclerosis. While we did not detect any clinical association with microstructural pathology in focal cortical and white matter lesions or with cortical thickness, we found that increased orientation dispersion index in the left motor cortex correlated with worsening of EDSS. These findings suggest that, for the cortex, the use of more advanced imaging metrics could prove more sensitive than conventional imaging metrics in disclosing associations with clinical outcome metrics, especially in early disease when functional compensatory mechanisms may be in place to counteract initial neuroaxonal pathology (Pantano et al., 2002; Rocca et al., 2002).
This study has some limitations. Application of NODDI modelling in the white matter and in the cortex is still in its infancy, and histopathological MRI correlative studies are further needed to provide a more definite interpretation of our findings, especially in cortical lesions. Nevertheless, these techniques demonstrate to be quite sensitive to the pathological events that occur in the cortex and in the white matter in the early stages of multiple sclerosis. Time-optimized NODDI protocols could facilitate the use of this advanced imaging method in the clinical setting (Zhang et al., 2012). Converting the complex mathematical modelling of NODDI into linear solutions for greatly accelerated processing is also likely to help the dissemination of the technique (Daducci et al., 2015). Newer models that calculate microstructural metrics from signal derivatives, rather than fitting the model directly to the data, could be computationally more efficient, and possibly less biased to the intrinsic diffusivity in brain tissue than NODDI (Kaden et al., 2016; Reisert et al., 2017). However, the applicability of these models in pathological tissues remains to be studied and there are noticeable systematic differences in the results between the models that warrants further comparison.
Due to their good reproducibility, NODDI metrics could also be valuable for studying the neuroaxonal pathology in multiple sclerosis longitudinally. Interestingly, in line with previous studies (Zhang et al., 2012; Chung et al., 2016), we found that, among all NODDI metrics, the smallest diffusion compartment, the isotropic volume fraction, showed the highest variability. Ideally, the spatial resolution of the diffusion weighted images should be reduced even further for cortical analyses. Finally, the first 7 T system approved for clinical use has been recently launched, and this will make ultra-high field MRI more common and available in clinic in the near future. Further work, however, needs to be done in order to improve imaging of cortical lesions, even at 7 T, as previous histopathological-MRI correlative studies reported contrasting prospective and retrospective sensitivities to cortical multiple sclerosis lesions even when using the same magnetic resonance contrast (Pitt et al., 2010; Kilsdonk et al., 2016).
In conclusion, we found that in early stage multiple sclerosis there are frequent microstructural abnormalities in neuroaxonal integrity, which are present focally in the cortex and more diffusively in the white matter. Specifically, the results suggest early demyelination with loss of cells and/or cell volumes in cortical and white matter lesions, with additional axonal dispersion in white matter lesions. In the cortex, focal lesion changes might precede diffuse atrophy with cortical thinning. Findings in the NAWM reveal early axonal pathology outside focal demyelinating lesions. Our study suggests that the combined use of ultra-high field 7 T and gradient strength diffusion MRI with NODDI modelling, along with myelin-sensitive imaging, is a valuable and sensitive method for non-invasive in vivo detection of neuroaxonal pathology in multiple sclerosis. Future studies will extend the use of these techniques in cohorts with progressive disease and investigate, longitudinally, how the observed changes evolve over time.
Acknowledgements
We would like to thank the participants for their commitment. We also thank Stina Englesson for graphical assistance with illustrations and Tanguy Duval for helpful comments during the revision of the manuscript for this study.
Funding
This study was supported by a grant of the National Institute of Health (NIH R01NS07832201 A1). T.G. was supported by Stockholm City Council and Karolinska Institutet (ALF grants 20120213 and 20150166) and the Swedish Society for Medical Research (post-doctoral fellowship). E.H. was supported by the National Multiple Sclerosis Society (fellowship FG-1507-05459). Parts of the control data was obtained from the Human Connectome Project, MGH-USC Consortium (Principal Investigators: Bruce R. Rosen, Arthur W. Toga and Van Wedeen; U01MH093765) funded by the NIH Blueprint Initiative for Neuroscience Research grant; the National Institutes of Health grant P41EB015896; and the Instrumentation Grants S10RR023043, 1S10RR023401, 1S10RR019307.
Supplementary material
Supplementary material is available at Brain online.
Abbreviations
- EDSS
expanded disability status scale
- NAWM
normal-appearing white matter
- NODDI
neurite orientation dispersion and density imaging
References

