


Abstract
Anti-angiogenic therapy with bevacizumab is the most widely used treatment option for recurrent glioblastoma, but therapeutic response varies substantially and effective biomarkers for patient selection are not available. To this end, we determine whether novel quantitative radiomic strategies on the basis of MRI have the potential to noninvasively stratify survival and progression in this patient population.
In an initial cohort of 126 patients, we identified a distinct set of features representative of the radiographic phenotype on baseline (pretreatment) MRI. These selected features were evaluated on a second cohort of 165 patients from the multicenter BRAIN trial with prospectively acquired clinical and imaging data. Features were evaluated in terms of prognostic value for overall survival (OS), progression-free survival (PFS), and progression within 3, 6, and 9 months using baseline imaging and first follow-up imaging at 6 weeks posttreatment initiation.
Multivariable analysis of features derived at baseline imaging resulted in significant stratification of OS (hazard ratio [HR] = 2.5; log-rank P = 0.001) and PFS (HR = 4.5; log-rank P = 2.1 × 10⁻⁵) in validation data. These stratifications were stronger compared with clinical or volumetric covariates (permutation test false discovery rate [FDR] <0.05). Univariable analysis of a prognostic textural heterogeneity feature (information correlation) derived from postcontrast T1-weighted imaging revealed significantly higher scores for patients who progressed within 3 months (Wilcoxon test P = 8.8 × 10⁻⁸). Generally, features derived from postcontrast T1-weighted imaging yielded higher prognostic power compared with precontrast enhancing T2-weighted imaging.
Radiomics provides prognostic value for survival and progression in patients with recurrent glioblastoma receiving bevacizumab treatment. These results could lead to the development of quantitative pretreatment biomarkers to predict benefit from bevacizumab using standard of care imaging.
Glioblastoma is the most common and aggressive primary malignant brain tumor and recurrence is almost inevitable. At recurrence, patients are faced with poor prognosis due to limited treatment options. One widely used treatment for recurrent glioblastoma in the United States is anti-angiogenic therapy with bevacizumab. However, treatment response varies substantially and effective biomarkers for stratification are absent. To this end, we propose an emerging approach, radiomics, that translates standard radiographic images into quantitative data for in-depth analysis of radiographic tumor phenotypes. We applied radiomics to prospective clinical and imaging data from the multicenter BRAIN trial. Our analysis indicates that this approach yields significant prognostic value for OS and PFS at both baseline and follow-up imaging. These results prompt further prospective validation to develop a noninvasive pretreatment biomarker from standard of care medical images for the purpose of objectively predicting treatment response in patients with recurrent glioblastoma treated with bevacizumab.
Glioblastoma remains the most aggressive primary malignant brain tumor, with a median survival time of 15 months and a 5-year survival of ~5% after initial diagnosis.1–3 Despite standard of care therapy, including maximal safe surgical resection, radiotherapy, and temozolomide,4 nearly all patients relapse.5
One commonly used treatment option at recurrence in the US is bevacizumab, an inhibitor of vascular endothelial growth factor developed to block angiogenesis.6 The noncomparative randomized phase II, multicenter, open-label BRAIN trial (AVF3708g) investigating bevacizumab plus irinotecan versus bevacizumab alone7,8 contributed to accelerated FDA approval of bevacizumab (Avastin, Genentech) for treatment of recurrent glioblastoma in 2009. Despite its current US approval for treatment of recurrent glioblastoma, phase II and III clinical trials for patients with recurrent glioblastoma,9,10 as well as 2 recent phase III randomized clinical trials for patients with newly diagnosed glioblastoma,11,12 found no improvement in overall survival (OS) with the addition of bevacizumab to standard therapy.
However, it is reasonable to hypothesize that there may be a patient population with a meaningful clinical benefit, given that the demonstrated activity of bevacizumab evidenced by impact on imaging-based endpoints13–15 and the development of novel biomarkers will be critical to identifying such patients. Imaging biomarkers that could predict response to therapy, have significant prognostic value, or can identify patients unlikely to respond to any therapy would be an extremely valuable tool in this regard.
Radiomics is an emerging field that translates medical images into quantitative data by applying a large set of feature extraction algorithms to characterize tumor phenotype.16–18 Two advantages of radiomics are its noninvasive approach and the ability to evaluate the entire visible tumor and any intratumoral heterogeneity of glioblastoma.18–20 Previous studies have employed a radiomic approach to glioblastoma21–24 reporting prognostic and predictive value of quantitative imaging features; moreover, associations of radiomics with underlying molecular profiles have been suggested.25,26
In this study, we present a radiomic analysis of patients with recurrent glioblastoma treated with bevacizumab. In an independent selection cohort, we identified a set of distinct quantitative imaging features from MRI defining radiographic tumor phenotype. We evaluated these features on prospectively acquired clinical and imaging data from the BRAIN trial, to determine whether there was an association with posttherapy survival and progression at baseline (pretreatment) and at follow-up at week 6 (posttreatment initiation). Hereby, we aimed at assessing whether such a radiomic approach can be valuable for the development of noninvasive biomarkers for risk stratification in this patient population.
Materials and Methods
Study Cohorts
The current study was covered by 13–055 Partners institutional review board (Aerts).
Selection cohort
To independently determine the set of radiomic features that define the radiographic phenotype of a tumor and to avoid false discoveries due to a high-dimensional radiomic feature space, we leveraged a retrospectively collected cohort of 126 nonconsecutive patients at our institution for unsupervised feature selection blinded from clinical data. Patients had pathologically confirmed glioblastoma of at least one recurrence and received bevacizumab either alone or with irinotecan between December 2006 and August 2014 after standard of care treatment, including surgical resection followed by radiotherapy as well as concurrent and adjuvant temozolomide. Further baseline characteristics are detailed in Table 1.
Patient baseline characteristics
| Characteristic | Value in Selection Cohort | Value in BRAIN Cohort |
|---|---|---|
| Median age, y (range) | 57 (24–88) | 56 (23–79) |
| Median KPS (range) | Not available | 80 (70–100) |
| OS, mo | 8.3 | 9.3 |
| PFS, mo | 3.2 | 4.4 |
| Sex | ||
| n female | 48 (38%) | 52 (32%) |
| n male | 78 (62%) | 113 (68%) |
BRAIN trial
Features selected on the selection cohort were retrospectively analyzed on prospectively acquired data from the phase II, multicenter, open-label, randomized, noncomparative BRAIN trial (AVF3708g).7 The trial randomized 167 patients to receive either bevacizumab alone (n = 85) or in combination with irinotecan (n = 82) at one of 10 treatment sites. Patients were enrolled between July 2006 and September 2007, were at least 18 years of age with histologically confirmed contrast-enhancing glioblastoma in first or second relapse, and had failed first-line standard therapy including concurrent radiotherapy and temozolomide. There were at least 8 weeks between completion of radiotherapy and study enrollment. Baseline Karnofsky performance status (KPS) at start of trial was ≥70. Treatment length of the trial was 104 weeks or until progression, death, or discontinuation. Two patients in the BRAIN cohort were treated at our institute and were therefore included in the selection cohort. Further baseline characteristics are detailed in Table 1. Data acquisition was compliant with the Health Insurance Portability and Accountability Act and had received approval of the respective local institutional review boards. Before trial participation, patients provided written informed consent.
Image Segmentation
Selection cohort
Baseline and follow-up MRI were obtained approximately 1 and 6 weeks before and after treatment initiation, respectively. Standard institutional protocol included non-enhancing sagittal and axial postcontrast T1-weighted, axial T2-weighted fast spin echo, axial precontrast enhancing T2-weighted fluid-attenuated inversion recovery (FLAIR), and postcontrast enhanced axial T1-weighted (T1-gadolinium) and 3D spoiled gradient echo imaging with coronal and sagittal reconstructions. The contrast-enhancing agent was gadopentetate dimeglumine (Magnevist, Bayer Healthcare). Scanners used —1.5T and 3T—were manufactured by GE Medical Systems and Siemens. Scanner sequences included spin echo (SE) (75% of total cohort), gradient recalled (GR) (6%), SE/inversion recovery (IR) (6%), and echo planar/SE (4%). Segmentation and normalization were performed as described for the BRAIN cohort.
BRAIN trial
As part of the trial, patients underwent MRI assessment every ~6 weeks on protocol. Postcontrast enhancing T1-weighted and FLAIR images of each study were transferred to offline workstations, and tumor segmentation was performed semi-automatically using thresholding with Slicer 3D27 as in previous studies13,28; these segmentations were edited by a board-certified neuroradiologist (R.H.) with 10 years of experience. The majority of scanners used were GE Medical Systems Signa-Excite (54% of total cohort), Siemens Trio-Trim (18%), Siemens Symphony (9%), and GE Medical Systems Signa-HDx (7%). Scanner sequences included SE (36% of total cohort), IR (28%), and GR (7%).
To reduce the effect of slice thickness variation, all images were resampled to voxels of size 3 × 3 × 3 mm3 (initial dimensions: 1–5 mm in Z direction). For further data normalization, voxel values were discretized with a binwidth of 25 and voxels included in feature extraction were constrained to an intensity value range of 3 standard deviations from the mean. From the total BRAIN cohort, MRIs were available for 165 patients. Specifically, postcontrast T1-weighted and FLAIR imaging was available at baseline for 160 and 152 patients, respectively, and at follow-up for 117 and 133 patients.
Radiomics
For both study cohorts, we extracted 65 quantitative imaging features each from T1 and FLAIR scans at baseline (pretreatment) and follow-up after 6 weeks (posttreatment initiation) using our radiomics pipeline (Fig. 1). These features can be grouped into 3 types: (i) first-order statistics of the voxel intensity histogram, (ii) tumor shape, and (iii) tumor texture. Feature definitions are detailed in Supplementary File S1, Supplementary Table S1, and Supplementary Table S2. In addition to baseline and follow-up, we calculated the percentage difference (delta) of feature values by delta = 100 * (F–B) / B, where B and F are the values at baseline and follow-up, respectively.
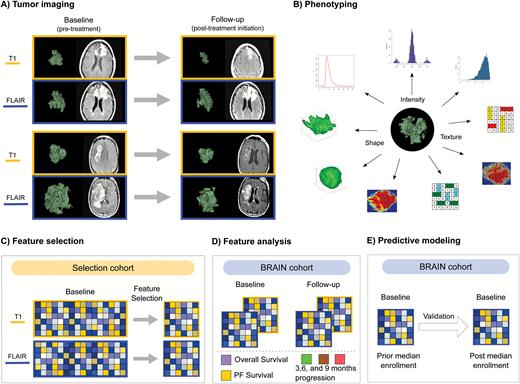
Study design. (A) Patients underwent MRI at baseline (pretreatment) and follow-up at 6 weeks after treatment initiation. Tumors were segmented in 3D on the basis of postcontrast T1-weighted and FLAIR imaging. (B) From each segmentation, the tumor imaging phenotype was defined with radiomics to quantify tumor intensity, shape, and texture features. (C) To avoid multiple-hypothesis testing, we identified a canonical set of representative features with unsupervised feature selection on the selection cohort. (D) These selected features were independently evaluated on the BRAIN cohort to (E) develop prognostic biomarkers of survival and progression, trained and validated on the first and second BRAIN cohort half, respectively.
To reduce dimensionality, we leveraged the selection cohort to focus our analysis on a set of representative features. For this, we implemented an unbiased unsupervised feature selection blinded from clinical information. We performed this selection on baseline features derived from postcontrast T1-weighted and FLAIR imaging separately. First, we applied a principal component (PC) analysis and retained those PCs that accounted for 99% of the total variance in the data. Next, we selected the unique set of features that contributed to all PCs the most (≥0.9 rank correlation) using a factor analysis.29 Mean Spearman rank correlation of a particular feature with all other features was restricted to ≤0.9. From this remaining feature set, the 10 most variant features were selected according to the coefficient of variation. To compare radiomics to traditional radiological assessments, we calculated maximal axial diameter and total tumor volume automatically from the tumor segmentations and added these 2 volumetric size features to our feature set. In summary, we analyzed 12 features derived each from postcontrast T1-weighted and FLAIR images.
Statistical Analysis
The features selected externally from the selection cohort were independently evaluated on the BRAIN cohort. All statistical analyses were carried out with R30 version 3.1.0 on a Linux environment. Details of library versions are given in Supplementary File S2.
Endpoints
We considered OS, progression-free survival (PFS), as well as progression at 3, 6, and 9 months as endpoints. OS was defined as time from treatment start to death.7 PFS was defined in the BRAIN trial as the time from treatment start to progression or death, whichever occurred first.7 Progression at 3, 6, and 9 months correspond to the 6-week scan intervals of the BRAIN trial protocol. Median OS and PFS were 9.3 and 4.4 months, respectively. To cover a comprehensive analysis, prognostic value of our feature set was assessed each for postcontrast T1-weighted and FLAIR imaging at baseline and follow-up, and delta while correcting for multiple-hypothesis testing as described below.
Univariable analysis
We assessed the prognostic value of individual features for OS and PFS with the concordance index (CCI),31,32 which takes time censoring into account. Prognostic value for binary progression at 3, 6, and 9 months was evaluated with the area under the curve (AUC) of the receiver operator characteristic.33
Significances of CCIs and AUCs under the null hypothesis that predictor and outcome variables are not associated (ie, value of 0.5) were tested 2-sided using Noether’s procedure.34P-values for all features derived from postcontrast T1-weighted and FLAIR images were corrected for multiple-hypothesis testing using the false discovery rate (FDR) procedure according to Benjamini and Hochberg.35 Features with corrected significant performance were also tested for direct distributional differences between patients who progressed within 3 months with the 2-sided Wilcoxon rank-sum test.36
To investigate stratification power of individual features, patients were assigned to lower and higher risk groups depending on whether their feature value was higher than the median value across all patients or not. Hazard ratios (HRs) and P-values were calculated using univariable Cox proportional hazards models and one-sided Wald tests of Cox variables, respectively.
Training and validation data
For an unbiased assignment of patients into a training and validation set, we used the median treatment date of the full BRAIN trial cohort. To mimic prospective validation as closely as possible, data from patients treated before the median treatment date were used for training and data from patients with later dates were used for validation. If no treatment date was available, patients were assigned to the training set (n = 4) for more power in fitting. This split resulted in n = 86 and n = 81 patients for training and validation, respectively. From the training (validation) data, nt = 82 (nv = 78), nt = 59 (nv = 58), and nt = 57 (nv = 58) samples were available for postcontrast T1-weighted imaging at baseline, follow-up, and delta, respectively; nt = 80 (nv = 72), nt = 71 (nv = 62), and nt = 69 (nv = 62) samples were available for FLAIR imaging at baseline, follow-up, and delta, respectively.
Multivariable analysis
The univariable analysis indicated strong prognostic value for features derived from postcontrast T1-weighted baseline imaging. To increase this prognostic performance, we aimed at combining individual features in multivariable models. To not overfit our models and to subsequently compare with volumetric and clinical variables, we selected complementary radiomic features with supervised forward feature selection. First, we ranked all 10 radiomic features with the minimal redundancy maximal relevance algorithm37 using the training baseline data. Next, those features were sequentially added into a growing Cox proportional hazards model for PFS or OS starting with the top ranked feature. After each iteration (ie, addition of a feature) the performance was assessed with the CCI and validated with repeated random cross-validation (n = 1000 resamples and 80%/20% split of training data). The final model feature set was obtained by stopping addition of features when the cross-validated mean CCI did not further increase (forward selection). This procedure was performed solely on the training set and selected 2 features for PFS (Gray-level co-occurrence matrix [GLCM] information correlation and GLCM correlation) and 1 feature for OS (GLCM information correlation).
Selected features were used to fit a random-forest classifier (n = 500 trees) on the training set to predict one-year OS, as well as progression at 3, 6, and 9 months. Parameter optimization was done with repeated 5-fold cross-validation (n = 10 repeats) choosing optimal decision tree splits with the one standard error method according to Breiman et al38 using accuracy as evaluation metric. Performance of the fitted models was evaluated with HRs and log-rank tests on the validation set.
For comparison with clinical and volumetric models, the above procedure describing random-forest model building was applied to create a model with age, sex, and KPS, and to create a model with maximal axial diameter and total tumor volume. Performance of radiomic models were compared with these clinical and volumetric models with repeated random permutation tests (N = 1000 resamples) of the CCI differences; P-values were corrected with the FDR.
Results
Identification of an Independent Radiomic Feature Set
To determine the canonical set of features able to comprehend the radiographic characteristics of recurrent glioblastoma on MRI (Fig. 1A–B), we used unsupervised feature selection on a selection cohort (Fig. 1C). This defined a subset of 10 radiomic features derived each from baseline postcontrast T1-weighted and FLAIR images. These features quantify a wider range of intensity, shape, and texture characteristics of a tumor (Supplementary Tables S1 and S2) and were compared to two standard volumetric features (ie, maximal axial diameter and total tumor volume).
This feature set was independently evaluated on the BRAIN trial cohort (Fig. 1D–E). Clustering analysis of radiomic features indicated differences between phenotypic imaging profiles of patients (Fig. 2A). Identified clusters were independent of baseline KPS; mean Spearman rank correlation to KPS was ρ = 0.06 and ρ = 0.13 for postcontrast T1-weighted and FLAIR imaging, respectively. Furthermore, features had only low pairwise correlation (mean absolute Spearman’s ρ = 0.31), even when derived from the same imaging modality, suggesting that these features provide complementary information (Fig. 2B and Supplementary Fig. S1).
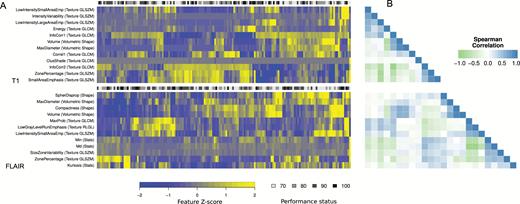
Independence of features. (A) Visualization of features derived from baseline postcontrast T1-weighted (top) and FLAIR imaging (bottom). Values are given as Z-scores and group patients based on hierarchical clustering. (B) Pairwise Spearman rank correlation between all features at baseline imaging. Correlation among features was low, indicating interfeature independence (mean absolute Spearman’s ρ = 0.31).
Verification of Prognostic Value of Individual Features
We evaluated the prognostic value of our feature set for OS and PFS, as well as progression within 3, 6, and 9 months for baseline and follow-up imaging and for the delta between baseline and follow-up (Fig. 3). In general, more features derived from postcontrast T1-weighted than from FLAIR imaging showed significant prognostic value (CCI, Noether FDR < 0.05). At baseline imaging, only those features derived from postcontrast T1-weighted imaging performed significantly.
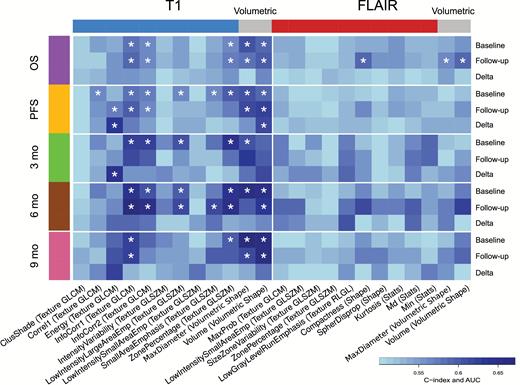
Univariable performances. Prognostic value of features at treatment baseline, 6-week follow-up, and the delta difference of 10 radiomic features for T1 and FLAIR, respectively. Standard volumetric features are shown for comparison. Performances were evaluated with the CCI for OS and PFS, and with the AUC of the receiver operator characteristic for progression at 3, 6, and 9 months. Asterisks indicate significance (FDR < 0.05) after correcting for multiple-hypothesis testing according to Benjamini and Hochberg. Generally, performance of features derived from postcontrast T1-weighted imaging tended to be higher than features derived from FLAIR imaging.
Moreover, distributions of prognostic features were significantly different in patients who progressed at different time points when derived from postcontrast T1-weighted imaging (Supplementary Figure S2). For example, the textural heterogeneity feature information correlation had significantly greater scores for patients who progressed within 3 months (Wilcoxon rank-sum test P = 8.8 × 10⁻⁸). This feature was significantly predictive of all tested endpoints under postcontrast T1-weighted baseline imaging, but performed highest when predicting patients who progressed within 6 months from follow-up imaging (AUC = 0.68, Noether FDR = 0.0019). Furthermore, at baseline imaging this feature significantly stratified patients into high- and low-risk groups of OS (HR = 1.7, Wald test P = 0.0017) and PFS (HR = 1.7, Wald test P = 0.0029). All other features showed lower discrimination at baseline and follow-up imaging.
On the delta between baseline and follow-up imaging, the highest performing feature was energy of the imaging texture for progression within 6 months (AUC = 0.65, Noether FDR = 0.04) with moderate risk stratification power (HR = 0.54, 95% CI = [0.36, 0.82], Wald test P = 0.0037). Further stratification results are detailed in Supplementary Figure S3 and Supplementary Table S3.
Baseline Models of Survival and Progression
To develop pretreatment biomarkers for survival and progression, we assigned patients into a training and validation set based on median treatment date. First, we trained a model to predict one-year OS from baseline postcontrast T1-weighted imaging. As shown in Fig. 4, this model significantly stratified OS of patients from the validation set (HR = 2.5, 95% CI = [1.5, 4.4]; log-rank P = 0.001) after adjusting for age, sex, and KPS, and without adjusting (HR = 2.3, 95% CI = [1.4, 3.8]).
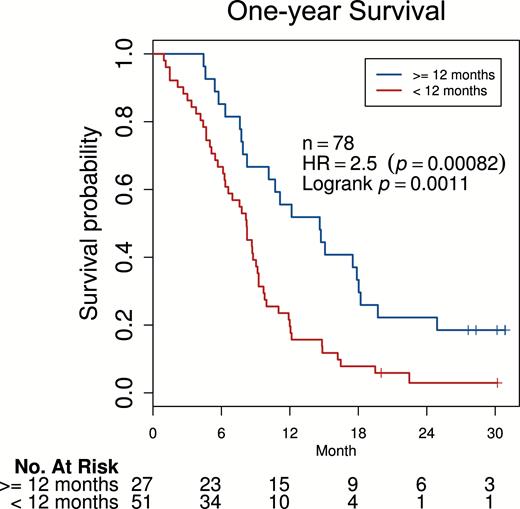
Survival analysis of a multivariable radiomics model for OS. A biomarker with radiomic features was optimized to predict one-year OS. This marker showed significant pretreatment stratification power in discriminating patients at higher and lower risk in validation data held independent of training (HR = 2.5; Wald test P = 8.2 × 10⁻⁴; log-rank P = 0.0011) after adjusting for age, sex, and KPS at baseline.
We trained additional models to predict progression at 3, 6, and 9 months using baseline postcontrast T1-weighted imaging (Fig. 5). These models significantly stratified PFS of patients from the validation set (adjusted; 3 months progression: HR = 2.8, 95% CI = [1.6, 4.8], log-rank P = 5.9 × 10⁻⁴; 6 months progression: HR = 3.8, 95% CI = [2.1, 6.7], log-rank P = 2.1 × 10⁻⁵; and 9 months progression: HR = 4.5, 95% CI = [2.2, 9.2], log-rank P = 3.5 × 10⁻⁵). Sensitivity and specificity for the internal classification of one-year OS, as well as for the classification of 3, 6, and 9 months progression, are reported in Supplementary Table S4. Furthermore, no impact of treatment arm was observed on the performance of these models.
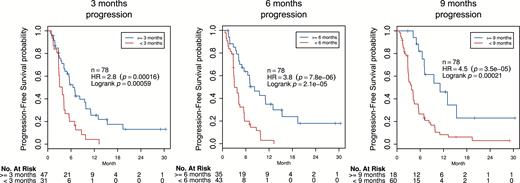
Survival analysis of multivariable radiomics models for PFS. Biomarkers were optimized to predict progression at 3, 6, and 9 months. All models significantly stratified patients in validation data; hazard ratios ranged from 2.8 to 4.5 (Wald test P ≤ 1.6 × 10⁻⁴; log-rank P ≤ 5.9 × 10⁻⁴) after adjusting for age, sex, and KPS at baseline.
All 4 radiomic models performed significantly better (HR permutation test FDR < 0.05) than models of clinical covariates only (ie, age, sex, and KPS) or volumetric features only (ie, maximal diameter and tumor volume). The radiomic models also performed better than models combining clinical and volumetric covariates at slightly lower significance (FDR < 0.09). Stratification was not improved when combining volumetric and radiomic features or combining radiomic features derived from postcontrast T1-weighted and FLAIR imaging (Supplementary Figure S4A and Supplementary Figure S4B, respectively).
Discussion
We present a retrospective radiomic analysis of prospectively acquired data from the BRAIN trial to develop noninvasive quantitative prognostic biomarkers for survival and progression on the basis of standard MRI for patients with recurrent glioblastoma treated with bevacizumab. Our results suggest that a radiomic approach provides prognostic insight about response of these patients, which could lead to further investigation for predictive biomarkers to meet the current need of stratifying patients, as bevacizumab has recently been suggested not to improve OS.11,12,39
Our study provides baseline models for OS of patients, as well as baseline models for progression at 3, 6, and 9 months. On the basis of pretreatment imaging, these models were able to identify patients in the validation set who had more than 4 times the risk to progress within 6 and 9 months throughout the course of treatment. With increasing time point, these models consistently performed better, suggesting that particularly patients who experience progression late can be identified. Furthermore, these models performed substantially better than individual features alone. Importantly, radiomic features in these models were independent of volumetric features and age, sex, and KPS, which were the clinical variables available to us and which are known clinical prognostic factors for glioblastoma2; however, age and sex may be less prognostic for OS than KPS, as has only recently been suggested.40
Consequently, our results could lead to the development of a noninvasive biomarker that would identify patients who are more likely to benefit from bevacizumab even before treatment initiation. However, to determine whether any proposed radiomic biomarker also is predictive of positive treatment outcome, a prospective control arm without anti-angiogenic therapy would be necessary. Alternatively, failure of our model to predict similar endpoints in a non-bevacizumab containing cohort would offer evidence to support a predictive hypothesis. Furthermore, prospective validation of our models in follow-up studies will be required.
Our multivariable analysis included information correlation, which quantifies textural-imaging heterogeneity. Not only did this feature yield significant prognostic baseline value across all tested endpoints, but it also showed higher scores for patients who progressed early, suggesting that textural-imaging heterogeneity is a prognostic factor. Univariable analysis of our full feature set indicated further prognostic candidates; however, all features had significantly less performance compared with our fully trained models. Both our univariable and multivariable analyses indicated that postcontrast T1-weighted imaging data provide more prognostic information than FLAIR imaging, irrespective of investigated time- and endpoints. It remains a difficulty to hypothesize why FLAIR imaging is less prognostic; however, previous studies have documented that tumor volume was not prognostic under FLAIR in recurrent glioblastoma and bevacizumab treatment.41–43 Overall, a general tendency toward higher predictability of PFS was observed, which could be explained by a more clearly defined endpoint than OS, as patients who progressed were discontinued from study treatment and observed for OS. Differences between treatment arms in the BRAIN cohort were not expected and hence data have been pooled, as published previously.8,44,45
Robustness of our results is increased, given that we leveraged 2 independent cohorts to select and evaluate, respectively, our feature set; this limits false discoveries in a high-dimensional approach such as radiomics. Importantly, we blinded the feature selection from clinical data to avoid information leakage and hence increase validity even further. We chose to use our institutional cohort as the selection cohort, as the heterogeneous nature of this retrospective data implies less suitability for fitting models compared with the prospectively acquired BRAIN data. Conversely, our study benefits from evaluation of radiomic features in prospectively acquired clinical trial data of high quality, which includes predefined criteria for patient enrollment, treatment, and follow-up. As this was a multicenter trial with 10 sites, MRI protocols specifying imaging acquisition parameters and equipment have varied across institutions, further highlighting the potential generalizability of our proposed models. Especially for texture-based features we do not expect substantial variability, as those features are generally relative measurements. In these ways, our study advances the results of a recent study indicating prognostic value of radiomics in a retrospectively acquired cohort of patients with recurrent glioblastoma receiving bevacizumab,46 which was also demonstrated by the high performance of our validated models. In addition, we provide further insights into the relationship of intratumoral heterogeneity in imaging and patient survival, as well as comparative analyses of commonly used MRI modalities and measurements of tumor burden.
Other approaches to develop imaging biomarkers were explored in comparable cohorts.8,13,15,47–49 For example, apparent diffusion coefficient histogram analysis has been previously conducted on a subset of the BRAIN cohort totaling 97 patients.48 As radiomics can be applied to standard imaging, complementary value with those approaches could be tested when these data become available. In addition, integration of imaging with biological assays could yield valuable insight into tumor progression50,51 and allow early identification of resistances.52,53 This could also contribute to unraveling the mechanistic connections between radiomics, tumor biology, and clinical outcomes.
In conclusion, we demonstrated the strong prognostic value of radiomics to predict survival and progression of patients with recurrent glioblastoma treated with bevacizumab in prospectively acquired data from the BRAIN trial. Our results could lead to further development of a noninvasive predictive biomarker based on standard of care pretreatment imaging to identify a subpopulation of patients who would benefit from bevacizumab.
Supplementary Material
Supplementary material is available at Neuro-Oncology online.
Funding
Financial support was received from the National Institutes of Health (NIH-USA U01CA190234, NIH-USA U24CA194354, and NIH-USA U01CA140207).
Acknowledgments
Funding sources had no involvement in collection, management, analysis, and interpretation of the data; preparation, review, or approval of the manuscript; and decision to submit the manuscript for publication. The corresponding author had full data access and takes responsibility for the integrity of the data and the accuracy of the data analysis.
Conflict of interest statement. H.J.W.L.A. received financial support from the National Institutes of Health (NIH-USA U01CA190234, NIH-USA U24CA194354, and NIH-USA U01CA140207). D.A.R. reports having served on the advisory boards of AbbVie, Amgen, Bristol Myers Squibb, Cavion, Celldex, EMD Serono, Genentech/Roche, Juno Pharmaceuticals, Merck, Midatech, Inovio, Momenta Pharmaceuticals, Novartis, Novocure, Oxigene, Regeneron, Stemline Therapeutics, outside the submitted work. L.A. is a full time employee at Hoffmann-La Roche. P.Y.W. reports having served as a speaker for Merck, on the advisory board for AbbVie, Cavion, Celldex, Genentech/Roche, Midatech, Momenta, Novartis, Novocure, SigmaTau, Vascular Biogenics, and received research support for Regeneron Pharmaceuticals Inc, Sanofi-Aventis, Karyopharm, GlaxoSmith Kline, Exelixis, Agios, Angiochem, Astra Zeneca, outside the submitted work. L.H.S. served on the advisory boards of Novartis and GSK, received research funding from Eli Lilly, Astellas, Merck, Pfizer, and BI, and has institution patents with Varian. All other authors declare no conflicts of interest.
References
Author notes
Co-senior authors.


