


Abstract
Extensive resections in low-grade glioma (LGG) are associated with improved overall survival (OS). However, World Health Organization (WHO) classification of gliomas has been completely revised and is now predominantly based on molecular criteria. This requires reevaluation of the impact of surgery in molecularly defined LGG subtypes.
We included 228 adults who underwent surgery since 2003 for a supratentorial LGG. Pre- and postoperative tumor volumes were assessed with semiautomatic software on T2-weighted images. Targeted next-generation sequencing was used to classify samples according to current WHO classification. Impact of postoperative volume on OS, corrected for molecular profile, was assessed using a Cox proportional hazards model.
Median follow-up was 5.79 years. In 39 (17.1%) histopathologically classified gliomas, the subtype was revised after molecular analysis. Complete resection was achieved in 35 patients (15.4%), and in 54 patients (23.7%) only small residue (0.1–5.0 cm3) remained. In multivariable analysis, postoperative volume was associated with OS, with a hazard ratio of 1.01 (95% CI: 1.002–1.02; P = 0.016) per cm3 increase in volume. The impact of postoperative volume was particularly strong in isocitrate dehydrogenase (IDH) mutated astrocytoma patients, where even very small postoperative volumes (0.1–5.0 cm) already negatively affected OS.
Our data provide the necessary reevaluation of the impact of surgery in molecularly defined LGG and support maximal resection as first-line treatment for molecularly defined LGG. Importantly, in IDH mutated astrocytoma, even small postoperative volumes have negative impact on OS, which argues for a second-look operation in this subtype to remove minor residues if safely possible.
The recently updated WHO (2016) classification of gliomas is predominantly based on molecular markers and outflanks the previous (2007) classification in terms of prognosis estimation. This requires reevaluation of the role of resection in LGG in different molecular subtypes. In this study we quantitatively assessed pre- and postoperative tumor volume on MRI and combined this with molecular data and detailed clinical annotation. We show that lower postoperative tumor volume is associated with longer OS after correcting for molecular subtype. Also, in IDH mutated astrocytoma we show that even small tumor residues already have negative impact on OS. In oligodendroglioma, this effect appears less convincing. In conclusion, our study adds substantial and necessary evidence to current standard of care for LGG. Our data support current practice of maximal resections as first-line treatment for LGG.
Low-grade gliomas (LGGs; World Health Organization [WHO] grade II]) are primary brain tumors that grow relatively slowly but with a diffuse infiltrative pattern, which makes them impossible to fully eradicate. Recurrences always occur, and despite all advances in the field of oncology, the treatment modalities for LGG remain to be surgery, radiotherapy, and chemotherapy.1,2 The optimum use of these regimens has been controversial for many years, though the use of chemo- and radiotherapy for LGG has been studied in several randomized controlled clinical trials.3–7 The role of surgery has never been investigated in a randomized manner, and it is unlikely that this will ever be, due to ethical reasons in view of the assumptions about equipoise and the duration of such a trial. However, more extensive surgery was associated with an increased overall survival (OS) in several retrospective series.8–13 Unfortunately, interpretation of these studies is not straightforward, due to probable selection bias. For example, the resectability of a brain tumor and the decision to operate depends on its location, size, and delineation: Small and superficially located tumors in non-eloquent areas are more likely to be extensively resected. However, location, eloquency, and size are major prognostic factors by themselves.14 In addition, previous studies were based on the histopathological diagnosis of gliomas, which is subject to a large degree of interobserver variability, particularly for LGG.15 Nowadays, gliomas can also be classified based on a limited set of molecular markers (isocitrate dehydrogenase 1/2 [IDH1/2] gene mutation, chromosome 1p and 19q codeletion), and this classification outperforms the prognostic value of the previous histopathological classification of gliomas.16,17 This molecular approach to glioma diagnosis is now incorporated in the 2016 WHO classification of tumors of the CNS.15,18,19 Since some mutations preferentially manifest in distinct brain regions, the impact of extent of resection in the different molecular subtypes remains to be determined, as well as to what extent previous studies are confounded by this major prognostic factor.20,21 To address this issue, we examined the impact of surgery on OS in molecularly defined LGG in a large retrospective cohort.
Methods
Patient Selection and Clinical Data Acquisition
We studied a cohort of adult patients (age ≥18 y) with supratentorial LGG who underwent a resection or biopsy in one of 2 neurosurgical centers (Erasmus MC Cancer Institute, Rotterdam, the Netherlands [Erasmus MC]; Elisabeth-TweeSteden Ziekenhuis [Hospital], Tilburg, the Netherlands [ETZ]), with tumor material (formalin-fixed paraffin-embedded [FFPE] tissue) available for tissue analysis and pre- and postoperative MR scans (T2-weighted [T2w] and/or T2w fluid attenuated inversion recovery [FLAIR]; either 2D or 3D) available for radiological review. We included only histopathologically confirmed LGG (grade II) diagnosed by a dedicated neuropathologist (J.M.K.). As the extent of resection can be improved with the advent of awake craniotomy for tumors in eloquent areas, the time window of patient inclusion was based on the year of introduction of awake craniotomies in the respective institutes (2003–2016 for Erasmus MC and 2008–2016 for ETZ).22 Patients who underwent their first resection or biopsy in this period were included, even when radiological diagnosis was made before this time window. Patients undergoing only a biopsy were also included, since those samples potentially reflect a distinct subset of patients with tumors that are more difficult to resect and/or have a distinct molecular profile. We excluded patients with WHO grade II histology who had a radiological appearance (extensive tumor enhancement) suggestive of a high-grade lesion. Clinical data were collected from patient records. All included patients were followed until death or censored at the date of last follow-up. Date of death was provided by patient records or the Municipal Personal Records Database. OS was defined as time between date of diagnostic scan and death or censorship. Progression-free survival (PFS) was defined as time between date of first surgical intervention and date of first clinical or radiological progression as indicated by the treating clinician. The database was developed and maintained at Erasmus MC and locked on January 30, 2017. This study was approved by the medical ethics committee of Erasmus MC.
Volumetric Analysis and Acquisition of MRI Characteristics
Pre- and postoperative tumor volumes were assessed in a semiautomatic fashion using the SmartBrush tool in Brainlab Elements (version 2.1.0.15; see Supplementary Figure S1A–C). A 3D volume of interest can be created by first manually segmenting the tumor on one MRI slice of a chosen plane. Then, a second manual segmentation is carried out on one perpendicular slice. Next, the software calculates the full 3D volume of interest, which can be easily manually adjusted where necessary. If available, the T2w-FLAIR sequence (3D where possible) was used for pre- and postoperative volumetric assessment; otherwise, the T2w sequence was used. All T2w and T2w-FLAIR signal abnormalities were included in the segmentations. Within single patients, the same MRI sequence was used for pre- and postoperative analysis. Preferentially, we used the postoperative scan ≥3 months to minimize overestimation of postoperative volume due to postoperative edema or ischemia. Proportion of resection was calculated as (preoperative volume – postoperative volume) / preoperative volume. Localization of tumor in/near eloquent area was assessed using the criteria of Chang et al.14
Mutation Analysis, Copy Number Analysis, and Molecular Classification
We used a targeted next-generation sequencing panel to assess mutational and copy number status as described in detail elsewhere, using an Ion Torrent Personal Genome Machine or Ion S5XL (Life Technologies).16,23 DNA was isolated from selected tissue areas composed of a high percentage of neoplastic cells on 10 µm FFPE sections using Proteinase K digestion in the presence of 5% Chelex 100 resin (Bio-Rad). Telomerase reverse transcriptase promoter mutations (C228T and C250T) were assessed in separate assays (SnaPshot) as described.16
The following criteria for molecular classification were used (consistent with the current WHO 2016 classification for brain tumors):
Oligodendroglioma: IDH1 or IDH2 mutated and loss of heterozygosity consistent with codeletion of the entire 1p and 19q chromosomal arms.
Astrocytoma IDH mutated (IDHmt): IDH1 or IDH2 mutated.
Glioblastoma (GBM)-like: IDH1 or IDH2 wildtype (wt) and telomerase reverse transcriptase promoter mutation without 1p/19q codeletion, or loss of heterozygosity of chromosome 10q and imbalance of chromosome 7, or epidermal growth factor receptor amplified (in the WHO 2016 classification described as astrocytoma IDHwt).18
Statistical Analysis
All primary analyses were carried out according to a predetermined analysis protocol (see Supplementary material); all other analyses are indicated as post hoc. Categorical data were analyzed with Pearson’s chi-square test or Fisher’s exact test when assumptions of the chi-square test were violated (as indicated in the respective tables). A Kruskal–Wallis test was used for continuous data. We used postoperative tumor volume as the primary measure of extent of resection. The same calculations were made using resection percentage as an alternative measure, which can be found in the Supplementary material. Multiple linear regression models were used to explore correlations of molecular subtype with postoperative tumor volume and resection percentage. To meet the assumption of normal distribution of residual errors in multiple linear regression, postoperative volume was log10 transformed, and resection percentage was arcsin square root transformed. To investigate impact of surgery, univariable and multivariable analyses of OS were performed using a Cox proportional hazards model. In this model, pre- and postoperative tumor volumes were treated as continuous variables, and postoperative tumor volume was log transformed to prevent inappropriate weighting of results by very large preoperative tumor volumes. The assumption of proportional hazards was tested based on the scaled Schoenfeld residuals. All calculations were 2-sided tests, with a P-value < 0.05 considered statistically significant. All analyses were performed using R (v3.3.2) and RStudio (v1.0.44) using ggplot2 and CRAN survival packages.24,25
Results
Our initial cohort included 246 patients with confirmed LGG, and with MR scans and FFPE material available. Of these, 18 patients were excluded from analyses: 2 due to insufficient amount of DNA for sequencing, 14 due to sequencing failure, and 2 due to a preoperative radiological appearance suggestive of glioblastoma (both stereotactic biopsy samples, molecularly classified as GBM-like). Two hundred twenty-eight patients were included in final analyses. Median follow-up was 5.79 years (range, 0.3–20.4). Clinical characteristics are shown in Table 1. When comparing histopathological classification with molecular subtype, there was a change of diagnosis in 39 patients (17.1%, mixed oligoastrocytomas not included); all mixed oligoastrocytomas were reclassified according to the WHO 2016 update. There were no significant differences in clinical characteristics between oligodendroglioma and astrocytoma IDHmt, except for age and type of first surgery: Oligodendroglioma patients were significantly older (median age, 45 vs 37 y; P < 0.0001) and type of first surgery was more often a biopsy (P = 0.006). We observed, however, several statistically significantly different characteristics in the GBM-like group. Patients in this group were significantly older (median age, 61 y) and had a different presentation (only 11 [47.8%] patients presenting with epileptic seizures vs 77 [82.8%] and 82 [73.2%] in oligodendroglioma and astrocytoma IDHmt, respectively) and a different tumor localization (more often situated in eloquent areas, N = 16; 69.6%). Interestingly, the majority of GBM-like patients (N = 19; 82.6%) underwent a biopsy, compared with only a small fraction in the oligodendroglioma and astrocytoma IDHmt group (N = 20 [21.5%] and N = 9 [8%], respectively; P < 0.0001). This is also reflected in postoperative tumor volume: Although preoperative tumor volume did not differ between the molecular groups, the postoperative tumor volume was significantly higher in the GBM-like tumors compared with oligodendroglioma and astrocytoma IDHmt (median volumes: 30.0 cm3, 8.0 cm3, and 8.9 cm3, respectively; P = 0.005). Postoperative tumor volume did not differ between oligodendroglioma and astrocytoma IDHmt (P = 0.553). An overview of salvage treatments is shown in Supplementary Table S3 and an overview of surgical outcome is shown in Supplementary Table S4.
Clinical characteristics
| Characteristics | All Patients | Oligodendroglioma | Astrocytoma IDHmt | P * | GBM-like | P** | ||||
|---|---|---|---|---|---|---|---|---|---|---|
| N | % | N | % | N | % | N | % | |||
| Patients (n) | 228 | 93 | 112 | 23 | ||||||
| Sex | 0.119 | 0.078 | ||||||||
| Male | 136 | 59.6 | 48 | 51.6 | 71 | 63.4 | 17 | 73.9 | ||
| Female | 92 | 40.4 | 45 | 48.4 | 41 | 36.6 | 6 | 26.1 | ||
| Age | <0.0001 | <0.0001 | ||||||||
| Median (IQR) | 42 | (34–51) | 45 | (37–52) | 37 | (29–45) | 61 | (52–65) | ||
| <40 | 99 | 43.4 | 32 | 34.4 | 67 | 59.8 | 0 | 0.0 | ||
| 40–60 | 104 | 45.6 | 50 | 53.8 | 43 | 38.4 | 11 | 47.8 | ||
| >60 | 25 | 11.0 | 11 | 11.8 | 2 | 1.8 | 12 | 52.2 | ||
| Presenting symptom | 0.239† | <0.0001† | ||||||||
| Epilepsy | 170 | 74.6 | 77 | 82.8 | 82 | 73.2 | 11 | 47.8 | ||
| Incidental | 24 | 10.5 | 8 | 8.6 | 15 | 13.4 | 1 | 4.3 | ||
| Headache | 8 | 3.5 | 1 | 1.1 | 6 | 5.4 | 1 | 4.3 | ||
| Miscellaneous neurologic complaints | 26 | 11.4 | 7 | 7.5 | 9 | 8.0 | 10 | 43.5 | ||
| Watch-and-wait before first surgery? Yes | 66 | 29.1 | 35 | 38.0 | 28 | 25.0 | 0.064 | 3 | 13.0 | 0.025 |
| Type of first surgery | 0.006† | <0.0001† | ||||||||
| Awake craniotomy | 105 | 46.1 | 50 | 53.8 | 54 | 48.2 | 1 | 4.3 | ||
| Normal resection | 75 | 32.9 | 23 | 24.7 | 49 | 43.8 | 3 | 13.0 | ||
| Open biopsy | 15 | 6.6 | 7 | 7.5 | 2 | 1.8 | 6 | 26.1 | ||
| Stereotactic biopsy | 33 | 14.5 | 13 | 14.0 | 7 | 6.2 | 13 | 56.5 | ||
| Preoperative KPS | 0.055 | <0.0001 | ||||||||
| Median (IQR) | 100 | (90–100) | 100 | (100–100) | 100 | (90–100) | 90 | (85–95) | ||
| 100 | 148 | 64.9 | 71 | 76.3 | 71 | 63.4 | 6 | 26.1 | ||
| 90 | 62 | 27.2 | 17 | 18.3 | 34 | 30.4 | 11 | 47.8 | ||
| ≤80 | 18 | 7.9 | 5 | 5.4 | 7 | 6.2 | 6 | 26.1 | ||
| Histopathological diagnosis | ||||||||||
| Grade II astrocytoma | 112 | 49.1 | 7 | 7.5 | 87 | 77.7 | 18 | 78.3 | ||
| Grade II oligodendroglioma | 86 | 37.7 | 76 | 81.7 | 9 | 8.0 | 1 | 4.3 | ||
| Grade II oligoastrocytoma | 30 | 13.2 | 10 | 10.8 | 16 | 14.3 | 4 | 17.4 | ||
| Molecular diagnosis | ||||||||||
| Oligodendroglioma | 93 | 40.8 | 93 | 100 | 0 | 0.0 | 0 | 0.0 | ||
| Astrocytoma IDHmt | 112 | 49.1 | 0 | 0.0 | 112 | 100.0 | 0 | 0.0 | ||
| GBM-like | 23 | 10.1 | 0 | 0.0 | 0 | 0.0 | 23 | 100.0 | ||
| Tumor location | 0.299† | <0.0001† | ||||||||
| Frontal | 121 | 53.1 | 62 | 66.7 | 58 | 51.8 | 1 | 4.3 | ||
| Parietal | 19 | 8.3 | 8 | 8.6 | 10 | 8.9 | 1 | 4.3 | ||
| Temporal | 37 | 16.2 | 9 | 9.7 | 19 | 17.0 | 9 | 39.1 | ||
| Occipital | 8 | 3.5 | 3 | 3.2 | 4 | 3.6 | 1 | 4.3 | ||
| Insula | 28 | 12.3 | 9 | 9.7 | 19 | 17.0 | 0 | 0.0 | ||
| Basal ganglia | 4 | 1.8 | 0 | 0.0 | 0 | 0.0 | 4 | 17.4 | ||
| Gliomatosis cerebri | 11 | 4.8 | 2 | 2.2 | 2 | 1.8 | 7 | 30.4 | ||
| Eloquent area: yes | 90 | 39.5 | 35 | 37.6 | 39 | 34.8 | 0.786 | 16 | 69.6 | 0.007 |
| Side of lesion | ||||||||||
| Right | 98 | 43.0 | 38 | 40.9 | 52 | 46.4 | 8 | 34.8 | ||
| Left | 118 | 51.8 | 50 | 53.8 | 58 | 51.8 | 10 | 43.5 | ||
| Bilateral | 12 | 5.3 | 5 | 5.4 | 2 | 1.8 | 5 | 21.7 | ||
| Preoperative tumor volume, cm3 | 0.785 | 0.891 | ||||||||
| <25.0 | 66 | 28.9 | 26 | 28.0 | 32 | 28.6 | 8 | 34.8 | ||
| 25.1–50.0 | 54 | 23.7 | 24 | 25.8 | 24 | 21.4 | 6 | 26.1 | ||
| 50.1–100.0 | 67 | 29.4 | 24 | 25.8 | 39 | 34.8 | 4 | 17.4 | ||
| 100.1–250.0 | 38 | 16.7 | 17 | 18.3 | 16 | 14.3 | 5 | 21.7 | ||
| 250.1–351.0 | 3 | 1.3 | 2 | 2.2 | 1 | 0.9 | 0 | 0.0 | ||
| Median (range) | 47.3 | (3.01–350.5) | 46.1 | (4.29– 350.5) | 50.95 | (3.01– 302.8) | 33 | (9.05–213.1) | ||
| Postoperative tumor volume, cm3 | 0.553 | 0.005 | ||||||||
| 0.0 | 35 | 15.4 | 15 | 16.1 | 19 | 17.0 | 1 | 4.3 | ||
| 0.1–5.0 | 54 | 23.7 | 27 | 29.0 | 26 | 23.2 | 1 | 4.3 | ||
| 5.1–15.0 | 41 | 18.0 | 12 | 12.9 | 23 | 20.5 | 6 | 26.1 | ||
| >15.0 | 98 | 43.0 | 39 | 41.9 | 44 | 39.3 | 15 | 65.2 | ||
| Median (range) | 10.95 | (0–263.6) | 8.02 | (0–263.6) | 8.9 | (0–232.7) | 30 | (0–213.1) | ||
| Extent of tumor resection (%) | 0.166 | <0.0001 | ||||||||
| 0–40 | 67 | 29.4 | 28 | 30.1 | 20 | 17.9 | 19 | 82.6 | ||
| 41–89 | 90 | 39.5 | 35 | 37.6 | 53 | 47.3 | 2 | 8.7 | ||
| 90–94 | 22 | 9.6 | 10 | 10.8 | 11 | 9.8 | 1 | 4.3 | ||
| 95–99 | 14 | 6.1 | 5 | 5.4 | 9 | 8.0 | 0 | 0.0 | ||
| 100 | 35 | 15.4 | 15 | 16.1 | 19 | 17.0 | 1 | 4.3 | ||
| Median (range) | 76.1 | (0–100) | 75.4 | (0–100) | 82.5 | (0–100) | 0 | (0–100) | ||
| Treatment after first surgery | <0.0001 | <0.0001 | ||||||||
| Wait and scan | 104 | 45.6 | 51 | 54.8 | 52 | 46.4 | 1 | 4.3 | ||
| Chemotherapy | 35 | 15.4 | 24 | 25.8 | 5 | 4.5 | 6 | 26.1 | ||
| Radiotherapy | 71 | 31.1 | 15 | 16.1 | 42 | 37.5 | 14 | 60.9 | ||
| Chemoradiation | 18 | 7.9 | 3 | 3.2 | 13 | 11.6 | 2 | 8.7 | ||
| Follow-up, y | ||||||||||
| Median (range) | 5.8 | (0.3–20.4) | 7.3 | (0.8–20.4) | 5.7 | (0.3–15) | 2.1 | (0.3–4.7) | ||
*Comparison between oligodendroglioma and astrocytoma IDHmt.
**Three-group comparison (oligodendroglioma vs astrocytoma IDHmt vs GBM-like).
†Fisher’s exact test.
Factors Influencing Postoperative Tumor Volume
We used multiple linear regression to explore which factors influence the amount of postoperative tumor volume. Results are shown in Table 2. Factors such as increasing age, higher preoperative tumor volume (see also Supplementary Figure S2), and insular localization were significantly correlated with a higher postoperative tumor volume (P = 0.002, P < 0.0001, and P < 0.0001, respectively). Tumors located in eloquent areas were also significantly correlated with a higher postoperative volume (P < 0.0001). Interestingly, corrected for the factors mentioned above, the molecular subtype of the tumor did not correlate with postoperative tumor volume. A similar model but using resection percentage instead of postoperative tumor volume is shown in Supplementary Table S1.
Multiple linear regression of factors influencing postoperative tumor volume
| Estimate | SE | t | P | |
|---|---|---|---|---|
| Intercept | 0.307 | 0.134 | 2.291 | 0.023 |
| WHO 2016 classification | ||||
| Oligodendroglioma | * | * | * | * |
| Astrocytoma IDHmt | 0.007 | 0.062 | 0.107 | 0.915 |
| GBM-like | 0.183 | 0.127 | 1.438 | 0.152 |
| Age | 0.008 | 0.003 | 3.064 | 0.002 |
| Preoperative tumor volume | 0.008 | 0.001 | 14.831 | 0.000 |
| Eloquency | ||||
| Eloquent location | * | * | * | * |
| Non-eloquent location | −0.320 | 0.061 | −5.230 | 0.000 |
| Tumor location | ||||
| Frontal | * | * | * | * |
| Parietal | −0.005 | 0.106 | −0.047 | 0.963 |
| Temporal | 0.074 | 0.082 | 0.894 | 0.372 |
| Occipital | 0.078 | 0.151 | 0.515 | 0.607 |
| Insula | 0.482 | 0.086 | 5.577 | 0.000 |
| Basal ganglia | 0.316 | 0.240 | 1.319 | 0.189 |
| Gliomatosis cerebri | 0.161 | 0.157 | 1.027 | 0.305 |
Multiple linear regression model with log10 postoperative tumor volume as dependent variable. * = Reference variable.
Patient Outcome per Molecular Subtype and Extent of Resection
Projected median OS was 13.1 years at a median follow-up of 5.79 years. At time of analysis 69 patients had died and the remaining 159 patients had a median follow-up of 6.3 years (interquartile range [IQR], 3.6–9.6 y). There were no surgery-related mortalities. GBM-like tumors had a significantly shorter median OS (2.1 y) compared with astrocytoma IDHmt (10.2 y) and oligodendroglioma (not reached) (3-group comparison; P = 0.0001, GBM-like vs astrocytoma IDHmt; P = 0.0001, astrocytoma IDHmt vs oligodendroglioma; P = 0.0001) (Supplementary Figure S3). The factors age, Karnofsky performance status (KPS), log preoperative volume, resection percentage, and eloquency were also significantly correlated with OS in univariable analysis (Table 3, Supplementary Table S2).
Univariable and multivariable Cox regression with postoperative volume as measure of extent of resection
| Variable | Univariable | Multivariable | ||||
|---|---|---|---|---|---|---|
| HR | 95% CI | P | HR | 95% CI | P | |
| Age | 1.04 | 1.02–1.06 | 0.0002 | 1.01 | 0.98–1.04 | 0.527 |
| Sex | ||||||
| Male | * | |||||
| Female | 0.68 | 0.41–1.12 | 0.129 | |||
| KPS | 0.94 | 0.91–0.96 | <0.0001 | 1.01 | 0.97–1.06 | 0.666 |
| Eloquency | ||||||
| Yes | * | * | ||||
| No | 0.49 | 0.3–0.79 | 0.004 | 1.59 | 0.90–2.82 | 0.110 |
| Log preoperative volume | 1.66 | 1.22–2.26 | 0.001 | 1.70 | 1.06–2.75 | 0.029 |
| Postoperative volume | 1.01 | 1.005–1.01 | <0.0001 | 1.01 | 1.002–1.02 | 0.016 |
| Molecular diagnosis | ||||||
| Oligodendroglioma | * | * | ||||
| Astrocytoma IDHmt | 3.77 | 1.9–7.46 | 0.0001 | 5.31 | 2.40–11.75 | <0.0001 |
| GBM-like | 112.9 | 45.93–277.55 | <0.0001 | 218.81 | 68.75–696.38 | <0.0001 |
| Radiation after surgery | ||||||
| No | * | * | ||||
| Yes | 2.45 | 1.52–3.94 | 0.0002 | 1.13 | 0.59–2.13 | 0.716 |
| Chemo after surgery | ||||||
| No | * | * | ||||
| Yes | 1.19 | 0.68–2.09 | 0.545 | 0.64 | 0.27–1.52 | 0.315 |
* = Reference category.
In univariable analysis the amount of postoperative tumor volume (as a continuous variable) was significantly associated with OS, with a hazard ratio (HR) of 1.01 per 1 cm3 increase in volume (95% CI: 1.005–1.01; P < 0.0001). A particularly strong effect on OS was seen in patients with no detectable tumor after resection (Fig. 1A). Interestingly, any residual volume negatively affects OS, but this effect was most notable in astrocytoma IDHmt (Fig. 1B, C). In this group, even if residual volume was only 0.1–5.0 cm3, OS was impaired compared with 0.0 cm3 residue. No difference in OS was seen between 5.1–15.0 cm3 and >15.0 cm3 residue. In oligodendroglioma patients, a trend toward better OS with more extensive resection was observed, though the difference in OS benefit of no detectable tumor versus small residues was less impressive than in astrocytoma IDHmt patients. This analysis was not feasible in GBM-like tumors, due to small sample size. A similar pattern was observed when looking at resection percentages rather than postoperative tumor volume (Supplementary Figure S4). PFS stratified by postoperative volume is shown in Supplementary Figure S5, which shows similar patterns. Postoperative tumor volume remained an independent prognostic factor in a multivariable analysis (HR 1.01; 95% CI: 1.002–1.02; P = 0.016; per 1 cm3 increase in volume). Univariable and multivariable Cox regression with resection percentage as measure of extent of resection is shown in Supplementary Table S2.
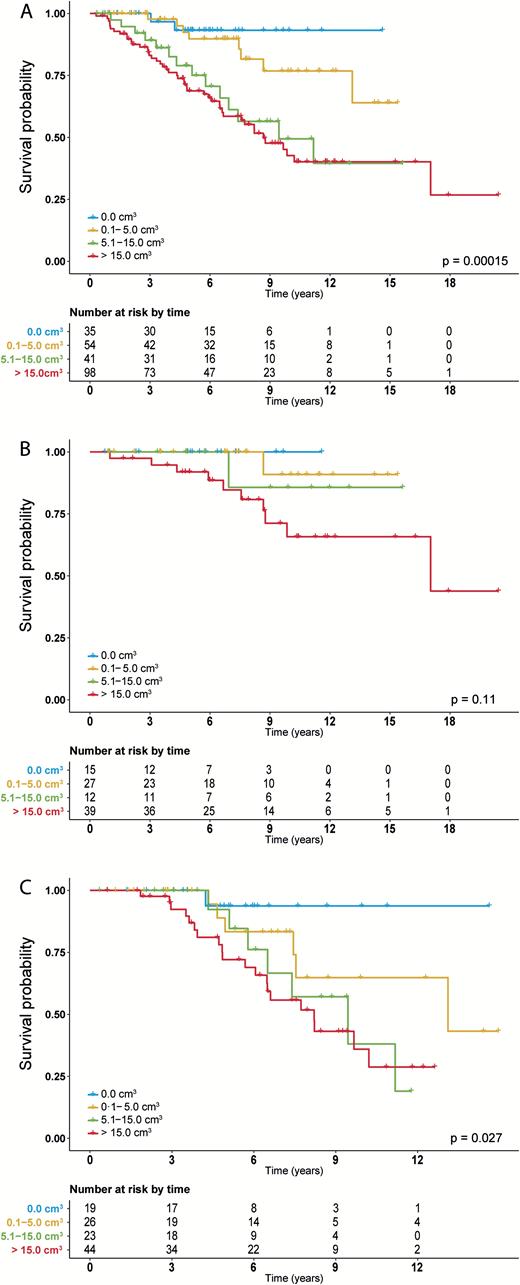
OS stratified by subgroups of postoperative volume for (A) all patients, (B) oligodendroglioma patients, and (C) astrocytoma IDHmt patients.
In a post-hoc analysis, we dichotomized postoperative volume with different cutoffs to explore at what maximal postoperative volume a resection is still associated with improved OS. In astrocytoma IDHmt, a postoperative volume of up to 25 cm3 still showed a significantly longer OS compared with >25 cm3. More importantly, though, any residual tumor (ie, greater than 0.0 cm3) already impacts OS negatively (Fig. 2 and Supplementary Figure S6). In oligodendroglioma patients, such cutoff points for postoperative tumor volume and patient benefit could not be defined (Supplementary Figure S7).
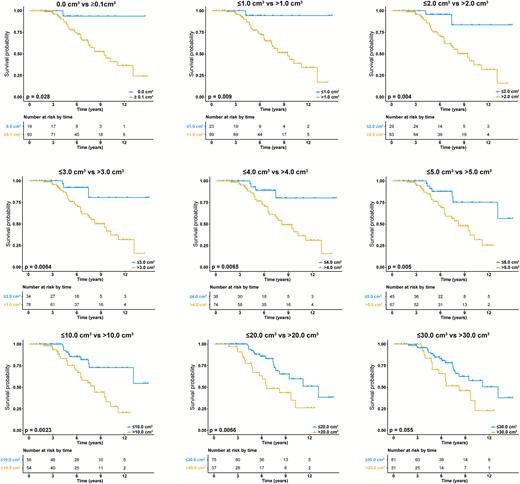
OS in astrocytoma IDHmt stratified by different cutoffs of postoperative tumor volume to explore at what maximal postoperative volume a resection is still beneficial. A postoperative volume of ≤25 cm3 still shows a significantly better OS compared with >25 cm3. However any residual tumor negatively impacts survival. The same figure with more cutoffs is shown in Supplementary Figure S6.
Discussion
With the incorporation of a molecular classification for glioma, WHO classification of tumors of the CNS has been completely revised and molecular markers now overrule the histopathological diagnosis.18,19 Differences in sensitivity and overall outcome to chemo- and/or radiotherapy according to molecular subgroup have emerged in past years, but the assessment of the role of surgery in the molecularly defined subgroups of LGG has been lacking so far. Since the molecular markers in the WHO 2016 update are prognostically very powerful, a reevaluation of the impact of surgery is important to validate and evaluate current clinical practice.
Several studies have suggested that early and extensive surgery has a positive impact on survival for LGG patients. Unfortunately, most of these studies used qualitative measures for extent of resection or used tumor diameter to calculate tumor volume.9–13,26,27 These approaches do not allow accurate assessment of extent of resection. A recent report by Cordier et al incorporated volumetric measurements in a large molecularly defined LGG cohort.28 The authors showed that resectability was independent of molecular markers; however, survival data were not reported. One report that used a volumetric approach and included survival analysis was the study by Smith et al.8 These authors showed that a larger extent of resection predicts significantly longer OS and that even small postoperative tumor volumes negatively influence OS. Their 2008 study, however, was based on histopathologically diagnosed LGG (WHO 2007) without molecular classification. A recent paper by Wahl et al reported on the impact of postoperative tumor volumes on OS corrected for molecular subtype.29 Every 10-cm3 increase in postoperative tumor volume was associated with shorter OS. However, definite conclusions cannot be drawn, since this was an exploratory, post-hoc analysis in a selected cohort of 71 patients with only significant residual disease after first surgical treatment.29
In this study we show that postoperative volume remains a prognostic factor for OS in molecularly defined LGG. This is an important finding, since it supports the policy of maximal safe resection in all molecular subtypes of LGG. Our data also show that even very small tumor residues already negatively impact OS in astrocytoma IDHmt tumors. This is exemplified by the clear survival difference between tumor residues as little as 0.1–5.0 cm3 and 0.0 cm3, and the absence of a survival difference between 5.1–15.0 cm3 and >15.0 cm3 residue. Also, in a post-hoc analysis with dichotomization of postoperative volume we show that up to 25 cm3 residue is still associated with a significantly better OS compared with >25 cm3. Since this is a post-hoc analysis, we should interpret this specific cutoff value with caution. More importantly, though, this analysis shows that any residual tumor (ie, greater than 0.0 cm3) already impacts survival negatively in astrocytoma IDHmt. In oligodendroglioma it seems that a small residue does not have the strong impact on OS as is observed in astrocytoma IDHmt. The absence of a strong relationship between OS and limited amounts of residual tumors might be explained by the more indolent natural course of these tumors and their increased sensitivity to treatment, which may have more impact on survival than surgical intervention.19,30 Although residual tumor probably is located in eloquent areas in the majority of cases, small tumor remnants can have important clinical consequences: One may argue that a second-look operation if safely possible might be something to consider in the few astrocytoma IDHmt patients with minor residual tumor located in non-eloquent areas. It should be noted, however, that our analysis is retrospective in nature, and clinical implication urges confirmation in independent series. On the other hand also, our data encourage further efforts to implement new methods that aid in safely maximizing extent of resection, to avoid a second-look surgery. Imaging techniques like intraoperative MRI and ultrasound to assess extent of resection during surgery might be valuable in this setting. At present, these techniques are not available in most clinics, however.
Our data suggest that some of the findings in previous studies may have been impacted by the presence of GBM-like tumors, which were more likely to undergo a biopsy only in this series. This might be explained by the more frequent location of GBM-like tumors in eloquent areas (N = 16; 69.6%) and thus a higher frequency of biopsy or limited resections.
Our study has limitations that need to be addressed. The main limitation is the retrospective nature. However, due to ethical and practical reasons, a randomized trial on the impact of timing and extent of resection is considered not feasible, and retrospective data with detailed clinical and molecular annotation are the best available to address this issue.31 Clearly, the preoperative volume of LGG has a major impact on outcome, and this also influences the postoperative volume. A larger series is necessary to further study this. Due to the retrospective nature of this study, the follow-up, postoperative treatment, and MRI protocol used were heterogeneous. We corrected OS for administration of chemo- and/or radiotherapy, but correcting for different timing and sequence of these treatments is not informative due to the large variety of possible combinations. T2w-FLAIR sequences were not available for both pre- and postoperative measures for some patients. When this was the case, T2w images were used. We used the late postoperative scan to minimize overestimation of postoperative tumor volume due to edema or ischemia and to minimize potential differences between sequences.32 Also, nonstandardized MRI follow-up limits the reliability of evaluation of PFS in terms of the importance of the extent of resection. Another important limitation that comes with the retrospective nature of this study is the inclusion based on histology. This has to be taken into account when generalizing results, since histology is only known after surgery.
Also, several recent studies have shown that final conclusions in studies on LGG require lengthy follow-up for definitive conclusions.33 Further follow-up and, more importantly, expanding this dataset is very important. This especially concerns the oligodendroglioma group, since the impact of small tumor residues in this commonly slow-growing tumor might become more clear with longer follow-up. Lastly, confirmation of our findings in an independent dataset is needed before definitive clinical conclusions are drawn.
In conclusion, we validated and added substantial and necessary evidence to current practice of early maximal resection for LGG. Importantly, we show that even very small tumor residues in astrocytoma IDHmt patients already have negative impact on OS. Although this finding needs to be validated in independent series, in patients’ best interests a second-look operation with this molecular subtype should at least be considered when a small residue remains that can be safely resected.
Supplementary Material
Supplementary material is available at Neuro-Oncology online.
Funding
This work was not supported by any external funding.
Conflict of interest statement. M.J.v.d.B. reports personal fees from Roche, personal fees from Novartis, personal fees from Blue Earth Diagnostics, grants and personal fees from Abbvie, personal fees from Actelion, personal fees from BMS, personal fees from MSD, outside the submitted work. M.S. reports personal fees as independent reviewer for Parexel Inc. All other authors declare no competing interests.
References


