Article Text

Abstract
Objective Computational fluid dynamics (CFD) simulations of intracranial aneurysm hemodynamics usually adopt the simplification of the Newtonian blood rheology model. A study was undertaken to examine whether such a model affects the predicted hemodynamics in realistic intracranial aneurysm geometries.
Methods Pulsatile CFD simulations were carried out using the Newtonian viscosity model and two non-Newtonian models (Casson and Herschel-Bulkley) in three typical internal carotid artery saccular aneurysms (A, sidewall, oblong-shaped with a daughter sac; B, sidewall, quasi-spherical; C, near-spherical bifurcation). For each aneurysm model the surface distributions of shear rate, blood viscosity and wall shear stress (WSS) predicted by the three rheology models were compared.
Results All three rheology models produced similar intra-aneurysmal flow patterns: aneurysm A had a slowly recirculating secondary vortex near the dome whereas aneurysms B and C contained only a large single vortex. All models predicted similar shear rate, blood viscosity and WSS in parent vessels of all aneurysms and in the sacs of B and C. However, large discrepancies in shear rate, viscosity and WSS among predictions by the various rheology models were found in the dome area of A where the flow was relatively stagnant. Here the Newtonian model predicted higher shear rate and WSS values and lower blood viscosity than the two non-Newtonian models.
Conclusions The Newtonian fluid assumption can underestimate viscosity and overestimate shear rate and WSS in regions of stasis or slowly recirculating secondary vortices, typically found at the dome in elongated or complex-shaped saccular aneurysms as well as in aneurysms following endovascular treatment. Because low shear rates and low WSS in such flow conditions indicate a high propensity for thrombus formation and rupture, CFD based on the Newtonian assumption may underestimate the propensity of these events.
- Casson model
- Herschel-Bulkley model
- non-Newtonian
- wall shear stress
- shear rate
- viscosity
- blood rheology
- thrombosis
- aneurysm
- artery
- blood flow
- vessel wall
- brain
- tumor
- spine
- thrombectomy
- catheter
Statistics from Altmetric.com
- Casson model
- Herschel-Bulkley model
- non-Newtonian
- wall shear stress
- shear rate
- viscosity
- blood rheology
- thrombosis
- aneurysm
- artery
- blood flow
- vessel wall
- brain
- tumor
- spine
- thrombectomy
- catheter
Introduction
Intracranial aneurysms (IAs) are pathological dilations of arterial walls that affect approximately 2–5% of the entire population.1 ,2 Ruptured IAs cause subarachnoid hemorrhage and its sequelae, resulting in significant morbidity and mortality.3–5 Hemodynamic stresses such as wall shear stress (WSS, the tangential frictional stress caused by the action of flowing blood on the vessel wall endothelium) have been shown to play an important role in IA pathophysiology of initiation and rupture.6–9 To this end, computational fluid dynamics (CFD) has been widely used to obtain patient-specific flow fields in IAs to assess potential risk of rupture.8–12
CFD simulations often involve simplifying assumptions of blood properties and boundary conditions. One of the commonly adopted simplifications in large vessels is the Newtonian fluid model which prescribes a linear shear stress-strain rate relationship (constant viscosity) for blood. Although such a linear relationship represents blood behavior at high shear rates, the non-Newtonian effect becomes appreciated at low shear rates because viscosity increases with decreasing shear rate.13 The inherent non-Newtonian characteristics of blood result from the formation of rouleaux or aggregates of red blood cells under low shear conditions.13
Although traditionally the Newtonian fluid assumption for blood has been adopted in CFD simulations of large vessels (such as arteries hosting aneurysms),14 ,15 the validity of such simplification has not been tested for calculations of aneurysmal hemodynamics in which the results are interpreted to relate to IA pathophysiology. For example, previous studies have shown that regions of low WSS in the aneurysm sac are associated with IA rupture8 ,9 ,11 as well as thrombus formation.16 In such regions the blood is relatively stagnant and is therefore subjected to lower shear rates than in the parent vessel. We suspected that, in these low WSS regions, the non-Newtonian effects might not be negligible.
The objective of this study was to test the sensitivity of blood flow field, shear rate and WSS predictions using different blood rheology models in different types of patient-specific aneurysm geometries. We aimed to determine whether modeling based on the Newtonian assumption can closely represent non-Newtonian models in typical IA geometries, particularly in complex geometries that may be associated with an increased risk of thrombosis or rupture.
Methods
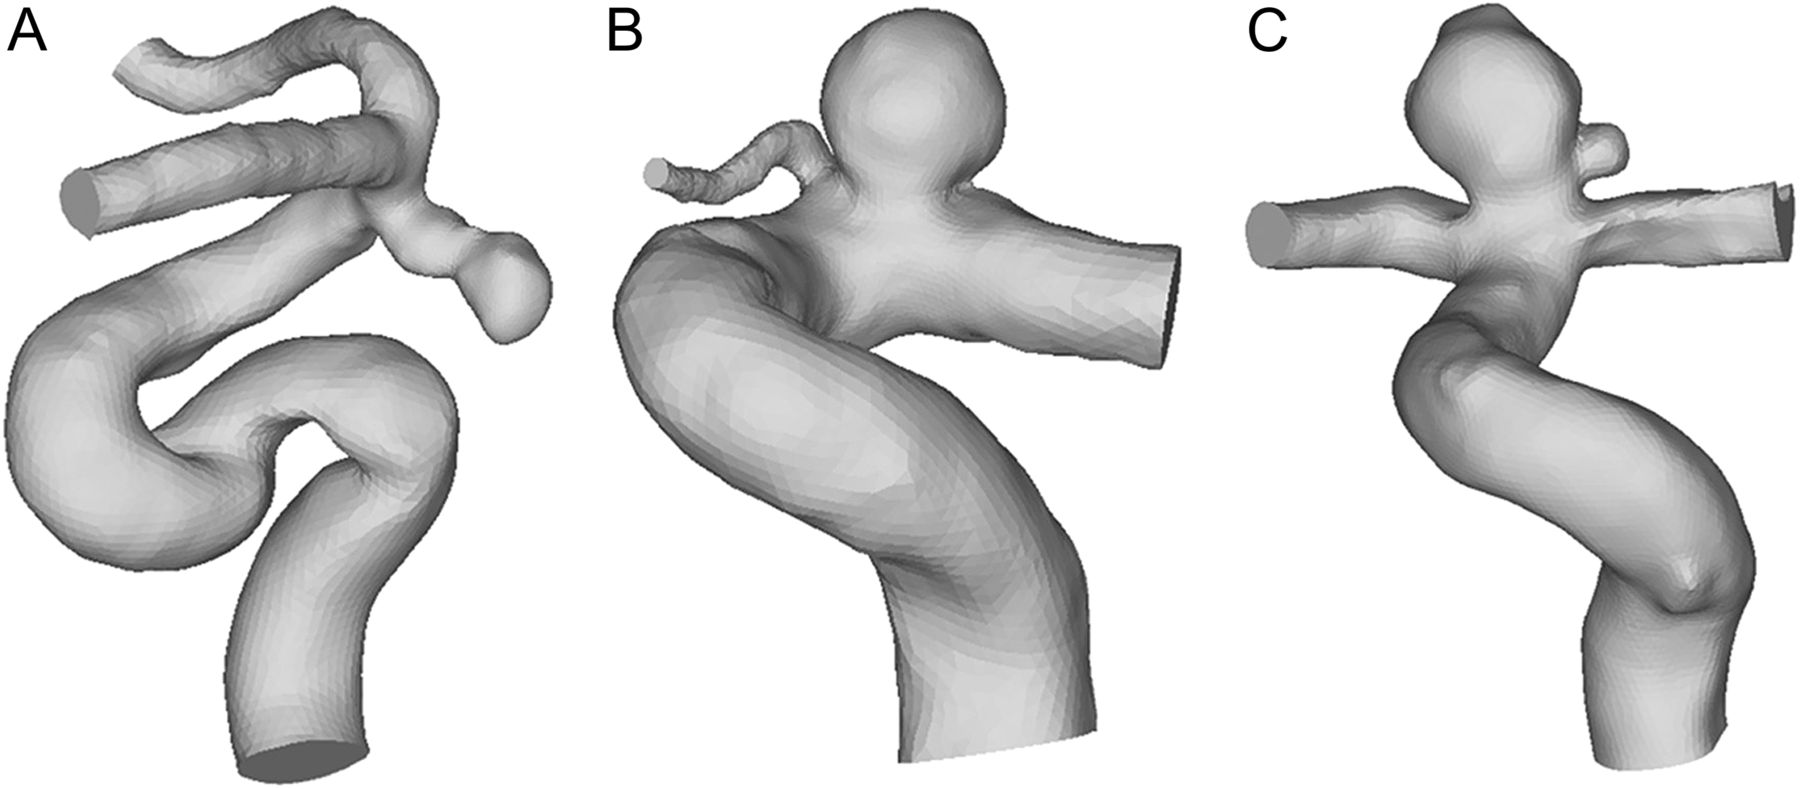
Three cases of internal carotid artery (ICA) aneurysms (identified as aneurysms A, B, and C (figure 1) were selected from the study by Dhar et al 17 for the present study. Aneurysm A (ruptured, in a 45-year-old woman) was a sidewall aneurysm with an irregular oblong shape and a daughter sac; aneurysm B (unruptured, in a 68-year-old woman) was a sidewall aneurysm with a quasi-spherical shape; and aneurysm C (unruptured, in a 66-year-old man) was a near-spherical bifurcation aneurysm. In the present study, sidewall aneurysms were defined as lesions emanating off the side of the parent vessel with or without a very small vascular branch, and bifurcation aneurysms were defined as those located at major bifurcations in the cerebral vessel.11 ,18 Three-dimensional angiography images of the patients' aneurysms were obtained with a Toshiba Infinix VFi/BP frontal C-arm system (Toshiba America Medical Systems, Tustin, California, USA). Three-dimensional images of the ICA were then reconstructed in surface-triangulation format using in-house software based on the open-source Visualization Tool Kit libraries, as previously described.17

Three patient-specific internal carotid artery aneurysm models used in this study: aneurysm A, a sidewall aneurysm with an irregular oblong shape and a daughter sac; aneurysm B, a sidewall aneurysm with a quasi-spherical shape; aneurysm C, a near-spherical bifurcation aneurysm.
Two widely applied non-Newtonian fluid models for blood, the Casson and Herschel-Bulkley (H-B) models, were used for the CFD simulations of the geometric ICA aneurysm models in this study, along with the usual Newtonian fluid model.16 The mathematical details of these models are given in the online appendix. Figure 2 shows viscosity versus shear rate for the three rheology models. All three models provide similar viscosity values at the high shear rates (>100/s) that are typical for large arteries, but exhibit very different behaviors at low shear rates. Finite-volume meshes consisting of approximately 300 000 to 1 million elements were created for the flow domain of each ICA aneurysm model using ANSYS ICEM CFD (ANSYS, Canonsburg, Pennsylvania, USA). The Navier–Stokes equations were solved numerically under pulsatile flow conditions using the CFD solver Star-CD (CD Adapco, Melville, New York, USA). In all simulations a mean flow rate of 4.6 ml/s at the ICA19 was used as the inlet boundary condition, and a pulsatile velocity waveform measured from transcranial Doppler ultrasound images obtained from a normal subject was scaled to the mean flow rate. Traction-free boundary conditions were implemented at the outlets. The mass flow rate through each outlet artery was proportional to the cube of its diameter based on the principle of optimal work.20 Detailed flow-governing equations and numerical methods of CFD simulations are shown in the online appendix. For each aneurysm geometry we performed three pulsatile flow simulations using the Newtonian model, the Casson model and the H-B model, respectively. In this study we were only concerned with the shear rate, viscosity and WSS averaged over one cardiac cycle. In this paper, mention of these parameters implies time-averaged values over one cardiac cycle.

Viscosity versus shear rate for the three blood rheology models. These models give different stress-strain rate relations at low shear rates but exhibit similar constant viscosity at the high shear rates (>100/s) that are typically encountered with blood flow in large arteries. τ is the shear stress, μ is the dynamic viscosity, γ˙ is the shear rate, τ0 is the yield stress and μ∞ is the Newtonian viscosity. Details of these rheology models are given in the online appendix. Pa, Pascal; s, second.
In our analysis of the CFD hemodynamic data we plotted the luminal distributions of shear rate, viscosity and WSS derived from each simulation. For quantitative comparison of different rheology models, we calculated the average shear rate and the average blood viscosity over the aneurysm dome volume and the average WSS over the aneurysm dome surface. Here the aneurysm sac was divided into dome, body and neck regions, each occupying one-third of the aneurysm height.21 Average values for the parent vessel parameters were calculated similarly from the reconstructed parent vessel segments, including the branches.
Results
Flow characterization
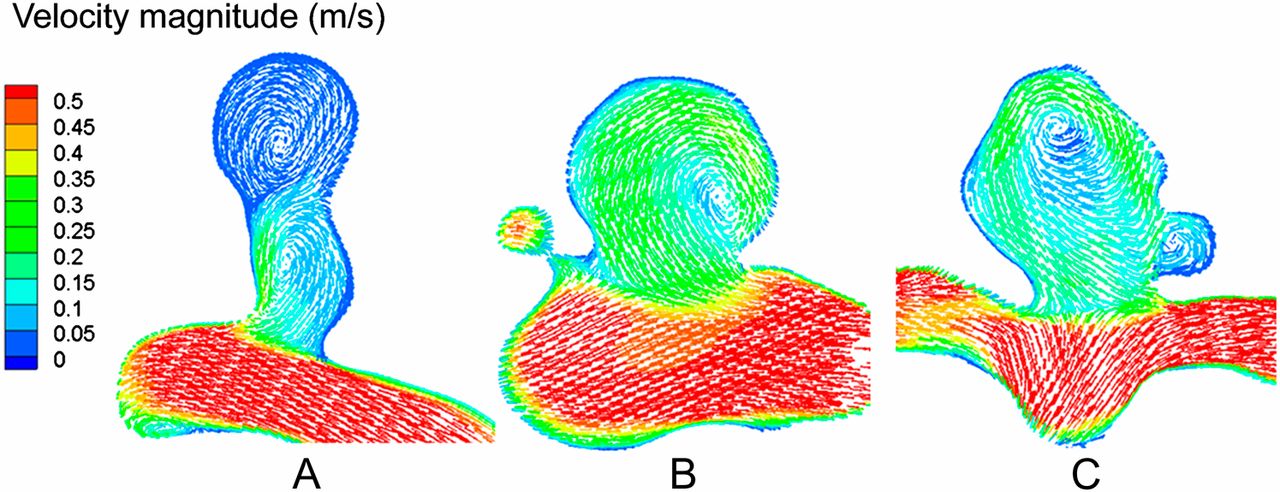
CFD simulations using all three rheology models produced very similar flow patterns in each ICA aneurysm. Figure 3 shows the time-averaged flow patterns on representative cross-sectional planes predicted by CFD using the Newtonian model. Although aneurysms B and C contained a typical large single vortex with inflow and outflow pathways, aneurysm A harbored an additional secondary vortex near the dome that was slowly recirculating or nearly stagnant. Time-resolved visualization of the pulsatile flow field (not shown) revealed that the primary vortices within all three aneurysms were stable, whereas the secondary vortex in aneurysm A was slowly oscillating. These results were similar to those obtained with the non-Newtonian models (not shown).

Flow patterns (velocity vector field averaged over a cardiac cycle) on a representative cross-sectional plane in aneurysms A, B and C (based on the Newtonian model; similar to results from the two non-Newtonian models). Note that all aneurysms had a large vortex, but aneurysm A has an additional secondary vortex near the dome.
Shear rate
Figure 4 shows the luminal distributions of shear rate calculated using the three rheological models for each aneurysm geometry. Because the non-Newtonian effect becomes most appreciated at very low shear rates (figure 2), a logarithmic scale was used to accentuate this effect for comparison between the different blood rheology models (figure 4). In each case the Casson model and H-B model predicted distributions that were similar to those associated with the Newtonian model, except for the dome of aneurysm A which featured a low shear rate zone. Figure 5 provides a quantitative comparison of shear rate values that were volume-averaged in the aneurysm dome (top one-third of the sac) and in the parent vessel, calculated by all three rheology models.

Local logarithmic shear rate distribution at the lumen in aneurysms A, B and C. In each case the Casson and Herschel-Bulkley (H-B) models predicted similar distribution to the Newtonian model, except for the dome of aneurysm A where considerably lower shear rate values were predicted by both non-Newtonian models than the Newtonian model.

Shear rate, viscosity and wall shear stress (WSS) averaged in the dome and in the parent vessel from computational fluid dynamics using the three rheology models (aneurysms A, B, and C). Shear rate and viscosity were volume-averaged whereas wall shear stress was averaged on the luminal surface. All values presented were normalized by the Newtonian results.
In the dome of aneurysm A the Casson model and H-B model predicted average shear rates that were only 53% and 43%, respectively, of the values obtained with the Newtonian model. Elsewhere (ie, in the rest of aneurysm A and in aneurysms B and C) the discrepancies were less than 3%. In other words, the Newtonian model overestimated the shear rate in the dome of aneurysm A, a predominantly low shear region.
Viscosity
Blood viscosity distributions at the luminal wall from the two non-Newtonian models generally showed no large variations and were similar to the Newtonian viscosity (figure 6). The only exception was the dome of aneurysm A where substantially higher viscosity values were observed when using the Casson or H-B model. Here the average viscosities predicted by the Casson and H-B models were 174% and 274% of the Newtonian model, respectively (figure 5)—that is, the Newtonian model did not reflect the drastically increased viscosity in the stagnant region in the dome of aneurysm A.

Local blood viscosity distribution at the luminal wall for each aneurysm predicted by computational fluid dynamics using the three rheology models. The Casson and Herschel-Bulkley (H-B) models generally show little deviation from the Newtonian viscosity, except for the dome in aneurysm A where they predicted much higher viscosity.
Wall shear stress
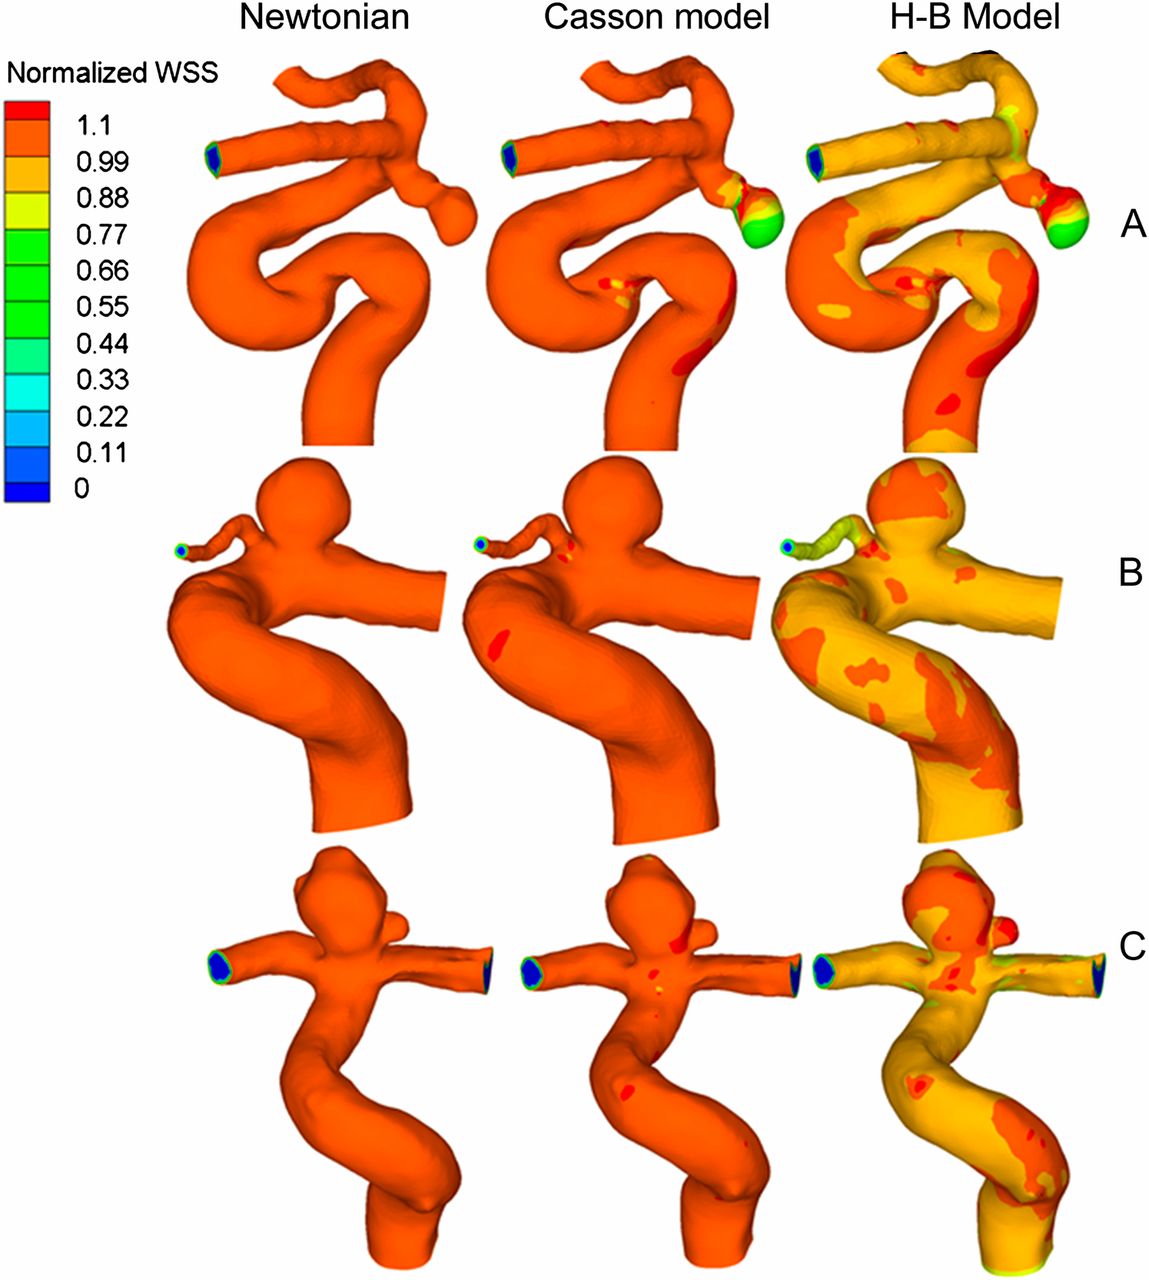
Figure 7 shows the luminal distributions of WSS predicted by all three rheology models. For ease of comparison, the WSS is normalized by the local WSS value from the Newtonian model prediction. Because of this normalization, the Newtonian results (left column) appear to have unity WSS distributions (ie, all values are 1). In each aneurysm case the Newtonian and Casson models predicted similar WSS, except in the dome of aneurysm A where the Casson model prediction was considerably lower—as low as 55% of the Newtonian prediction (observation from figure 7) at the tip of the dome. The H-B model (right column) predicted slightly lower WSS (approximately 5% less) than the Newtonian model, except in the dome of aneurysm A where the H-B model predicted as low as 60% of the Newtonian model (observation from figure 7) at the tip of the dome.

Wall shear stress (WSS) distribution (normalized by local WSS values from the Newtonian model) in the lumens of aneurysms A, B and C. In each case the Casson model predicted a distribution that was similar to that of the Newtonian model, except for the dome of aneurysm A. The Herschel-Bulkley (H-B) model predicted overall slightly lower values and, in the dome of aneurysm A, the non-Newtonian models predicted considerably lower WSS values than the Newtonian model.
Figure 5 provides quantitative comparisons of the surface-averaged WSS in the aneurysm dome region and in the parent vessels predicted by the three models. The average WSS predicted by the Casson and H-B models was 71% and 76%, respectively, of the Newtonian WSS, showing that the Newtonian model overestimated WSS in the dome of aneurysm A.
Discussion
Previous studies have investigated the influence of non-Newtonian blood rheology on CFD modeling in idealized geometric models of aneurysms. Those models usually consist of a sphere on a cylindrical tube (straight or curved) which possesses perfect symmetry that does not exist in real aneurysms. Fisher et al 22 virtually created different types of idealized aneurysms, including bifurcation and sidewall aneurysms on straight and curved vessels. Valencia et al 23 studied the non-Newtonian effect on two virtual saccular aneurysm models with different inclination angles and one model of a non-diseased basilar artery. Such perfect symmetry is unrealistic and may cause misleading flow patterns because realistic anatomical aneurysm geometry can have complex flow dynamics that idealized geometries cannot capture. Such complex flow dynamics could be caused by vessel curvature or tortuosity, which influence the flow entering and circulating within the aneurysm sac and thus shear stress on the aneurysm wall.15 Furthermore, patients' aneurysms are often non-spherical or have multiple lobes and, because of these irregular shapes, can harbor various disturbed flow patterns including secondary and/or unsteady vortices.17 ,24–26 Blood rheology results based on idealized aneurysm models do not therefore reflect many important features of real anatomy.23 In the current study, geometric models of typical realistic ICA aneurysms representing an oblong sidewall aneurysm, a near-spherical sidewall aneurysm and a near-spherical bifurcation aneurysm were used to investigate the influence of non-Newtonian blood rheology on CFD simulations.
Our results indicate that the Newtonian fluid assumption in general is acceptable in CFD modeling of healthy vessels and aneurysms that do not harbor regions of pronounced low shear. However, the current data suggest that the non-Newtonian properties of blood should be considered when modeling hemodynamics in aneurysms with slow and recirculating flow regions (low shear flow), which are typically found in aneurysms with complex geometry like aneurysm A with an irregular oblong shape and a daughter aneurysm.
These types of aneurysms are generally suspected to be dangerous and command attention for treatment, as low WSS has been shown to be associated with aneurysm rupture8 ,9 ,11 and low shear rates may cause clot formation.16 Xiang et al 11 demonstrated that the rupture of IAs correlated with low WSS in their study of 119 aneurysms. Ishida et al 27 identified the rupture points of eight ruptured middle cerebral artery aneurysms to be located in regions of the lowest WSS. The Newtonian model cannot capture the increased viscosity in such low shear regions and consequently overestimates the shear rate and WSS. When the non-Newtonian effects are neglected in such aneurysms, the shear rate and WSS appear falsely higher in the low shear regions and thus could under-represent the risk of clot formation and aneurysm rupture.
In clinical practice, coil embolization or flow diverter treatment for cerebral aneurysms reduces the intra-aneurysmal flow, as indicated by contrast stagnancy at the dome, thereby reducing shear rate (thus promoting clotting) and WSS (thus increasing rupture risk).24 ,28 If intra-aneurysm thrombosis does not develop quickly and completely to fill the whole sac but leaves a part of the aneurysmal wall exposed to low WSS for an extended period of time, such treatments could result in deterioration of the wall via inflammatory cell infiltration (caused by low WSS and immature thrombus29) and thus an increased propensity of rupture.24 However, we believe that in most situations clotting happens much faster than the wall degradation. Thus, coil or flow diverter embolization, by massively increasing stasis, usually induces a healing response through thrombosis and subsequent cicatrization. It is important to note, however, that there have been reports of aneurysm rupture after coil or flow diverter treatments.29 The typical aneurysmal flow after coil or flow diverter implantation has high stasis with a very low shear rate and WSS. Hence, the same precaution regarding the choice of blood rheology model should be taken in hemodynamic modeling of post-treatment aneurysms.
Despite our concerns regarding the application of the Newtonian assumption in CFD of IAs, we do not suggest that all CFD analyses be conducted with non-Newtonian rheology. The Newtonian model has its merits: it is simple and easy to use, implicit in all commercial CFD software and accurate enough in most situations unless low shear regions are present. Furthermore, our data show that Newtonian models produce flow patterns roughly consistent with non-Newtonian models. Hence, if the researcher only wants to know the intra-aneurysmal flow patterns but not WSS or shear rate, routine CFD with Newtonian assumption might be sufficient.
Non-Newtonian models have their drawbacks. Implementation of non-Newtonian models in CFD requires writing subroutines or using specialized CFD software, which might not be available to all researchers. Moreover, non-Newtonian models sometimes may underperform. For example, in the H-B model, the viscosity has no lower limit when shear rate tends to infinity. Hence, at very high shear rates where blood is expected to behave like a Newtonian fluid with a constant viscosity, the H-B model would produce unrealistically lower viscosity values. This behavior causes viscosity values in the parent arteries in our study to fall below the Newtonian value (figures 2 and 6) and may unduly influence the flow field. In our study, at a shear rate of 10 000/s, the corresponding viscosity in the H-B model is 2.5 cP compared with the Newtonian viscosity of 3.5 cP.
As a simplified heuristic to aid decision-making for future aneurysm hemodynamics modeling projects, we suggest using non-Newtonian rheology modeling in the following situations where regions of high stasis or slow recirculation are expected, especially when quantitative information of shear rate, WSS or WSS-based quantities such as oscillatory shear index are desired:
-
(1)Aneurysms with size ratio >2. Size ratio is defined as the maximal diameter of the aneurysm divided by the parent vessel diameter.17 Tremmel et al 25 demonstrated that, once the size ratio becomes >2, the single aneurysmal flow vortex splits into multiple vortices and the low WSS area increases drastically. Dhar et al 17 found that size ratio can significantly separate ruptured from unruptured aneurysms, and this finding has been supported by other studies.11 ,30 ,31 Furthermore, Dhar et al 17 found the optimal threshold for size ratio to be 2.05.
-
(2) Aneurysms with daughter aneurysms or blebs.
-
(3) Aneurysms after coil or flow diverter implantation.
When researchers are unsure whether a particular aneurysm case commands non-Newtonian modeling, we suggest that they first run a simple and quick steady-state CFD simulation using the Newtonian model to determine whether a low shear flow region exists. If it does, a non-Newtonian model could be used for proper CFD simulation to obtain WSS and related quantities such as oscillatory shear index.
This study has several limitations. First, only three aneurysm cases were investigated. Although this can provide an initial illustration of the effect of non-Newtonian rheology on aneurysmal hemodynamics, conclusions should be validated in follow-up studies that include a large number of cases. Second, because we focused on comparing hemodynamics from different rheology models, we kept the inlet boundary condition for the CFD simulations the same, which may not accurately reflect the patient-specific reality. Third, although non-Newtonian rheology can improve the accuracy of blood flow simulations, the non-Newtonian models are themselves also simplifications and cannot perfectly mimic in vivo behavior. Finally, there is no consensus as to which non-Newtonian model (Casson, H-B or others) is superior. Further investigations are therefore needed that are dedicated to produce a more consistent non-Newtonian model, and care should be taken to accurately determine its model parameters experimentally.
Conclusion
The Newtonian blood rheology assumption is usually acceptable for CFD simulation of cerebral aneurysm hemodynamics but could underestimate viscosity and overestimate shear rate and WSS in the slowly recirculating flow regions that are typically found at the dome in elongated or complex-shaped saccular aneurysms, as well as in aneurysms following endovascular treatment. Because low shear rates and low WSS in such flow conditions indicate a high propensity for thrombus formation and aneurysm rupture, Newtonian hemodynamics may underestimate the propensity of these events.
Acknowledgments
We thank Paul H. Dressel BFA for assistance with preparation of the illustrations and Debra J Zimmer AAS CMA-A for editorial assistance.
References
Supplementary materials
Supplementary Data
This web only file has been produced by the BMJ Publishing Group from an electronic file supplied by the author(s) and has not been edited for content.
Files in this Data Supplement:
- Download Supplementary Data (PDF) - Manuscript file of format pdf
Footnotes
-
Additional data are published online only. To view the file please visit the journal online (http://jnis.bmj.com).
-
Disclosures Dr. Kolega, Dr. Natarajan, Dr. Tremmel, and Mr. Xiang have no final relationships to disclose. Dr. Meng is the principal investigator of the aforementioned NIH grant. Dr. Levy receives research grant support (principal investigator: Stent-Assisted Recanalization in acute Ischemic Stroke, SARIS), other research support (devices), and honoraria from Boston Scientific* and research support from Codman & Shurtleff, Inc. and ev3/Covidien Vascular Therapies; has ownership interests in Intratech Medical Ltd. and Mynx/Access Closure; serves as a consultant on the board of Scientific Advisors to Codman & Shurtleff, Inc.; serves as a consultant per project and/or per hour for Codman & Shurtleff, Inc., ev3/Covidien Vascular Therapies, and TheraSyn Sensors, Inc.; and receives fees for carotid stent training from Abbott Vascular and ev3/Covidien Vascular Therapies. Dr. Levy receives no consulting salary arrangements. All consulting is per project and/or per hour. (*Boston Scientific's neurovascular business has been acquired by Stryker.)
-
Funding This work was partially supported by NIH grant R01NS064592 and a grant from Toshiba Medical Systems.
-
Competing interests None.
-
Provenance and peer review Not commissioned; externally peer reviewed.