
Cortical Iron Reflects Severity of Alzheimer’s Disease
Abstract
Abnormal iron distribution in the isocortex is increasingly recognized as an in vivo marker for Alzheimer’s disease (AD). However, the contribution of iron accumulation to the AD pathology is still poorly understood. In this study, we investigated: 1) frontal cortical iron distribution in AD and normal aging and 2) the relation between iron distribution and degree of AD pathology. We used formalin fixed paraffin embedded frontal cortex from 10 AD patients, 10 elder, 10 middle aged, and 10 young controls and visualized iron with a modified Perl’s histochemical procedure. AD and elderly subjects were not different with respect to age and sex distribution. Iron distribution in the frontal cortex was not affected by normal aging but was clearly different between AD and controls. AD showed accumulation of iron in plaques, activated microglia, and, in the most severe cases, in the mid-cortical layers along myelinated fibers. The degree of altered iron accumulations was correlated to the amount of amyloid-β plaques and tau pathology in the same block, as well as to Braak stage (p < 0.001). AD and normal aging show different iron and myelin distribution in frontal cortex. These changes appear to occur after the development of the AD pathological hallmarks. These findings may help the interpretation of high resolution in vivo MRI and suggest the potential of using changes in iron-based MRI contrast to indirectly determine the degree of AD pathology in the frontal cortex.
INTRODUCTION
Future therapeutic interventions for Alzheimer’s disease (AD) require early and preferably non-invasive clinical tests. A promising approach is in vivo detection of amyloid-β (Aβ) plaques, neuropil threads (NT), and neurofibrillary tangles (NFT), since these histological hallmarks of AD occur 10–20 years before cognitive decline [1, 2]. In vivo visualization of Aβ plaque burden is already possible using positron emission tomography (PET) [3–6], but this technique requires the use of a radioactive tracer and a highly-specialized infrastructure. Recent advances in PET tracers for tau are promising to study the spatial and temporal relation between amyloid and tau accumulation in vivo. Nevertheless, our understanding of AD is incomplete, and the role of other modulators of the disease such as microglia activation and iron accumulation is only partially understood. Recently, high field (7T) magnetic resonance imaging (MRI) has been reported to discriminate AD from control neo-cortex by changes in phase shift, which is a reliable indication of iron content in the brain [7, 8]. Other MRI studies show susceptibility induced changes in vivo in AD transgenic mice [9–11] and in post mortem human AD brain tissue [12, 13] that correlate to Aβ plaques histologically. Aβ plaques show iron accumulation [14–20], and it has been suggested that this iron causes the high T2* susceptibility effects [11, 21–23]. However, there may be additional pathological substrates for iron-related MRI changes in AD. A subset of histological studies report iron accumulation in microglia in the cortex and hippocampus of AD patients [14, 16, 19]. In contrast, Smith et al. shows iron accumulation in NFT but explicitly report absence of iron labelling in glial cells [20]. AD-related iron accumulation in other tissue compartments than Aβ plaques is also suggested by the presence of diffuse MRI hypo-intensities in post mortem AD cortex [19, 24], but the pathologic substrate of these diffuse MRI hypo-intensities is not known. Moreover, we found a diffusely increased iron labelling in layer III-V of the frontal cortex of AD patients in a study comparing different histological iron stains [25].
The value of iron-based MRI changes for the diagnosis and staging of AD depends on an association between cortical iron accumulation and AD pathology. However, we are not aware of studies that have correlated the degree of cortical iron accumulation to Braak stage, local Aβ plaque load, or local tau pathology. For the interpretation of iron-based cortical MRI changes as a biomarker for AD, it is also necessary to know the effect of aging on cortical iron accumulation. Aging itself leads to increased iron and ferritin concentrations of the cortex [26, 27], but the microscopically distribution of this age-related increase is unknown.
Our previous finding of increased cortical phase shift changes as a possible non-invasive clinical biomarker for AD [7] led us to investigate the following questions: 1) Is the pathological substrate of iron based MRI changes in AD cortex limited to iron accumulation in Aβ plaques or is iron also accumulating in other tissue compartments? 2) Is cortical iron accumulation related to Braak stage, local Aβ plaques, and local tau pathology? 3) How does iron accumulation in AD compare to normal aging?
METHODS
Patients
We included autopsy material of 10 AD patients (age 65–90 years old, five male, and five female) with a clinical diagnosis of dementia and histological changes of at least Braak stage IV. Other neuropathological changes were absent, except for one patient with a 1 cm large meningioma in the parietal lobe, which had not been noticed during life. We also included autopsy material of 10 young (17–38 years old, eight male, two female), 10 middle aged (51–57, eight male, two female), and 10 old (74–89, four male, six female) controls. No difference was found in sex distribution between the four groups (p > 0.05). By definition, AD and old age controls were significantly older compared to the middle aged and young controls (p < 0.05). The tissue was selected from the archive of the Department of Pathology, without knowledge of the degree of AD pathology in these blocks. All tissue samples were handled in a coded fashion, according to Dutch National Ethical Guidelines (Code for proper secondary use of human tissue, Dutch Federation of Medical Scientific Societies). Controls were included if the autopsy request file did not mention cognitive disorders, movement disorders, or extensive cerebrovascular disease. For all patients and controls, Braak stage was determined by two experienced neuropathologists (SGvD and RN) according to Alafuzoff [28] investigating the relevant brain areas. Patient characteristics, including Braak stage and additional neuropathological findings, are presented in Table 1.
Table 1
Demographics and pathology of subjects
| No. | age/ | AD/ | Braak | Tau | Aβ plaque | Fe plaque/ | Band | Other Brain Pathology |
| sex | control | stage | mcg | Fe/PLP | ||||
| 1 | 17/M | C | 0 | – | – | – | – | No |
| 2 | 18/M | C | 0 | – | – | – | – | Colloid cyst 3rd ventricle moderate hydrocephalus |
| 3 | 21/M | C | 0 | – | – | – | – | Colloid cyst 3rd ventricle with brain herniation |
| 4 | 25/M | C | 0 | – | – | – | – | No |
| 5 | 31/M | C | 0 | – | – | – | – | No |
| 6 | 30/M | C | 0 | – | – | – | – | No |
| 7 | 33/M | C | + | – | – | – | – | Old lacunar infarct periventrically |
| 8 | 36/F | C | 0 | – | – | – | – | No |
| 9 | 37/M | C | 0 | – | + | – | – | No |
| 10 | 38/F | C | 0 | – | – | – | – | No |
| 11 | 51/M | C | + | – | – | – | – | No |
| 12 | 52/M | C | I | + | ++ | ++ | – | No |
| 13 | 53/M | C | + | – | – | – | – | Old meningo-ventriculitis |
| 14 | 53/M | C | + | – | – | – | – | Old lacunar infarct caudate nucleus |
| 15 | 54/M | C | 0 | – | – | – | – | No |
| 16 | 56/M | C | 0 | – | – | – | – | No |
| 17 | 56/M | C | + | – | + | – | – | No |
| 18 | 58/F | C | + | – | – | – | – | No |
| 19 | 58/M | C | + | – | – | – | – | No |
| 20 | 57/F | C | + | + | + | – | – | No |
| 21 | 74/M | C | + | – | – | – | – | Capillary teleangiectasia pons |
| 22 | 75/F | C | + | – | + | + | – | No |
| 23 | 76/M | C | + | – | – | – | – | No |
| 24 | 76/M | C | I | – | – | – | – | Small old hemorrhagic infarct temporal lobe |
| 25 | 77/F | C | I | – | + | + | – | No |
| 26 | 80/F | C | + | + | + | – | – | No |
| 27 | 83/F | C | I | + | + | + | – | No |
| 28 | 84/M | C | + | – | – | – | – | No |
| 29 | 89/F | C | II | + | + | – | – | No |
| 30 | 89/F | C | III | + | +++ | +++ | – | No |
| 31 | 65/F | AD | VI | +++ | +++ | +++ | + | No |
| 32 | 66/F | AD | IV | +++ | +++ | +++ | – | No |
| 33 | 74/M | AD | V | +++ | +++ | +++ | + | No |
| 34 | 77/F | AD | IV | ++ | +++ | ++ | – | No |
| 35 | 78/M | AD | V | +++ | +++ | +++ | + | Meningioma, 1 cm, parietal |
| 36 | 79/F | AD | V | +++ | +++ | ++ | – | No |
| 37 | 86/M | AD | IV | ++ | +++ | ++ | – | No |
| 38 | 88/F | AD | IV | ++ | +++ | ++ | – | No |
| 39 | 89/M | AD | IV | ++ | +++ | ++ | – | No |
| 40 | 90/M | AD | V | +++ | +++ | +++ | – | No |
M, male; F, female; AD, Alzheimer’s disease; Fe, iron; mcg, microglia; PLP, proteolipid protein. –, absent;+, mild;++, moderate;+++, severe. See Methods for definitions.
Tissue
Of each patient and control one block of formalin fixed paraffin embedded frontal cortex was taken. We choose frontal cortex because increased diffuse iron in layer III-V was found earlier in a study designed to compare different histological iron stains [25]. Tissue was fixed in standard formalin for a minimum of 1 week and a maximum of 6, on average 1–2 weeks for both AD patients and controls. From each block, sequential 10 μm thick sections were cut and stained consecutively for myelin-iron and Aβ-iron-tau. In addition, 20 μm thick sections were stained for iron paralleled by a 10 μm section of Aβ immunohistochemistry. The iron stained 20 μm sections were used for counting iron positive plaques (and in addition iron positive activated microglia) because at 20 μm the iron stain labelled much more plaques and labelled them more reproducibly.
Histochemistry
Iron was detected using a modified diaminobenzidine (DAB) enhanced Perl’s protocol as described previously [22, 25]. Sections of 10 μm were incubated for 40 min in 1% potassium ferrocyanide (pH 1) and washed, followed by 75-min incubation with methanol containing 0.01 M sodium azide (NaN3) and 0.3% H2O2. Then the sections were washed in 0.1 M phosphate buffered saline (PBS), before visualization by 0.025% 3,3’-diaminobenzidine (Sigma, St Louis, MO, USA) and 0.005% H2O2 in 0.1 M PBS for 40 min. The reaction was stopped by washing. For the 20 μm sections incubation times were modified to: potassium ferrocyanide 80 min, methanol-NaN3-H2O2 100 min and DAB 80 min. A slightly adapted protocol was used to compare the potential impact of using fixed versus fresh-frozen postmortem tissue on the detection of iron. Frozen sections (20 μm) of the contralateral hemisphere of two AD patients were post fixed for 1 min to prevent floating of the frozen sections from the slide during the staining procedure. The rest of the protocol was identical as described above apart from the 75-min incubation in methanol containing 0.01 M NaN3 and 0.3% H2O2: PBS was used instead of methanol.
Immunohistochemistry
Immunohistochemistry (IHC) was used to detect Aβ protein, hyperphosphorylated tau, proteolipid protein (PLP), myelin basic protein (MBP), myelin oligodendrocyte glycoprotein (MOG), and HLA-DR. For specific information regarding the antibodies and the dilutions used see Table 2.
Table 2
Panel of antibodies used for the immunohistochemical characterization of the different epitopes
| Primary antibody (antigen) | Clone | Dilution | Company |
| Aβ | 6F/3D | 1 : 20 | DAKO |
| Hyperphosphorylated tau | AT8 | 1 : 2000 | Innogentics |
| Proteo lipid protein | Plpc-1 | 1 : 4000 | Bethyl |
| Myelin basic protein | 22 | 1 : 50 | Serotec |
| Myelin oligodendrocyte glycoprotein | EP4281 | 1 : 10000 | Abcam |
| Human ferritin | Rabbit polyclonal | 1 : 10000 | Bethyl Lab. Inc. |
| HLA-DR | CR3/43 | 1 : 30 | DAKO |
After de-paraffination, all 10 μm sections were blocked with methanol and H2O2 (0.3%) for 20 min at room temperature (RT). Slides for Aβ IHC were pre-treated by 85% formic acid at RT for 1 h, followed by 30 min in trypsin at 37°C. Pre-treatment for MBP and MOG was citrate buffer, pH 6, at boiling temperature for 20 min and cooling down for 1 h. No pre-treatment was performed for tau and PLP IHC. All incubations with primary antibodies were overnight at RT. For Aβ, tau, PLP, and MBP the second step was performed with rabbit anti mouse biotin (DAKO, dilution 1 : 200) for 1 h at RT. For MOG swine anti-rabbit, biotin was used (DAKO, dilution 1 : 600) for 1 h at RT. The third step was performed by avidin biotin complex (Vectastain, Vector, Burlingame CA, USA), according to the manufacturer’s instructions (incubation for 30 min at RT). DAB (0.05%) with H2O2 (0.005%) was used as a chromogen with an incubation time of 10 min at RT. Double labelling for ferritin and HLA-DR was performed by pre-treatment with boiled citrate buffer pH 6.0 for 20 min and cooling down for 1 h. Then, tissue was incubated overnight with a 1 : 1 cocktail of the antibodies for ferritin and HLA-DR (Table 2). The second step was performed by 2 h incubation with a 1 : 1 cocktail of goat anti-rabbit biotin (resulting dilution of 1 : 800) and goat anti-mouse alkaline phosphatase (resulting dilution 1 : 60), followed by 30-min incubation with avidin-biotin complex (Vectastain, Vector, Burlingame CA, USA), according to the manufacturer’s instructions. First, ferritin was visualized by 10-min incubation with DAB (0.05%) with H2O2 (0.005%) and 1% cobaltchloride, followed by visualization of HLA-DR by 25-min incubation with liquid permanent red (DAKO, 1 : 60), both at RT.
Semi-quantitative scoring of AD pathology and iron accumulation
Severity of the different pathological features in the frontal cortex was assessed semi-quantitatively by an experienced neuropathologist (RN). Tau pathology was scored as: absent (–): no AT8 immunoreactivity, mild (+): any AT8 immunoreactive structures up to occasional AT8 positive NT/NFT, moderate (++): microscopic diffuse AT8 positive NT up to visible cortical layer V, severe (+++): macroscopically visible layer V and other cortical layers, especially layer II/III.
Aβ pathology was scored as: absent (–): no Aβ plaques, mild (+): 1 Aβ plaque up to 10 fields with >50 plaques/100X field, moderate (++): >10 fields of >50 plaques/100X field, severe (+++): all cortical areas show >100 plaques/100X field.
The degree of abnormal iron accumulation was scored by counting the amount of iron positive plaques and iron positive microglia with activated morphology outside plaques in the cortical 100X field with the highest density and by assessing the presence or absence of a band like increase of PLP and myelin-associated iron labelling in cortical layer III-V. Scoring categories were defined as: absent (–): no plaque/microglial iron accumulations, mild (+): 1–30 plaque/microglial iron accumulations, moderate (++): 31–100 plaque/microglial iron accumulations. Severe (+++): >100 plaque/microglial iron accumulations. Abnormal iron accumulation in the cortex was scored as++++ when the tissue showed a band of diffusely increased PLP and iron in layer III–V in addition to >100 plaque/microglial iron accumulations
Statistical methods
Age was compared between groups using a one-way ANOVA followed by a Bonferonni post hoc test. A chi-square test was used to compare sex distribution between groups. Semiquantitative iron score was correlated to Braak stage, and semiquantitative scores for Aβ plaques and tau pathology by a linear by linear association test for ordinal variables [29]. All statistical analyses were performed using Statistical Package of Social Sciences (SPSS, version 23; SPSS, Chicago, USA). A significant level of 0.05 was used.
RESULTS
Iron distribution in aging and AD
For histochemical visualization of iron, we used a modified Perl’s procedure described by Meguro [22]. With this method, only non-heme iron is stained, mostly Fe3 + but also some Fe2 + [22]. Thus, if we refer to iron in this paper, this is DAB enhanced Perl’s detectable iron meaning non-heme iron, mostly Fe3 + and some Fe2 +. In the absence of Aβ plaques and tau pathology (20 out of 30 controls), iron distribution in the frontal cortex was identical in young (9), middle aged (7), and old (4) controls. These samples showed a finely diffuse, regular iron distribution with evenly increased density in myelin-rich areas: the white matter, the lines of Baillarger and the radially projecting thickly myelinated fibers from the white matter into the cortex (Fig. 1). Five controls (one young, two middle aged, and two old) had minimal Aβ plaques with or without minimal tau pathology and showed the same iron distribution as controls without these AD lesions. The last five controls (one middle aged, four old) showed variable iron accumulation in plaques and cells, directly correlating to the amount of Aβ plaques (Table 1). All 10 AD patients showed iron accumulation in plaques and cells (Table 1, Fig. 2A), most frequent in cortical layer III-V (Fig. 1, bottom row). Intracellular iron was mainly localized in rounded microglia with dilated cell-branches (Fig. 2A), morphologically identified as activated microglia [30, 31]. Iron laden microglia were often seen in or directly around Aβ plaques but also apart from Aβ plaques. Iron accumulation was not observed in neurofibrillary tangles. In 3 out of 10 AD patients, we also observed a diffuse band-shaped increase of both iron and PLP labelling in cortical layer IV/V, and part of layer III, blurring the normal distinction between the lines of Baillarger (Fig. 1, 2B). At higher magnification, we observed darker and thicker labelling of neuropil fibers by iron and myelin proteins (PLP, MOG, and MBP) in a more crowded network (Fig. 2B). The band of increased mid-cortical iron and myelin labelling is not reflected by Aβ plaques, which are most dense in cortical layer I-IV.
Fig.1
A) Each row represents consecutive sections of frontal cortex stained for iron, myelin (PLP immunohistochemistry), and Aβ immunohistochemistry. Controls show a similar iron distribution, irrespective of age, with increased amounts in the myelin rich areas: white matter and the inner and outer line of Baillarger (arrows). AD cortex (bottom row) shows a diffuse band shaped iron and PLP increase in cortical layer IV/V, extending to the inner part of layer III (arrow, and indicated by lines). B) Higher magnification of A, Meguro iron stain. Controls show evenly distributed iron concentration in myelinated fibers and a good distinction between the lines of Baillarger. AD cortex shows diffuse iron increase in the middle cortical layers (arrows), as well as iron positive plaques (asterisk), also concentrated in the middle cortical layers.
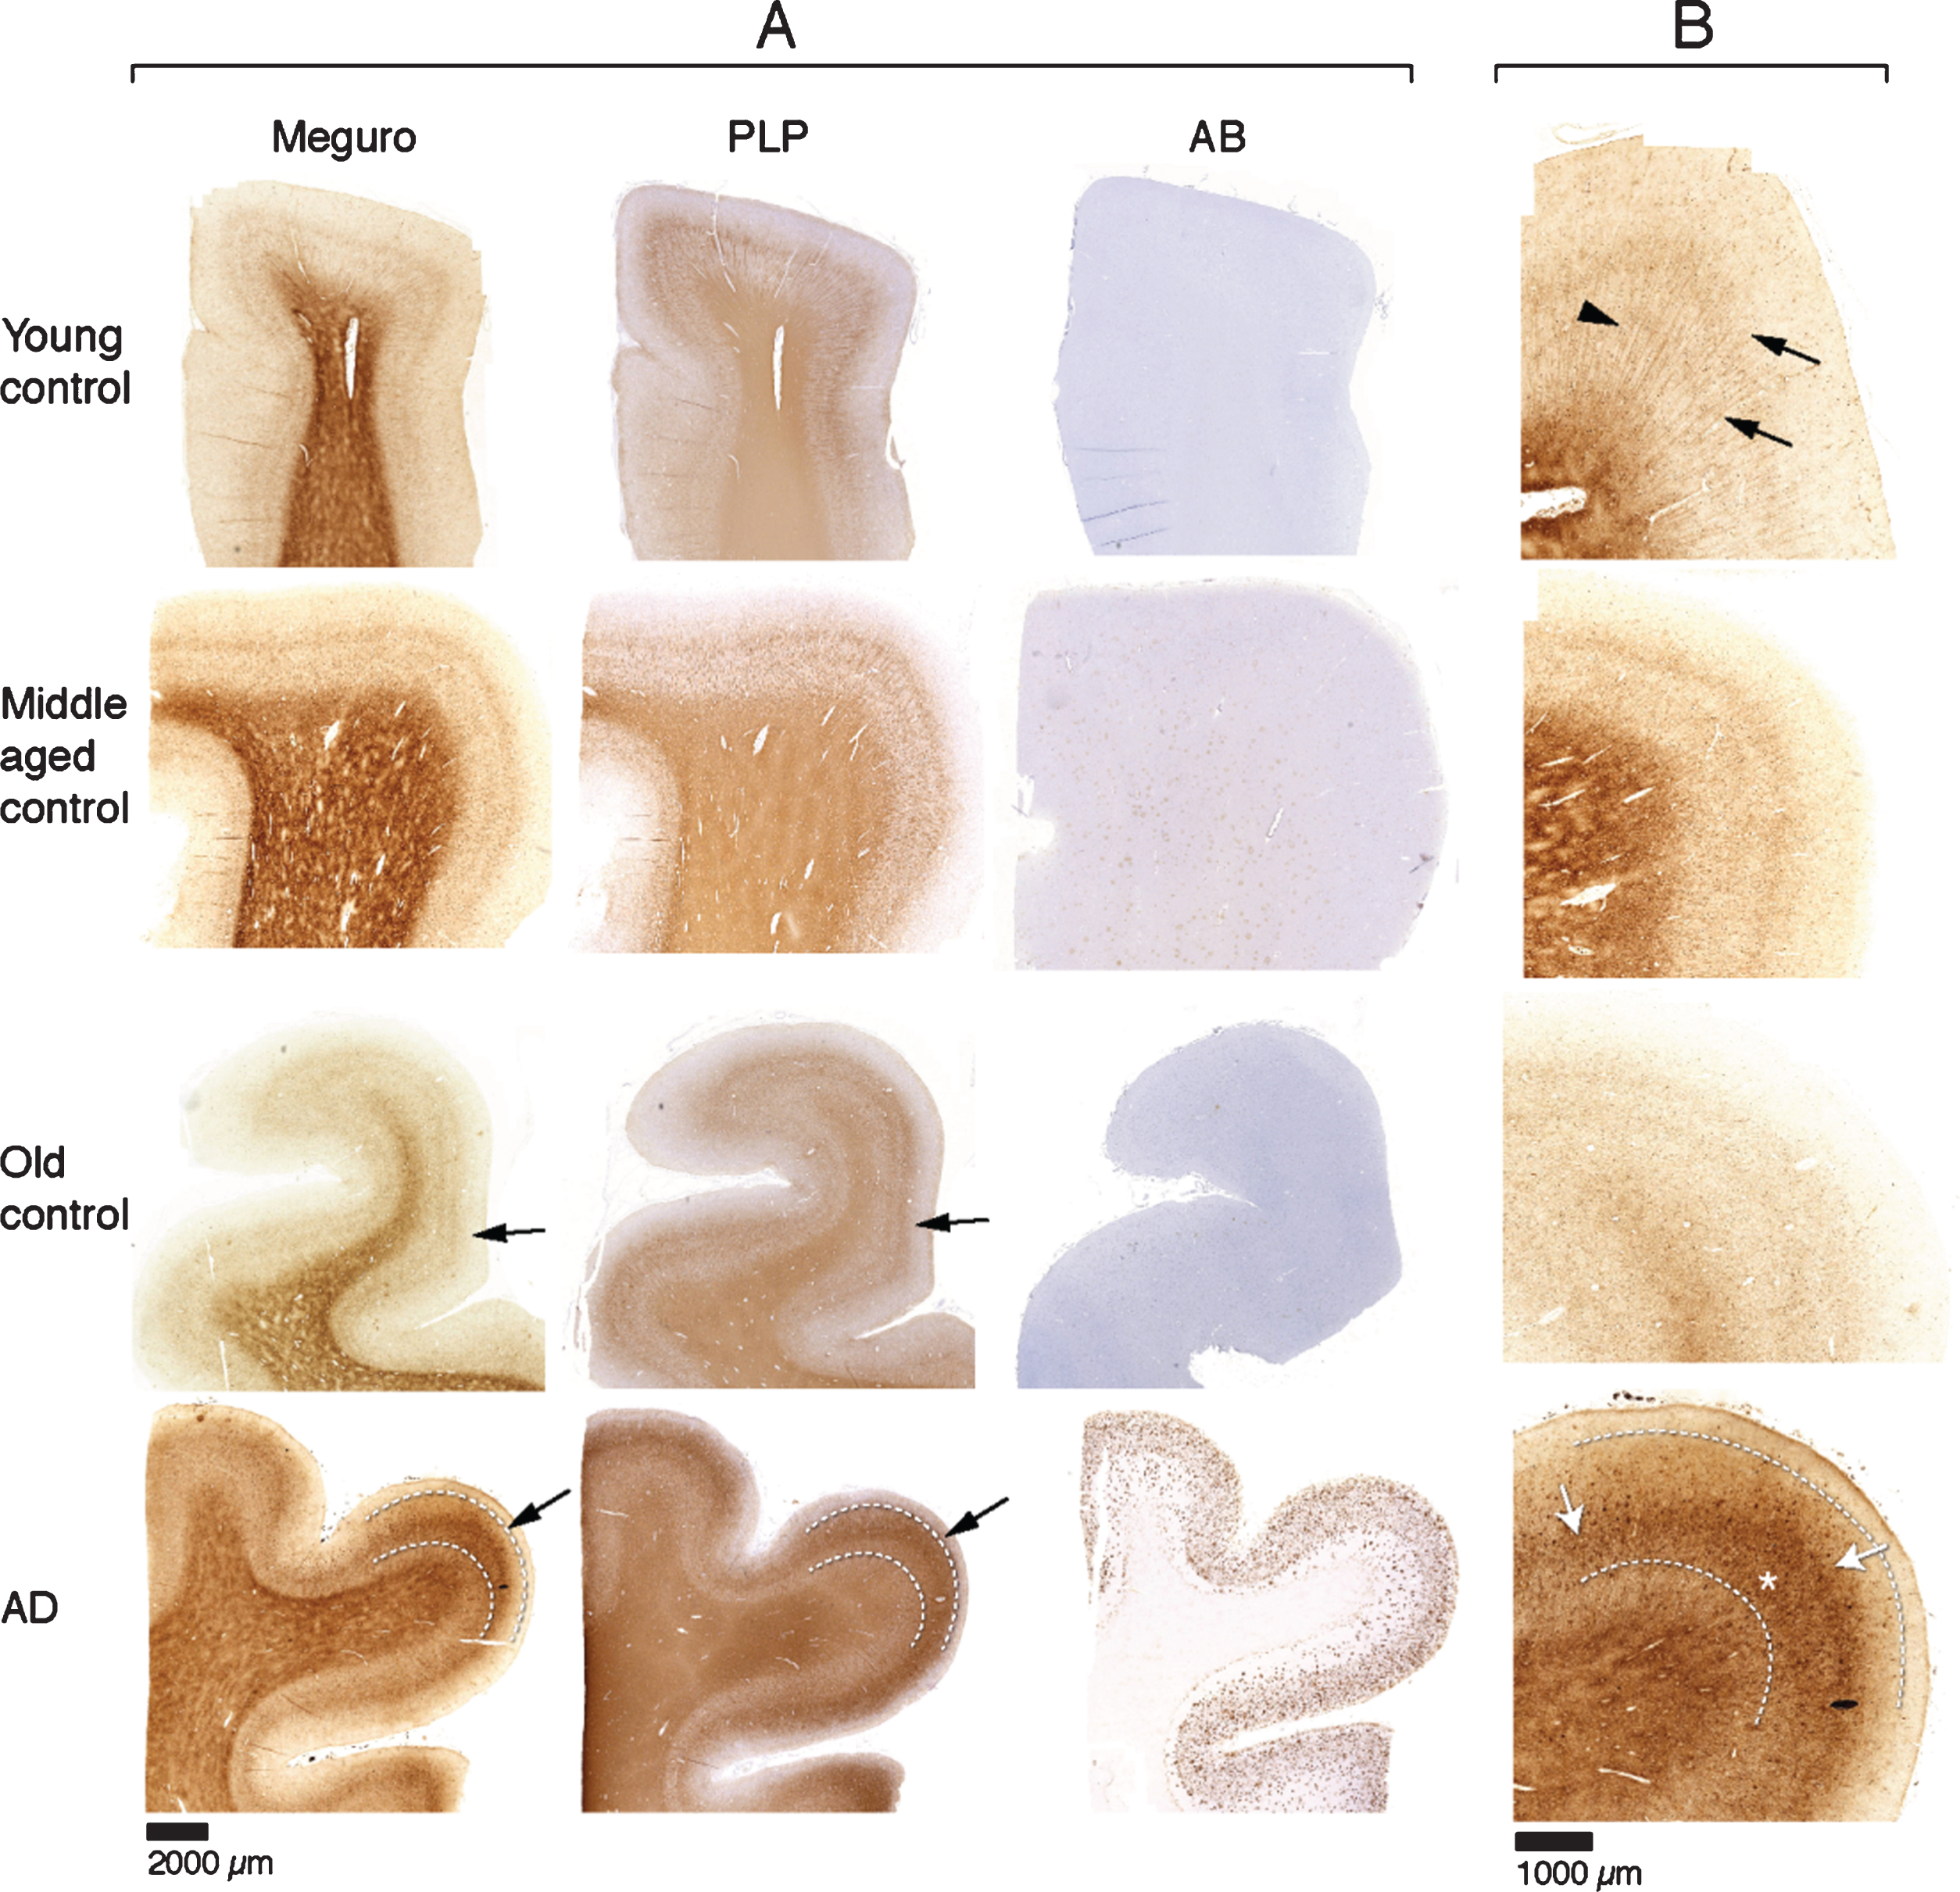
Fig.2
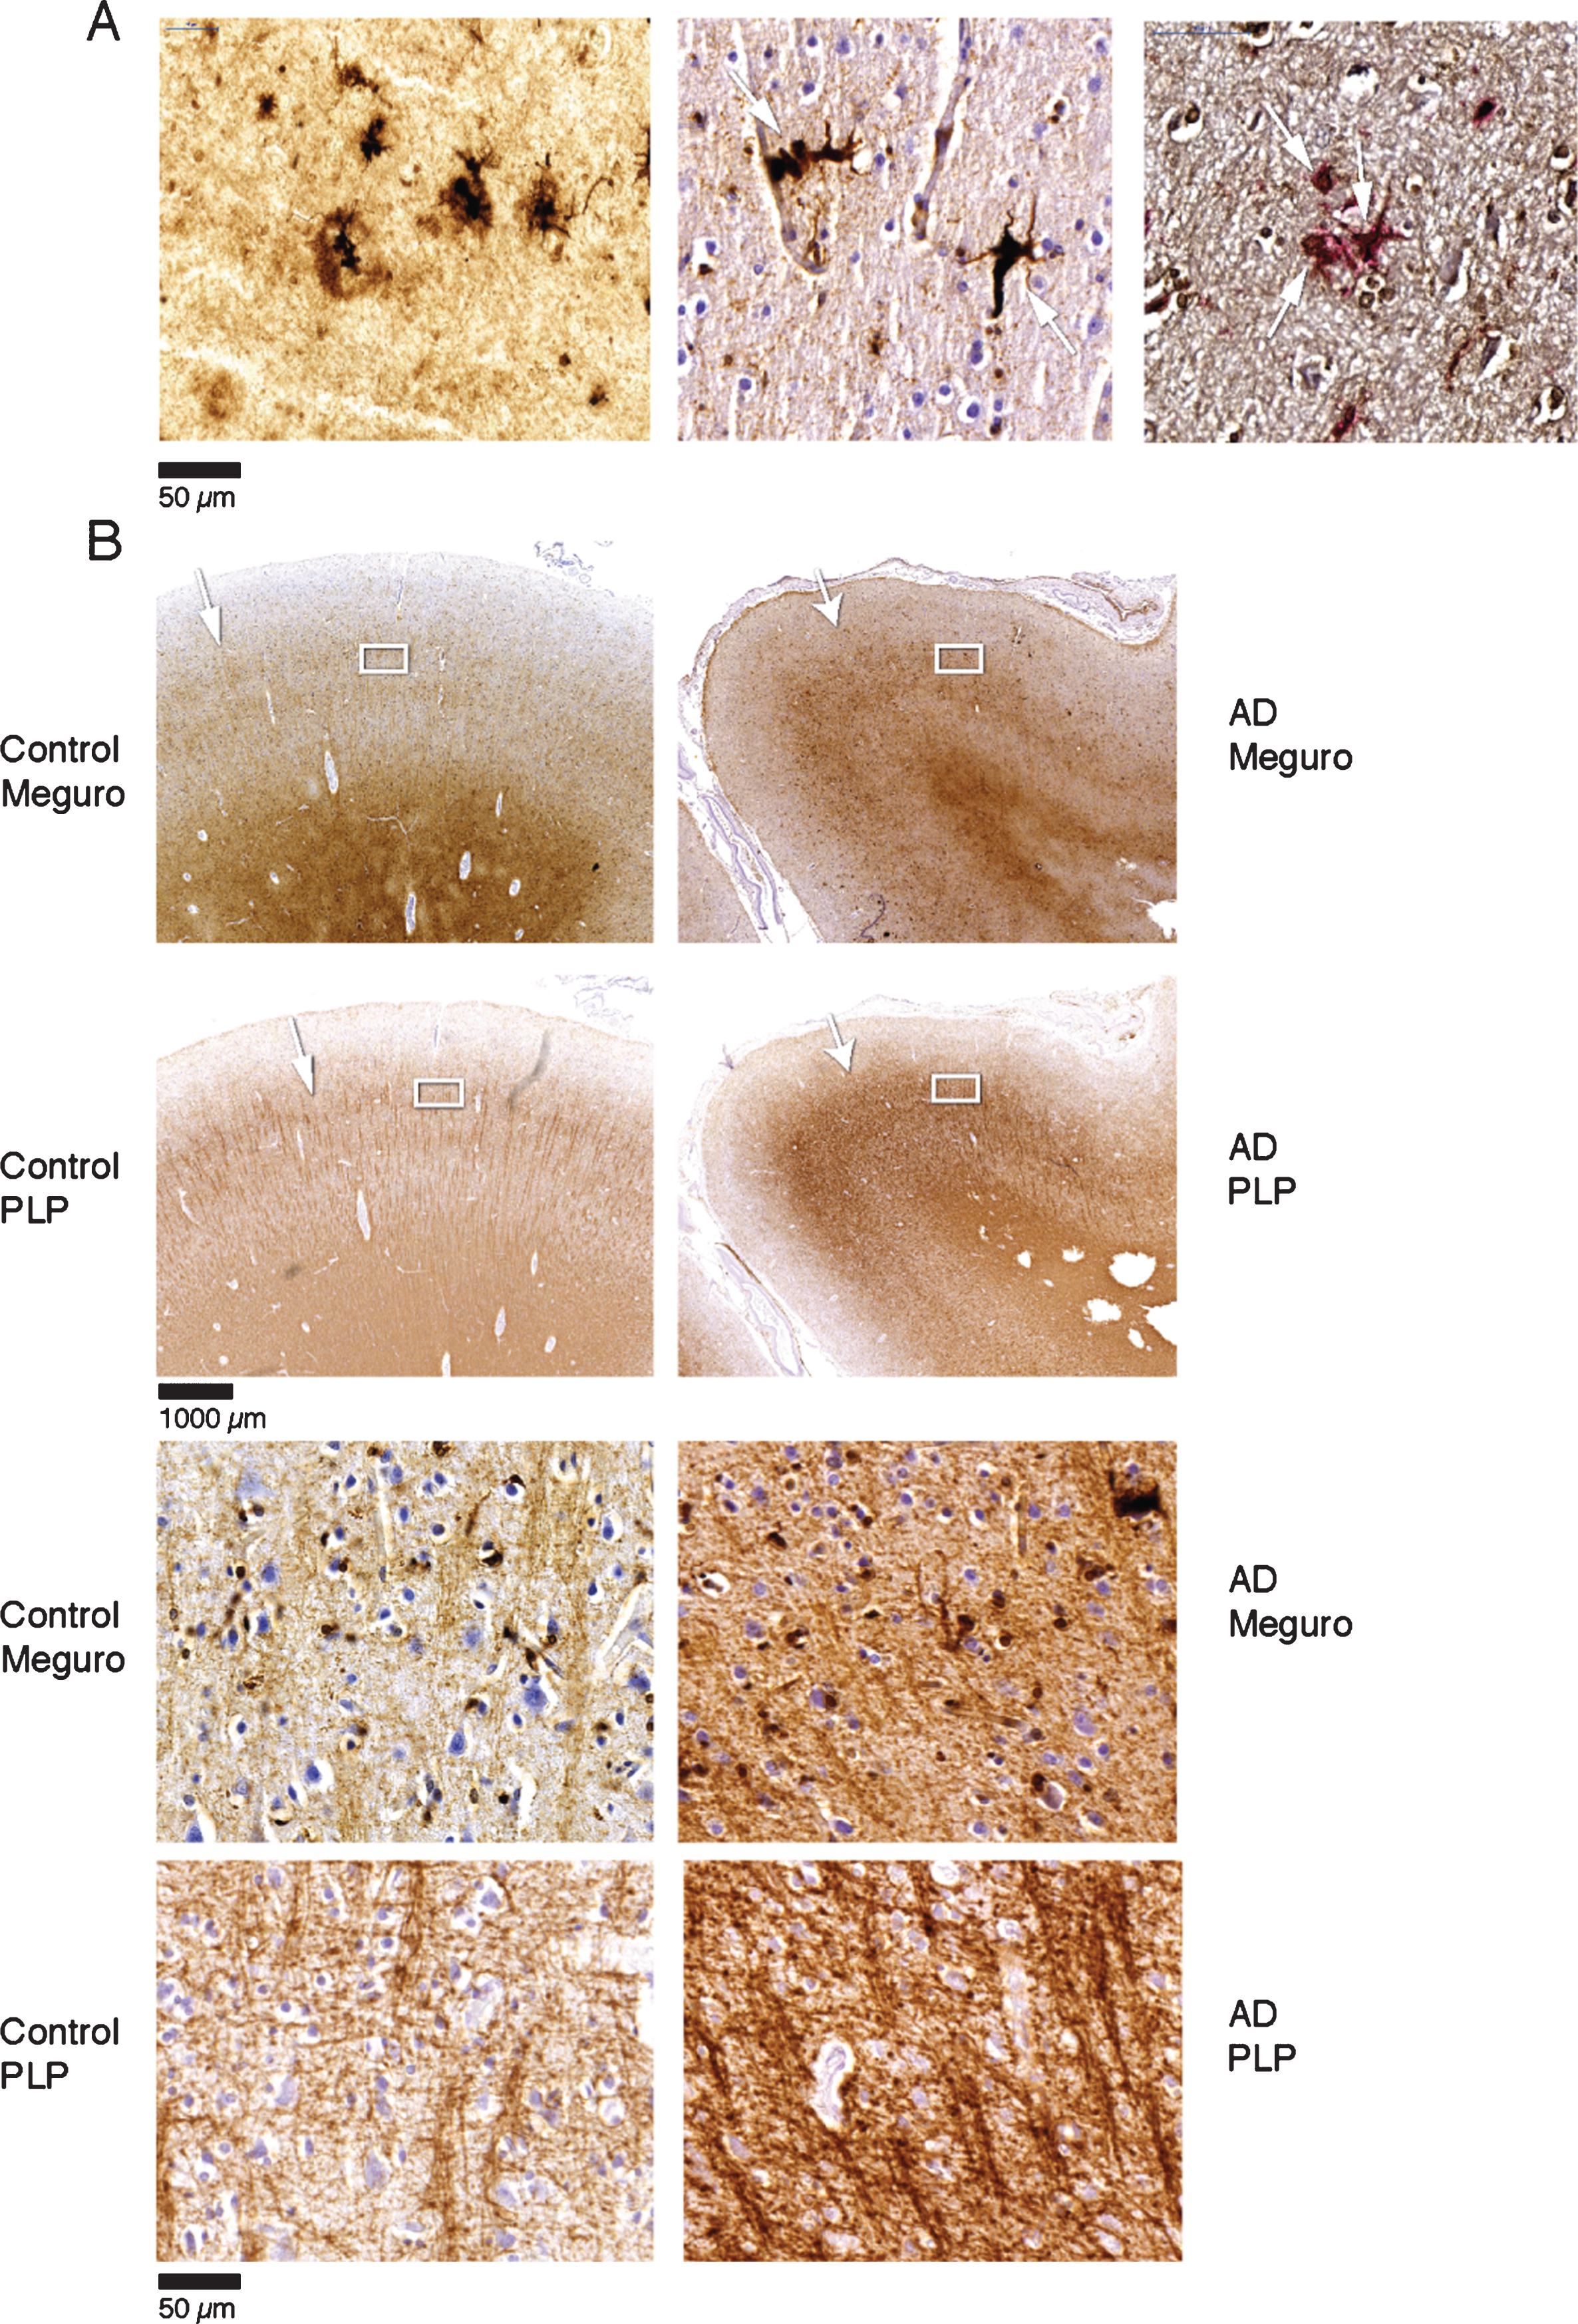
A) Iron accumulation in plaques (left) and microglia (middle) (both Meguro stain). On the right double labelling of iron positive cells by ferritin (brown) and MHCII (red). B) Band shaped increase of iron and PLP labelling in AD (right column) compared to an old control (left column). The right column illustrates that the normal distinction of the lines of Baillarger (arrow) is blurred by a band shaped iron/PLP increase in cortical layer IV/V extending to layer III (arrow). This is due to darker and thicker iron/PLP labelling of more crowded myelinated fibers (bottom panel).
Correlation between iron accumulation, myelin changes, plaques, and tau pathology
Iron accumulations were scored from 0–3 depending on the amount of iron positive plaques and microglia together (see “Methods”). In the presence of an increased iron band in the mid-cortical layers the degree of iron change was scored as 4. This histological iron score correlated with Braak stage (p < 0.001) and with the semi-quantitatively scored amount of Aβ plaques (p < 0.001) and degree of tau pathology (p < 0.001). This level of statistical significance was the same for stratification by age as well as comparison of AD with the old age controls only (Fig. 3). Note that absence or low (score 0-1) iron accumulation in plaques and microglia excluded advanced Braak stage, significant Aβ plaques, or significant tau pathology. A band-shaped increase of diffuse iron and PLP/MBP/MOG labelling was only present in AD frontal cortex with the severest tau pathology (Figs. 3 and 4), despite comparable amounts of Aβ plaques for all AD patients (Fig. 4, Table 1).
Fig.3
Semi-quantitative correlation between iron accumulation and Braak stage (A), Aβ plaques (B), and tau pathology (C). Iron accumulation: 0: no iron accumulation, 1: low, 2: intermediate and 3: high iron accumulation in plaques and microglia, 4: high iron accumulation in plaques and microglia and a band shaped iron/PLP increase in the middle cortical layers. For grading definitions, see Methods. All three correlations were statistically significant (p < 0.001).
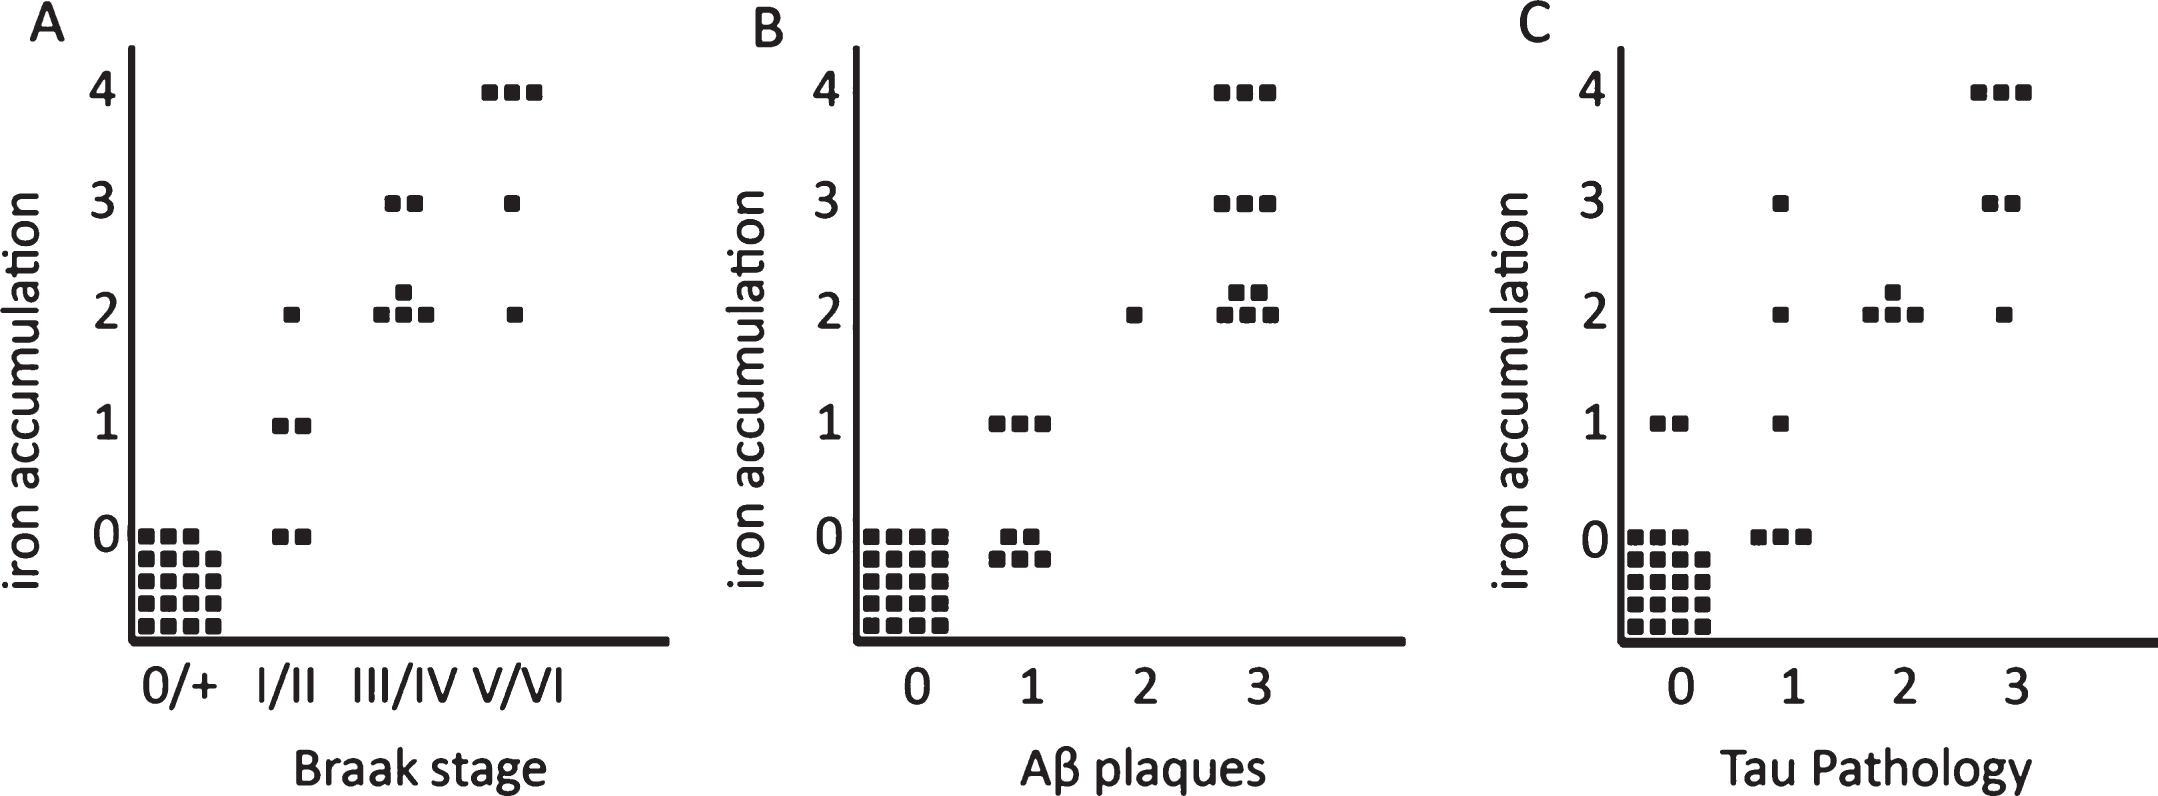
Fig.4
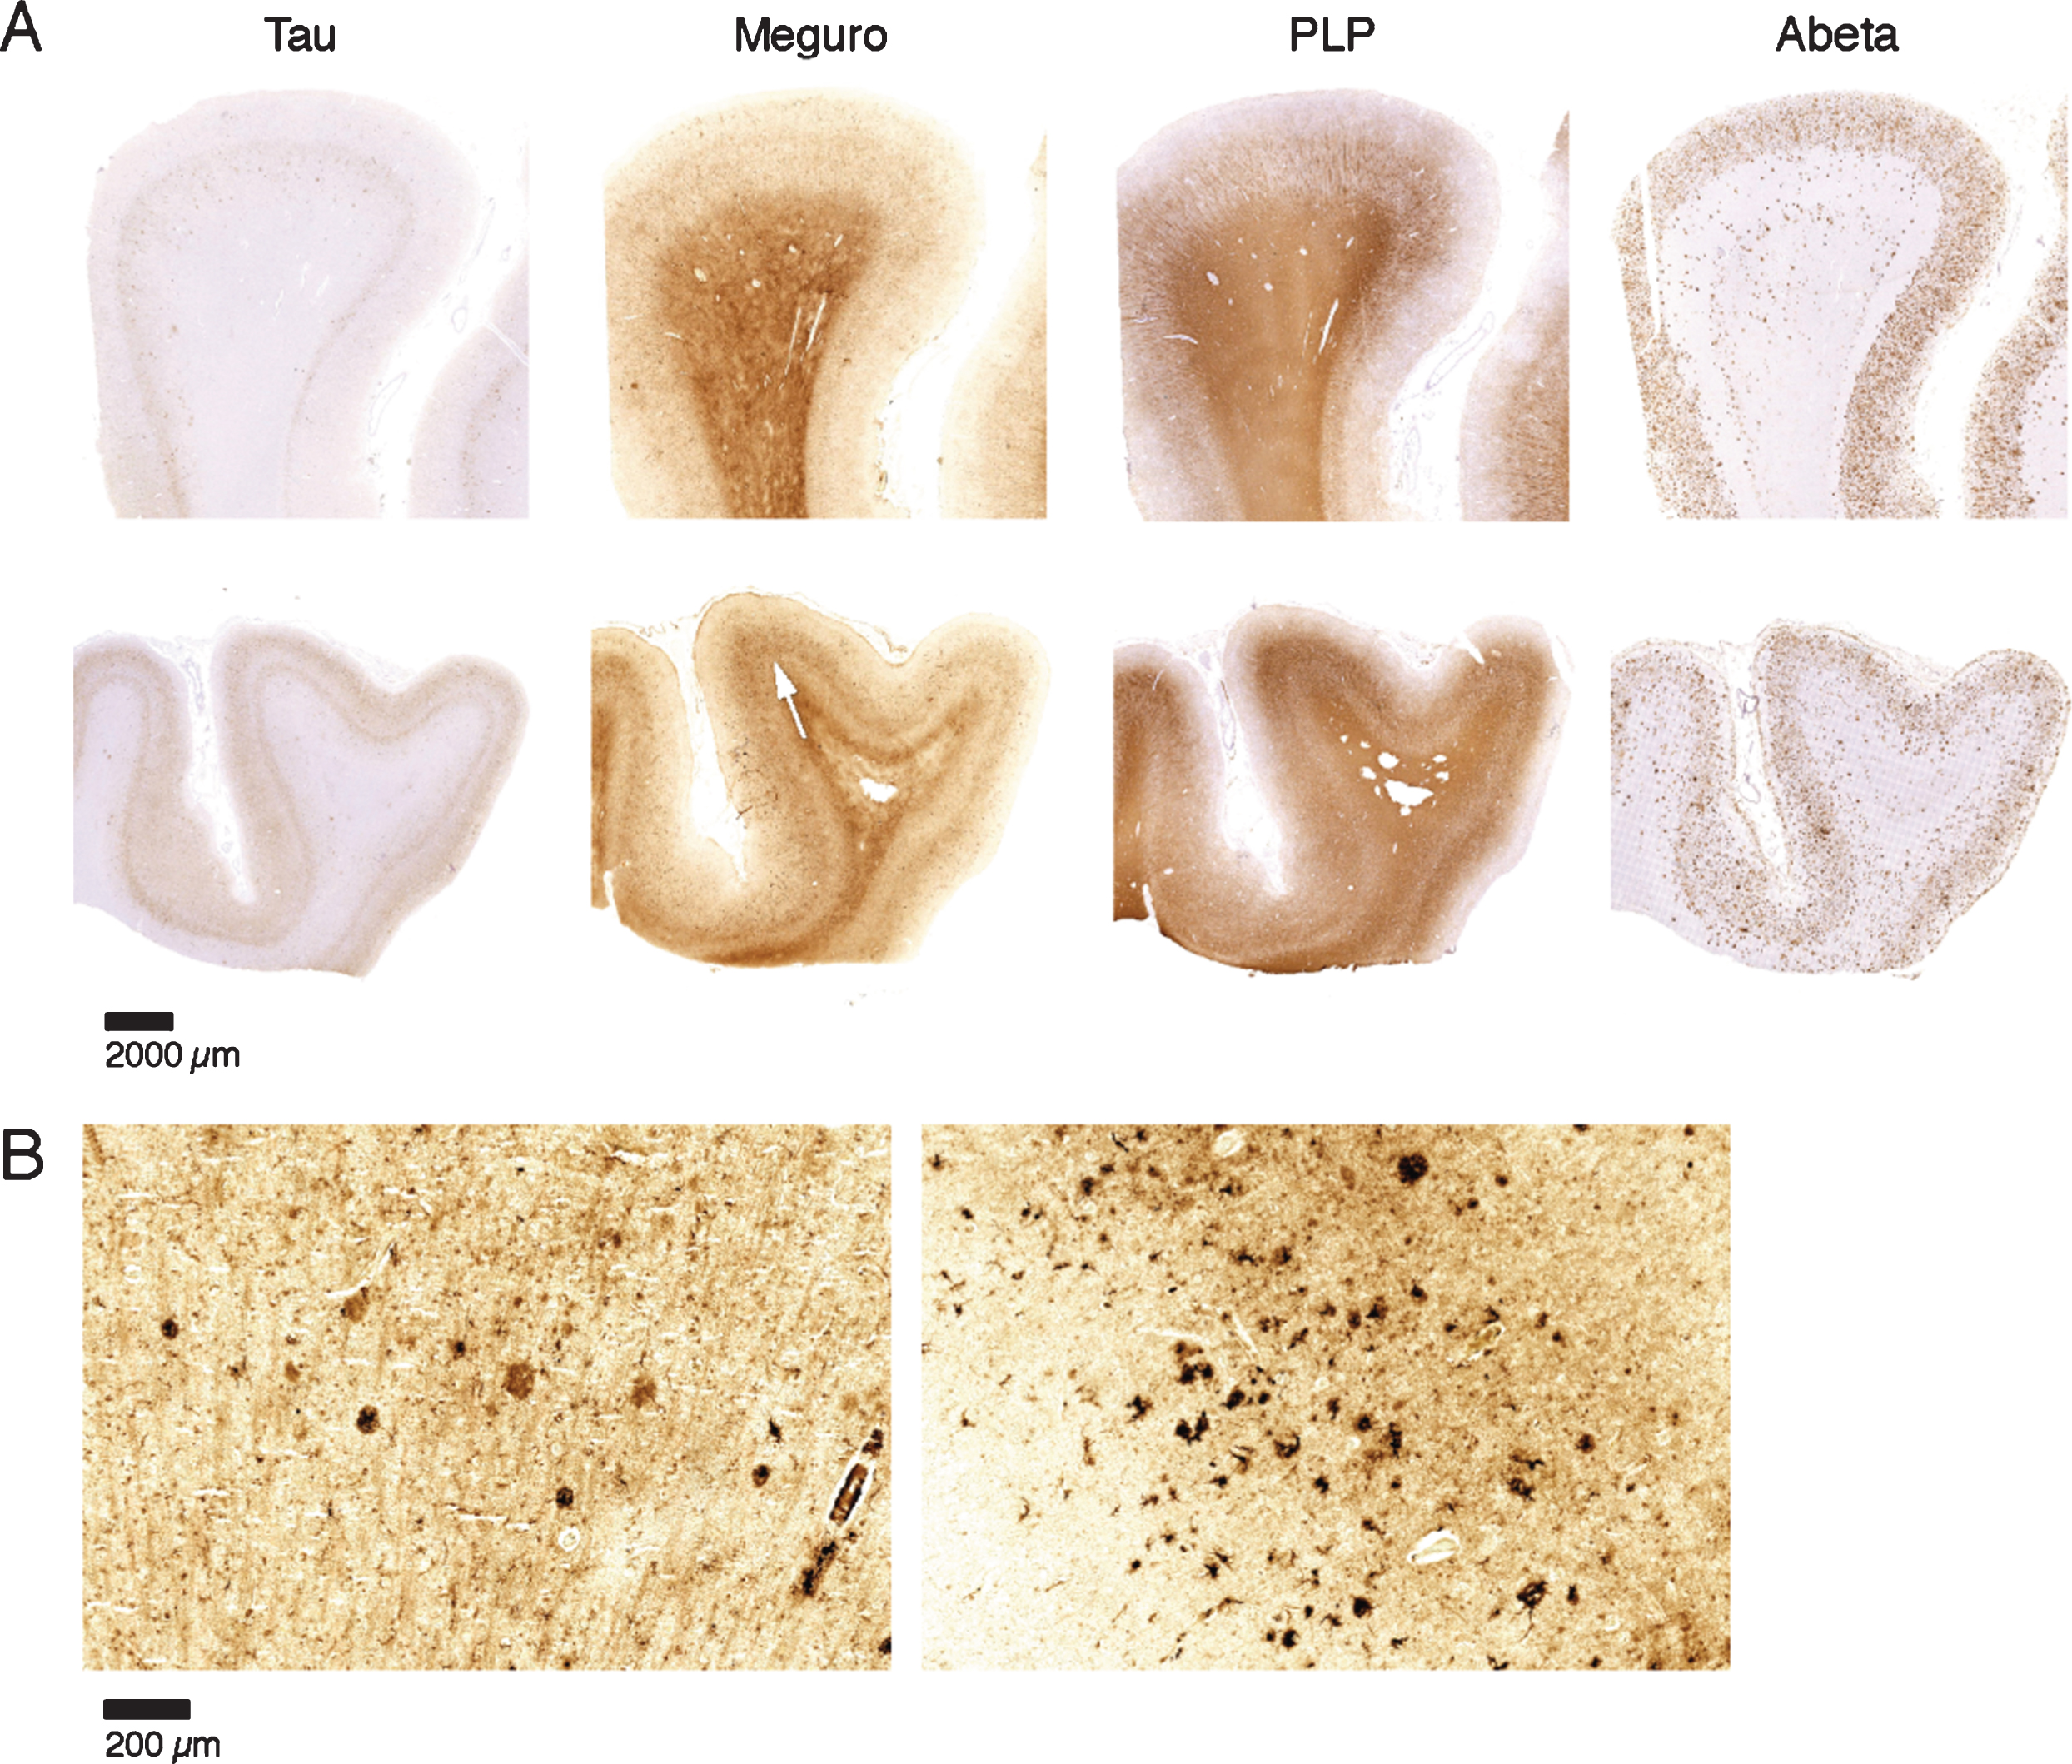
Iron accumulation in AD, related to tau pathology and Aβ plaques. A) Both patients (first and second row) show similar amounts of Aβ plaques but only the tissue with the most severe tau pathology shows a diffuse band shaped increase of iron/PLP labelling in the middle cortical layers (arrows). B) 20 μm sections of the same blocks. Cortex with the most severe tau pathology shows more iron accumulation in plaques and microglia.
DISCUSSION
Technical considerations
In the present study, we show non-heme iron accumulation in Aβ plaques and activated microglia of AD frontal cortex. This is in line with earlier studies showing iron in human Aβ plaques [17, 19, 20] and in activated microglia [14, 17, 30–33]. We did not identify iron accumulation in NFT or NT, and this is in line with most [14, 17, 19], but not all [20], previous reports. The modified Perl’s protocol we employed was also used in other studies [17, 20] and principally stains Fe 3 + but also some Fe 2 + [22, 34]. In addition to iron, other metals like copper, zinc, magnesium, and aluminum have been shown in plaques and have also been implicated in AD and plaque pathogenesis [18, 35–37]. Although the ferrocyanide that is applied in the Perl’s staining can also bind to other metals apart from iron, the precipitation of ferrocyanide with these metals does not appear to catalyze polymerization of DAB [22]. Indeed, ferrocyanide, in combination with DAB, detects iron with much higher sensitivity than copper, magnesium, zinc, or calcium [34]. This excludes a significant contribution of other metals to our visualization of iron in the tissue.
Fixation and storage of tissue in formalin could lead to leakage of iron [38]. We took care not to include tissue that had been stored for prolonged periods of time. Nevertheless, we investigated the potential impact using fixed versus fresh-frozen post-mortem tissue of the same patients on the histochemical detection of iron. Briefly-fixed frozen sections qualitatively showed a similar band of increased iron staining as in the paraffin sections. Also, iron-laden plaques and microglia could be observed, but visual comparison showed that this was not more prominent than in the paraffin sections. Therefore, we conclude that a qualitative assessment of iron accumulation in different cell types is reliable in our selected samples.
Iron and myelin
In addition to iron in Aβ plaques and microglia of AD cortex, we confirmed our preliminary observation [25] of a band-shaped increase of iron and PLP labelling in cortical layer III-V in a subset of AD patients with the most severe tau pathology, a finding we have not seen reported before. This band reflected a more crowded network of neuropil fibers with thicker and darker staining for iron and several different myelin proteins. This finding is in line with a meta-analysis by Tao et al. [39] and a recent laser-ablation inductively coupled plasma-mass spectrometry imaging study [40], both showing increased iron level in cortex of AD patients compared to controls. Interestingly, the investigators also showed a trend of increased iron along white matter fibers, including myelinated fibers in the lines of Baillarger, in AD patients [40]. This is in line with our observations of increased iron along neuropil fibers in the mid cortical layers. This qualitative observation of increased myelin staining in a late stage of AD, a neurodegenerative disease, is counter-intuitive. This study was not designed to prove this observation quantitatively, and therefore we cannot exclude the possibility that atrophy or other disease-associated tissue changes may result in better antigen retrieval or compaction of myelinated fibers. Furthermore, increased labelling of myelin proteins does not prove an increased amount of functional myelin or myelinated fibers. However, we found a consistent increase of several myelin proteins by different antibodies, making a true local myelin increase more likely.
The mechanism by which severe AD may lead to increased cortical myelin proteins is open for speculation. Re-myelination is an almost default reaction of the brain to demyelination caused by myelin damage and/or death of oligodendrocytes [41–44]. Thus, maybe the continuous severe tissue and cell damage in late stage AD leads to unbalanced de- and re-myelination. Indeed, myelin damage and restoration with increased oligodendrocyte proliferating cells (OPC) has been shown in an AD mouse model, although in the same study a decrease of OPC was found in human AD [45]. We observed a band-shaped increase of iron/myelin proteins in cortical layer III-V in a context of increased iron laden microglia. This is in line with the close relationship between iron and myelin synthesis extensively described in the literature [46, 47]. For example, activated microglia have been described to drive the recruitment and proliferation of OPC and their differentiation to oligodendrocytes, as well as the formation of a myelin sheath around available axons [41, 42, 48]. Moreover, it is thought that microglia provide the high iron concentrations needed for myelinization and oligodendrocyte differentiation [47, 49, 50].
We observed increased labelling of myelin proteins as a late phenomenon, occurring only in cortex severely affected by both Aβ plaques and tau pathology. This does not support the hypothesis of an early role of myelin dyshomeostasis in the pathogenesis of AD [1]. However, disruption of cortical myelin may contribute to the ongoing neurological deterioration in late stage AD.
Iron and microglia
In our cases, there was a clear presence of activated and iron laden microglial cells around Aβ plaques. The polarization of microglia, as in macrophages, plays an important role in the neuroinflammatory response [51]. Classically activated, or M1, microglia drive the pro-inflammatory response, whereas the alternative activation state, or M2, is apparently an anti-inflammatory state, mediating tissue maintenance and repair. In macrophages, iron accumulation can directly activate the M1 phenotype. Conversely, M2-polarized cells are thought to be involved in iron recycling by expressing molecules involved in iron uptake and export [52]. However, recent evidence shows that increased intracellular iron can alter microglia polarization to a pro-inflammatory M1 phenotype [53].
Iron and neurodegeneration
Iron accumulation is not merely a marker of neurodegeneration, but has been shown to play a crucial role in the progression of neurodegeneration through several mechanisms [54–56]. Production of reactive oxygen species leading to DNA damage and cell death is a well-known consequence of iron overload and a common feature in many neurodegenerative diseases [56]. The mechanisms behind iron dyshomeostatis are still not fully understood, but several key processes in AD have been found to be of importance. Aβ processing and regulation of intracellular iron are, e.g., both modulated by furin, thus mutually activating pro-amylogenic and intracellular iron accumulation pathways [57].
In addition, apart from driving the amyloid cascade, the intracellular complexation of a certain iron species, magnetite, with Aβ appears to have an adverse effect on neuronal network function to a much larger extent than Aβ alone [54]. Also, iron has been implicated in lipid metabolism through an interaction with Apolipoprotein E (ApoE); with the APOE ɛ4 allele inducing high levels of cerebrospinal fluid ferritin [58] and brain iron levels on MRI [55], possibly due to reduced clearance of iron because of the low affinity of APOE ɛ4 to high-density lipoprotein [58]. As such, locally high iron concentrations in AD are likely the result of an intricate disbalance of iron uptake, mediated by furin and iron-regulating elements and iron clearance through microglial lysosomal degradation and ApoE-mediated transport [36, 59], see also further reviews on this topic. The fact that transferrin and HFE mutations have a higher incidence in AD patients stresses the self-perpetuating loop caused by iron and amyloid deposition. In this context, a recent paper by Maher et al. raised the intriguing concept that iron deposition as an initiator of AD pathogenesis may not only be the result of iron-regulation gone haywire, but may also be caused by environmental factors such as airborne iron-bearing nanoparticles entering the brain through the olfactory bulb [60]. In conclusion, at this moment it appears that iron toxicity in the brain is a complex phenomenon, which may be both the cause and consequence of neurodegenerative processes. Further research should focus on the cellular localization of iron and its interaction with other mediators of AD, such as Aβ, as well as on the characterization of different iron species in the brain [61].
Iron and aging
Some [27, 62] but not all [26] quantitative studies show increased frontal cortical iron concentrations with aging. The present study was not designed to quantify iron load, but we found no changes in frontal cortical iron distribution from young to old controls without Aβ plaques. This suggests that, although there may be increased iron load in aging cortex, the distribution of frontal cortical iron remains the same. This finding is helpful if iron-based MRI changes may be used in the differentiation between an aging related disease like AD and aging.
Iron and APOE
APOE ɛ4 is a well-known risk factor for AD and has recently been shown to correlate with ferritin levels in cerebrospinal fluid of APOE ɛ4 carriers [58]. Van Bergen et al. (2016) demonstrated that magnetic susceptibility, as measured with MRI, was significantly higher in APOE ɛ4 carriers with mild cognitive impairment (MCI) compared to MCI patients with other APOE variants [55]. These results confirm the hypothesis that the APOE ɛ4 allele may increase the risk of developing AD via brain iron accumulation. In our study, we unfortunately only had DNA available for 8/10 of our AD patients, of which 2 were ɛ4/ɛ4, 5 were ɛ4/ɛ3, and only 1 ɛ3/ɛ3. As expected, APOE ɛ4 was highly prevalent in these patients and the APOE ɛ3/ɛ3 patient showed frontal cortical iron accumulations similar to the others. However, our sample size was too small, and thus our data do not allow any conclusion to be drawn about a relation between APOE status and frontal cortical iron accumulations. Lastly, besides APOE status, mutations in some iron-regulating genes, such as HFE (hemochromatosis), are also known to associate with age of onset in AD [63]. Future studies correlating iron-related genetic variants to brain iron accumulation would be of interest.
Iron and AD pathology
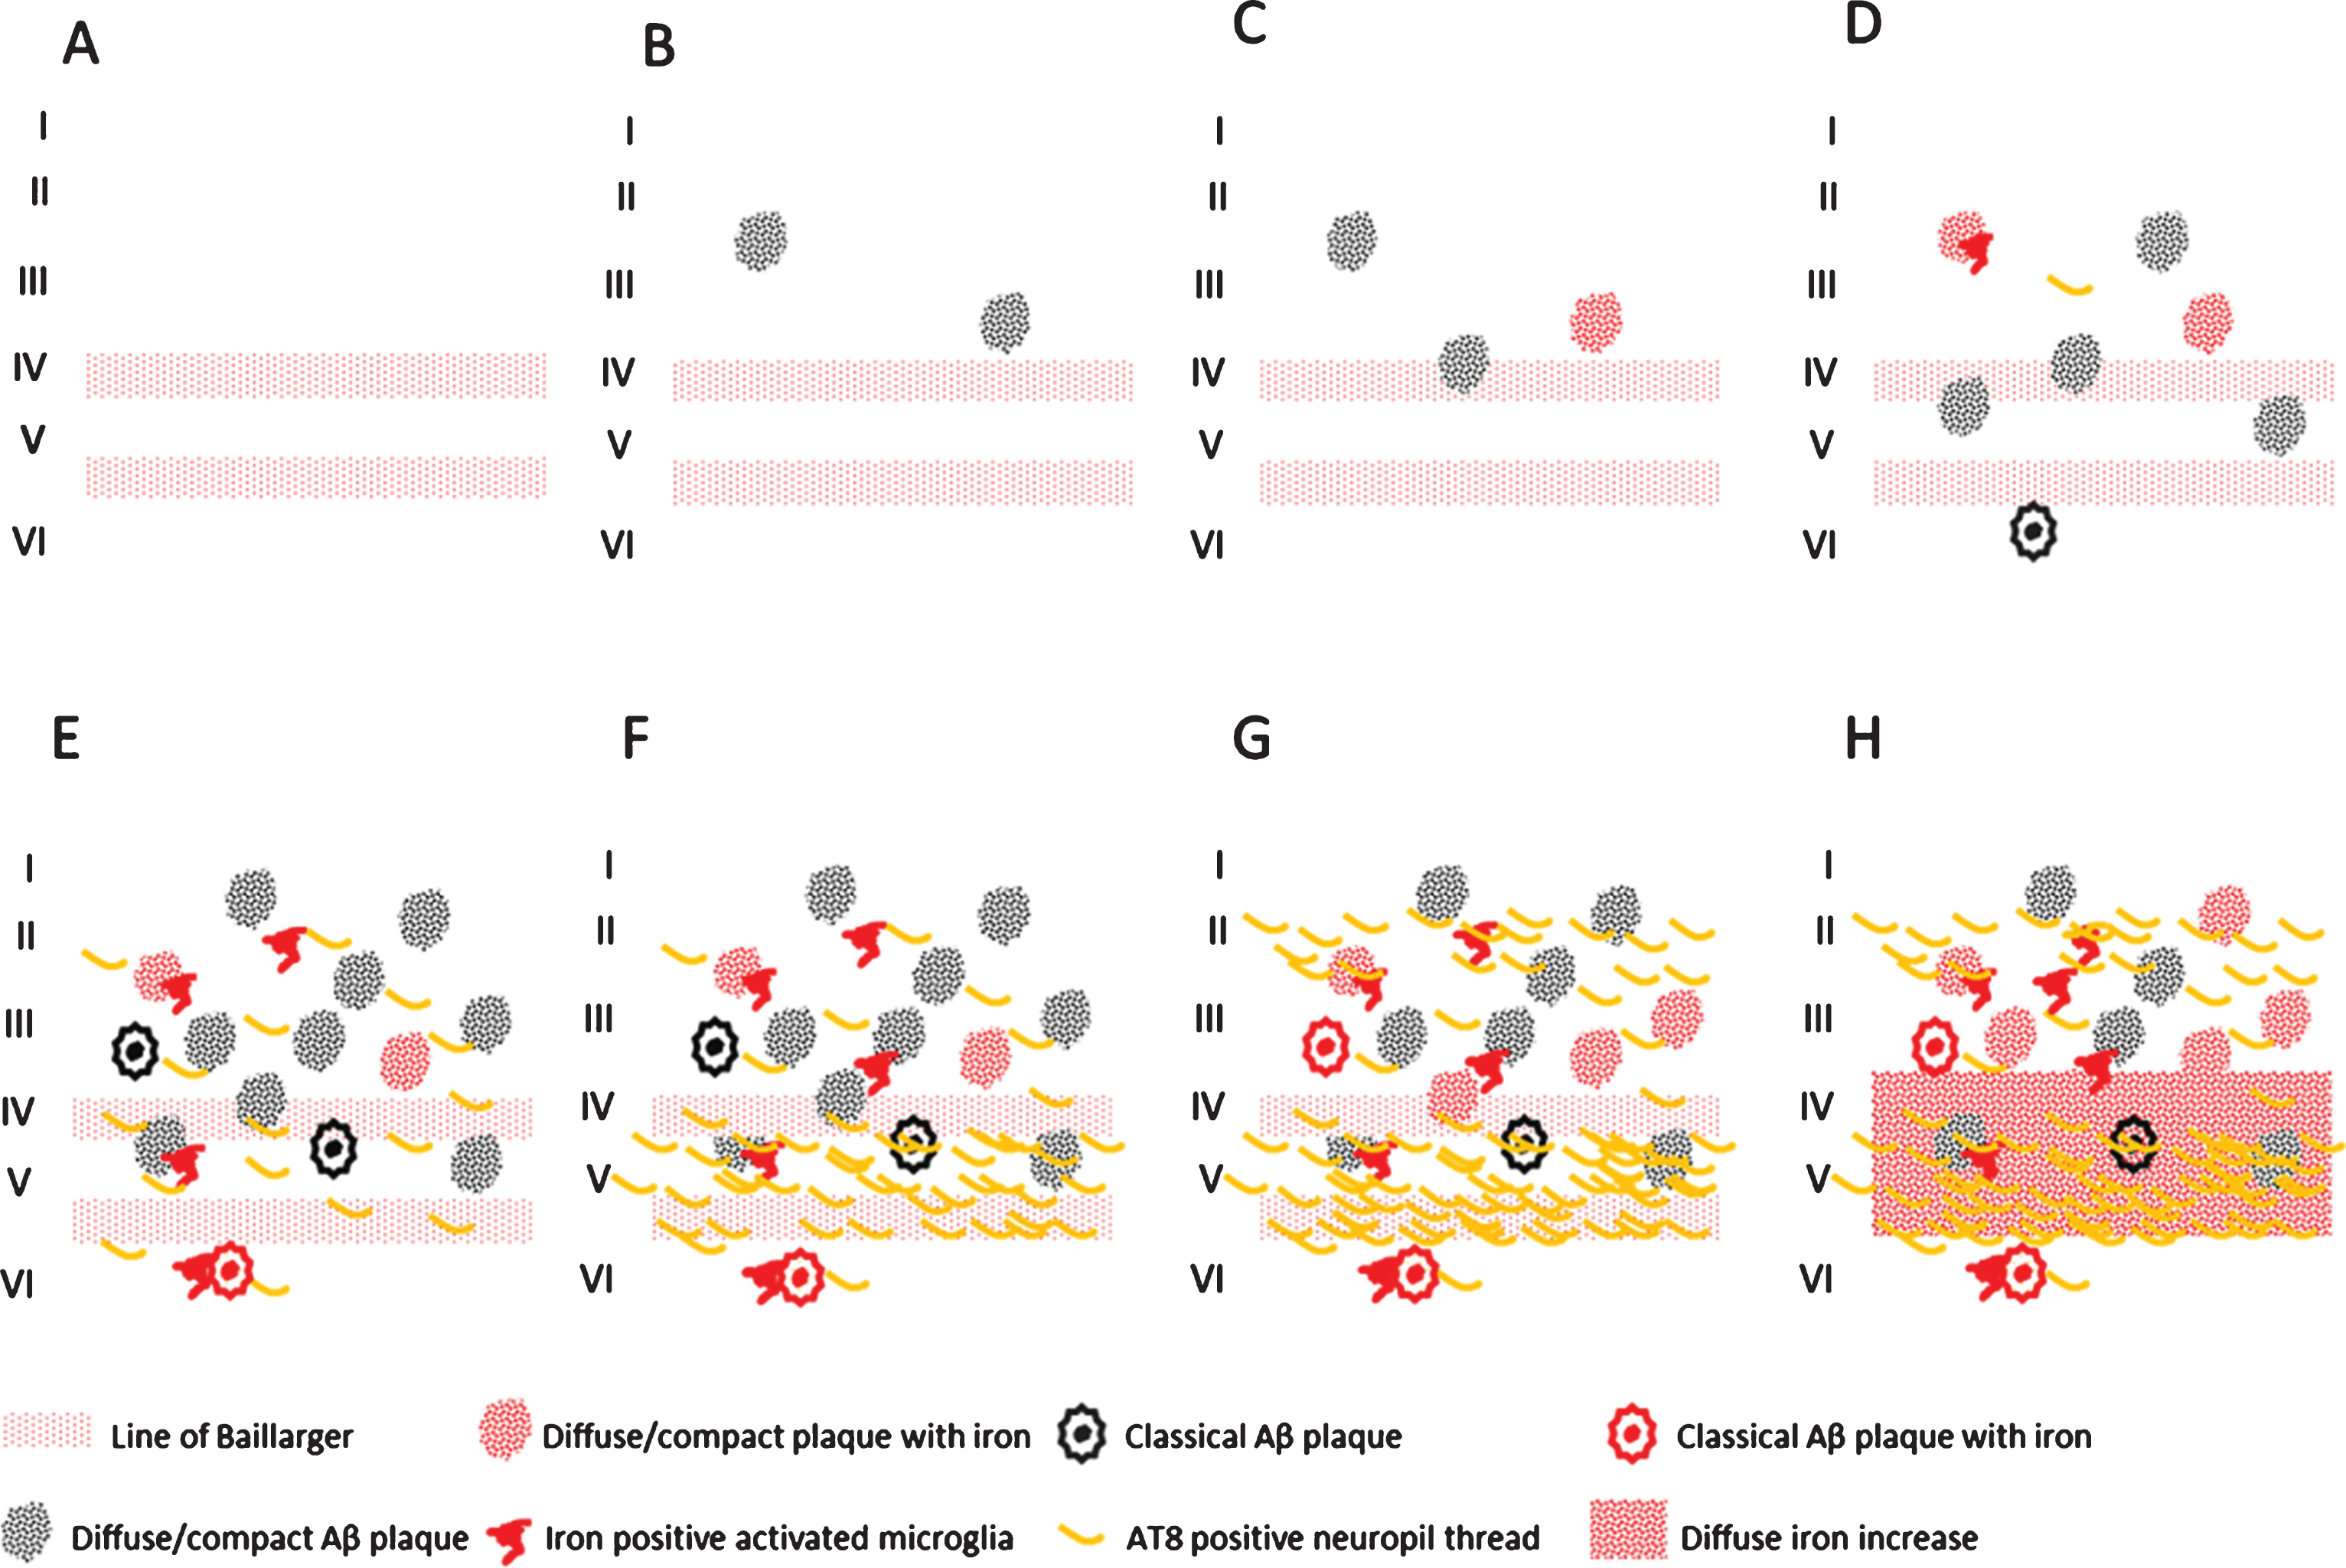
Finally, we showed a statistically significant correlation between iron accumulations (in Aβ plaques/microglia and myelinated fibers in the mid cortical layers) and the amount of Aβ plaques and tau pathology, as well as between these iron accumulations and Braak stage. To our knowledge, this is the first report that correlates frontal cortical iron accumulations with Braak stage and local tau pathology. This opens the possibility to grade the severity of AD pathology by MR in vivo. In Fig. 5, we schematically represent the different combinations of AD pathology and pathological iron accumulations we encountered. These combinations suggest that histochemically detectable iron accumulation is secondary to Aβ plaques and tau pathology and follows its progression. In controls, iron accumulation only occurs in the presence of Aβ plaques and the amount of iron accumulation is correlated to the amount of Aβ plaques. For AD, Aβ plaque load does not increase much from Braak IV to VI, but iron accumulation and tau pathology both progress. The band shaped increase of diffuse iron-/myelin protein labelling in cortical layer III-V especially appears to be a late phenomenon, occurring when several cortical layers, especially layer V and II/outer III are heavily involved by tau pathology.
Fig.5
Schematic representation of the observed combinations of AD pathology and iron accumulation in frontal cortex. A) Aging without plaques or tau pathology. B) Controls with little diffuse plaques without iron accumulation. C, D) Controls with increasing iron accumulation in plaques and microglia depending on the amount of plaques. E) AD with high Aβ plaque load and diffuse limited increase of tau pathology with increased iron accumulation. F-H) Similar high plaque load with increasing tau pathology and iron accumulation.
Conclusion
The presented data show a correlation between frontal cortical iron accumulation and AD pathology independent of age. Iron is not only accumulated in Aβ plaques but also in activated microglia and in myelinated fibers in the middle cortical layers with increased labelling of myelin proteins. Ex vivo MRI has shown iron related hypo-intensities in iron rich cortical myelin tracts and iron accumulation in microglia and Aβ plaques [13, 64, 65], suggesting the potential to detect these iron rich cortical areas with in vivo MRI. Complementary work from our lab showed that changes in iron and in myelin organization co-localize on a pixel-by-pixel basis to MRI contrast changes, demonstrating that iron is a major source of cortical MRI contrast in AD (data submitted for publication). The direct clinical relevance of these findings is supported by an earlier study in which high field susceptibility-weighted MR already demonstrated that iron-related MR contrast was detectable in human subjects, and shows different contrast between controls, patients with cognitive impairment, and patients with clinically diagnosed AD [7]. Thus, iron imaging with MR reflects multiple aspects of AD pathology beyond Aβ plaques, and therefore offers complementary in vivo imaging possibilities beyond PiB-PET amyloid and tau-PET imaging.
ACKNOWLEDGMENTS
This work was in part supported by a project grant from the EU Seventh Framework Programme: FP7-PEOPLE-2013-IAPP (612360 –BRAINPATH).
Authors’ disclosures available online (http://j-alz.com/manuscript-disclosures/16-1143r2).
REFERENCES
[1] | Jack CR Jr , Knopman DS , Jagust WJ , Shaw LM , Aisen PS , Weiner MW , Petersen RC , Trojanowski JQ ((2010) ) Hypothetical model of dynamic biomarkers of the Alzheimer’s pathological cascade. Lancet Neurol 9: , 119–128. |
[2] | Nelson PT , Braak H , Markesbery WR ((2009) ) Neuropathology and cognitive impairment in Alzheimer disease: A complex but coherent relationship. J Neuropathol Exp Neurol 68: , 1–14. |
[3] | Engler H , Forsberg A , Almkvist O , Blomquist G , Larsson E , Savitcheva I , Wall A , Ringheim A , Långström B , Nordberg A ((2006) ) Two-year follow-up of amyloid deposition inpatients with Alzheimer’s disease. Brain 129: , 2856–2866. |
[4] | Klunk WE , Engler H , Nordberg A , Wang Y , Blomqvist G , Holt DP , Bergström M , Savitcheva I , Huang GF , Estrada S , Ausén B , Debnath ML , Barletta J , Price JC , Sandell J , Lopresti BJ , Wall A , Koivisto P , Antoni G , Mathis CA , Långström B ((2004) ) Imaging brain amyloid in Alzheimer’s disease with PittsburghCompound-B. Ann Neurol 55: , 306–319. |
[5] | Rowe CC , Ng S , Ackermann U , Gong SJ , Pike K , Savage G , Cowie TF , Dickinson KL , Maruff P , Darby D , Smith C , Woodward M , Merory J , Tochon-Danguy H , O’Keefe G , Klunk WE , Mathis CA , Price JC , Masters CL , Villemagne VL ((2007) ) Imaging beta-amyloid burden in aging and dementia. Neurology 68: , 1718–1725. |
[6] | Rowe CC , Villemagne VL ((2011) ) Brain amyloid imaging. J Nucl Med 52: , 1733–1740. |
[7] | van Rooden S , Versluis MJ , Liem MK , Milles J , Maier AB , Oleksik AM , Webb AG , van Buchem MA , van der Grond J ((2014) ) Cortical phase changes in Alzheimer’s disease at 7T MRI: A novel imaging marker. Alzheimers Dement 10: , e19–e26. |
[8] | Ogg RJ , Langston JW , Haacke EM , Steen RG , Taylor JS ((1999) ) The correlation between phase shifts in gradient-echo MR images and regional brain iron concentration. Magn Reson Imaging 17: , 1141–1148. |
[9] | Jack CR Jr , Garwood M , Wengenack TM , Borowski B , Curran GL , Lin J , Adriany G , Gröhn OH , Grimm R , Poduslo JF ((2004) ) In vivo visualization of Alzheimer’s amyloid plaques by magnetic resonance imaging in transgenic mice without a contrast agent. Magn Reson Med 52: , 1263–1271. |
[10] | Jack CR Jr , Wengenack TM , Reyes DA , Garwood M , Curran GL , Borowski BJ , Lin J , Preboske GM , Holasek SS , Adriany G , Poduslo JF ((2005) ) In vivo magnetic resonance microimaging of individual amyloid plaques in Alzheimer’s transgenic mice. J Neurosci 25: , 10041–10048. |
[11] | Vanhoutte G , Dewachter I , Borghgraef P , Van Leuven F , Van der Linden A ((2005) ) Noninvasive in vivo MRI detection of neuritic plaques associated with iron in APP[V717I] transgenic mice, a model for Alzheimer’s disease. Magn Reson Med 53: , 607–613. |
[12] | Benveniste H , Einstein G , Kim KR , Hulette C , Johnson GA ((1999) ) Detection of neuritic plaques in Alzheimer’s disease by magneticresonance microscopy. Proc Natl Acad Sci U S A 96: , 14079–14084. |
[13] | Meadowcroft MD , Connor JR , Smith MB , Yang QX ((2009) ) MRI and histological analysis of beta-amyloid plaques in both human Alzheimer’s disease and APP/PS1 transgenic mice. J Magn Reson Imaging 29: , 997–1007. |
[14] | Connor JR , Menzies SL , St Martin SM , Mufson EJ ((1992) ) A histochemical study of iron, transferrin, and ferritin in Alzheimer’s diseased brains. J Neurosci Res 31: , 75–83. |
[15] | Falangola MF , Lee SP , Nixon RA , Duff K , Helpern JA ((2005) ) Histological co-localization of iron in Abeta plaques of PS/APP transgenic mice. Neurochem Res 30: , 201–205. |
[16] | Grundke-Iqbal I , Fleming J , Tung YC , Lassmann H , Iqbal K , Joshi JG ((1990) ) Ferritin is a component of the neuritic (senile) plaque in Alzheimer dementia. Acta Neuropathol 81: , 105–110. |
[17] | LeVine SM ((1997) ) Iron deposits in multiple sclerosis and Alzheimer’s disease brains. Brain Res 760: , 298–303. |
[18] | Lovell MA , Robertson JD , Teesdale WJ , Campbell JL , Markesbery WR ((1998) ) Copper, iron and zinc in Alzheimer’s disease senile plaques. J Neurol Sci 158: , 47–52. |
[19] | Nabuurs RJ , Hegeman I , Natté R , van Duinen SG , van Buchem MA , van der Weerd L , Webb AG ((2011) ) High-field MRI of single histological slices using an inductively coupled, self-resonant microcoil: Application to ex vivo samples of patients with Alzheimer’s disease. NMR Biomed 24: , 351–357. |
[20] | Smith MA , Harris PL , Sayre LM , Perry G ((1997) ) Iron accumulation inAlzheimer disease is a source of redox-generated free radicals. Proc Natl Acad Sci U S A 94: , 9866–9868. |
[21] | El Tannir El Tayara N , Delatour B , Le Cudennec C , Guégan M , Volk A , Dhenain M ((2006) ) Age-related evolution of amyloid burden, iron load, and MR relaxation times in a transgenic mouse model of Alzheimer’s disease. Neurobiol Dis 22: , 199–208. |
[22] | Meguro R , Asano Y , Odagiri S , Li C , Iwatsuki H , Shoumura K ((2007) ) Nonheme-iron histochemistry for light and electron microscopy: A historical, theoretical and technical review. Arch Histol Cytol 70: , 1–19. |
[23] | House MJ , St Pierre TG , Kowdley KV , Montine T , Connor J , Beard J , Berger J , Siddaiah N , Shankland E , Jin LW ((2007) ) Correlation ofproton transverse relaxation rates (R2) with iron concentrationsin postmortem brain tissue from Alzheimer’s disease patients. Magn Reson Med 57: , 172–180. |
[24] | van Rooden S , Maat-Schieman ML , Nabuurs RJ , van der Weerd L , van Duijn S , van Duinen SG , Natté R , van Buchem MA , van der Grond J ((2009) ) Cerebral amyloidosis: Postmortem detection with human 7.0-T MR imaging system. Radiology 253: , 788–796. |
[25] | van Duijn S , Nabuurs RJ , van Duinen SG , Natté R ((2013) ) Comparison of histological techniques to visualize iron in paraffin-embedded brain tissue of patients with Alzheimer’s disease. J Histochem Cytochem 61: , 785–792. |
[26] | Hallgren B , Sourander P ((1958) ) The effect of age on the non-haemin iron in the human brain. J Neurochem 3: , 41–51. |
[27] | Ramos P , Santos A , Pinto NR , Mendes R , Magalhäes T , Almeida A ((2014) ) Iron levels in the human brain: Aost-mortem study of anatomical region differences and age-related changes. J Trace Elem Med Biol 28: , 13–17. |
[28] | Alafuzoff I , Arzberger T , Al-Sarraj S , Bodi I , Bogdanovic N , Braak H , Bugiani O , Del-Tredici K , Ferrer I , Gelpi E , Giaccone G , Graeber MB , Ince P , Kamphorst W , King A , Korkolopoulou P , Kovács GG , Larionov S , Meyronet D , Monoranu C , Parchi P , Patsouris E , Roggendorf W , Seilhean D , Tagliavini F , Stadelmann C , Streichenberger N , Thal DR , Wharton SB , Kretzschmar H ((2008) ) Staging of neurofibrillary pathology in Alzheimer’s disease: A study of the Brain Net Europe Consortium. Brain Pathol 18: , 484–496. |
[29] | Torsten H , Kurt H , van de Wiel M , Achim Z ((2008) ) Implementing aClass of Permutation Tests: The coin Package. J Stat Softw 28: , 1–23. |
[30] | Hughes V ((2012) ) Microglia: The constant gardeners. Nature 485: , 570–572. |
[31] | Lue LF , Kuo YM , Beach T , Walker DG ((2010) ) Microglia activation and anti-inflammatory regulation in Alzheimer’s disease. Mol Neurobiol 41: , 115–128. |
[32] | Carpenter AF , Carpenter PW , Markesbery WR ((1993) ) Morphometricanalysis of microglia in Alzheimer’s disease. J NeuropatholExp Neurol 52: , 601–608. |
[33] | Kreutzberg GW ((1996) ) Microglia: A sensor for pathological events in the CNS. Trends Neurosci 19: , 312–318. |
[34] | Roschzttardtz H , Conéjéro G , Curie C , Mari S ((2009) ) Identification of the endodermal vacuole as the iron storage compartment in the Arabidopsis embryo. Plant Physiol 151: , 1329–1338. |
[35] | Leskovjan AC , Lanzirotti A , Miller LM ((2009) ) Amyloid plaques in PSAPP mice bind less metal than plaques in human Alzheimer’s disease. Neuroimage 47: , 1215–1220. |
[36] | Meadowcroft MD , Connor JR , Yang QX ((2015) ) Cortical iron regulation and inflammatory response in Alzheimer’s disease and APPSWE/PS1ΔE9 mice: A histological perspective. Front Neurosci 9: , 255. |
[37] | Miller LM , Wang Q , Telivala TP , Smith RJ , Lanzirotti A , Miklossy J ((2006) ) Synchrotron-based infrared and X-ray imaging shows focalized accumulation of Cu and Zn co-localized with beta-amyloid deposits in Alzheimer’s disease. J Struct Biol 155: , 30–37. |
[38] | Hare DJ , George JL , Bray L , Volitakis I , Vais A , Ryan TM , Cherny RA , Bush AI , Masters CL , Adlard PA , Doble PA , Finkelstein DI ((2014) ) The effect of paraformaldehyde fixation and sucrose cryoprotection on metal concentration in murine neurological tissue. J Anal At Spectrom 29: , 565–570. |
[39] | Tao Y , Wang Y , Rogers JT , Wang F ((2014) ) Perturbed iron distribution in Alzheimer’s disease serum, cerebrospinal fluid, and selected brain regions: A systematic review and meta-analysis. J Alzheimers Dis 42: , 679–690. |
[40] | Hare DJ , Raven EP , Roberts BR , Bogeski M , Portbury SD , McLean CA , Masters CL , Connor JR , Bush AI , Crouch PJ , Doble PA ((2016) ) Laser ablation-inductively coupled plasma-mass spectrometry imaging of white and gray matter iron distribution in Alzheimer’s disease frontal cortex. Neuroimage 137: , 124–131. |
[41] | Crawford AH , Chambers C , Franklin RJ ((2013) ) Remyelination: The true regeneration of the central nervous system. J Comp Pathol 149: , 242–254. |
[42] | Gudi V , Gingele S , Skripuletz T , Stangel M ((2014) ) Glial response during cuprizone-induced de- and remyelination in the CNS: Lessons learned. Front Cell Neurosci 8: , 73. |
[43] | Nave KA ((2010) ) Myelination and the trophic support of long axons. Nat Rev Neurosci 11: , 275–283. |
[44] | Franklin RJ , Ffrench-Constant C ((2008) ) Remyelination in the CNS: From biology to therapy. Nat Rev Neurosci 9: , 839–855. |
[45] | Behrendt G , Baer K , Buffo A , Curtis MA , Faull RL , Rees MI , Gotz M , Dimou L ((2013) ) Dynamic changes in myelin aberrations and oligodendrocyte generation in chronic amyloidosis in mice and men. Glia 61: , 273–286. |
[46] | Connor JR , Menzies SL ((1996) ) Relationship of iron to oligodendrocytes and myelination. Glia 17: , 83–93. |
[47] | Todorich B , Pasquini JM , Garcia CI , Paez PM , Connor JR ((2009) ) Oligodendrocytes and myelination: The role of iron. Glia 57: , 467–478. |
[48] | Miron VE , Franklin RJ ((2014) ) Macrophages and CNS remyelination. J Neurochem 130: , 165–171. |
[49] | Schonberg DL , Goldstein EZ , Sahinkaya FR , Wei P , Popovich PG , McTigue DM ((2012) ) Ferritin stimulates oligodendrocyte genesis inthe adult spinal cord and can be transferred from macrophages toNG2 cells in vivo. J Neurosci 32: , 5374–5384. |
[50] | Schonberg DL , McTigue DM ((2009) ) Iron is essential for oligodendrocyte genesis following intraspinal macrophage activation. Exp Neurol 218: , 64–74. |
[51] | Cherry JD , Olschowka JA , O’Banion MK ((2014) ) Neuroinflammation and M2 microglia: The good, the bad, and the inflamed. J Neuroinflammation 11: , 98. |
[52] | Corna G , Campana L , Pignatti E , Castiglioni A , Tagliafico E , Bosurgi L , Campanella A , Brunelli S , Manfredi AA , Apostoli P , Silvestri L , Camaschella C , Rovere-Querini P ((2010) ) Polarization dictates iron handling by inflammatory and alternatively activated macrophages. Haematologica 95: , 1814–1822. |
[53] | Kroner A , Greenhalgh AD , Zarruk JG , Passos Dos Santos R , Gaestel M , David S ((2014) ) TNF and increased intracellular iron alter macrophage polarization to a detrimental M1 phenotype in the injured spinal cord. Neuron 83: , 1098–1116. |
[54] | Teller S , Tahirbegi IB , Mir M , Samitier J , Soriano J ((2015) ) Magnetite-Amyloid-β deteriorates activity and functional organization in an in vitro model for Alzheimer’s disease. Sci Rep 5: , 17261. |
[55] | van Bergen JM , Li X , Hua J , Schreiner SJ , Steininger SC , Quevenco FC , Wyss M , Gietl AF , Treyer V , Leh SE , Buck F , Nitsch RM , Pruessmann KP , van Zijl PC , Hock C , Unschuld PG ((2016) ) Colocalization of cerebral ironwith Amyloid beta in Mild Cognitive Impairment. Sci Rep 6: , 35514. |
[56] | Zecca L , Youdim MB , Riederer P , Connor JR , Crichton RR ((2004) ) Iron, brain ageing and neurodegenerative disorders. Nat Rev Neurosci 5: , 863–873. |
[57] | Silvestri L , Pagani A , Camaschella C ((2008) ) Furin-mediated release of soluble hemojuvelin: A new link between hyoxia and iron homeostasis. Blood 111: , 924–931. |
[58] | Ayton S , Faux NG , Bush AI ; Alzheimer’s Disease Neuroimaging Initiative ((2015) ) Ferritin levels in the cerebrospinal fluid predict Alzheimer’s disease outcomes and are regulated by APOE. Nat Commun 6: , 6760. |
[59] | Ward RJ , Zucca FA , Duyn JH , Crichton RR , Zecca L ((2014) ) The role of iron in brain ageing and neurodegenerative disorders. Lancet Neurol 13: , 1045–1060. |
[60] | Maher BA , Ahmed IA , Karloukovski V , MacLaren DA , Foulds PG , Allsop D , Mann DM , Torres-Jardon R , Calderon-Garciduenas L ((2016) ) Magnetite pollution nanoparticles in the human brain. Proc Natl Acad Sci U S A 113: , 10797–10801. |
[61] | Kumar P , Bulk M , Webb A , van der Weerd L , Oosterkamp TH , Huber M , Bossoni L ((2016) ) A novel approach to quantify different iron forms in ex-vivo human brain tissue. Sci Rep 6: , 38916. |
[62] | Connor JR , Snyder BS , Arosio P , Loeffler DA , LeWitt P ((1995) ) A quantitative analysis of isoferritins in select regions of aged, parkinsonian, and Alzheimer’s diseased brains. J Neurochem 65: , 717–724. |
[63] | Ali-Rahmani F , Schengrund CL , Connor JR ((2014) ) HFE gene variants, iron, and lipids: A novel connection in Alzheimer’s disease. Front Pharmacol 5: , 165. |
[64] | Fukunaga M , Li TQ , van Gelderen P , de Zwart JA , Shmueli K , Yao B , Lee J , Maric D , Aronova MA , Zhang G , Leapman RD , Schenck JF , Merkle H , Duyn JH ((2010) ) Layer-specific variation of iron contentin cerebral cortex as a source of MRI contrast. Proc NatlAcad Sci U S A 107: , 3834–3839. |
[65] | Zeineh MM , Chen Y , Kitzler HH , Hammond R , Vogel H , Rutt BK ((2015) ) Activated iron-containing microglia in the human hippocampus identified by magnetic resonance imaging in Alzheimer disease. Neurobiol Aging 36: , 2483–2500. |

