Group-ICA model order highlights patterns of functional brain connectivity
- 1 Department of Diagnostic Radiology, Oulu University Hospital, Oulu, Finland
- 2 Valkee Ltd., Oulu, Finland
- 3 Institute of Health Sciences and General Practice, University of Oulu, Oulu, Finland
- 4 Oulu Health Centre, Oulu, Finland
Resting-state networks (RSNs) can be reliably and reproducibly detected using independent component analysis (ICA) at both individual subject and group levels. Altering ICA dimensionality (model order) estimation can have a significant impact on the spatial characteristics of the RSNs as well as their parcellation into sub-networks. Recent evidence from several neuroimaging studies suggests that the human brain has a modular hierarchical organization which resembles the hierarchy depicted by different ICA model orders. We hypothesized that functional connectivity between-group differences measured with ICA might be affected by model order selection. We investigated differences in functional connectivity using so-called dual regression as a function of ICA model order in a group of unmedicated seasonal affective disorder (SAD) patients compared to normal healthy controls. The results showed that the detected disease-related differences in functional connectivity alter as a function of ICA model order. The volume of between-group differences altered significantly as a function of ICA model order reaching maximum at model order 70 (which seems to be an optimal point that conveys the largest between-group difference) then stabilized afterwards. Our results show that fine-grained RSNs enable better detection of detailed disease-related functional connectivity changes. However, high model orders show an increased risk of false positives that needs to be overcome. Our findings suggest that multilevel ICA exploration of functional connectivity enables optimization of sensitivity to brain disorders.
Introduction
Magnetic resonance imaging (MRI) has developed rapidly during recent years, enabling very accurate structural and functional inferences of neurological and psychiatric diseases. Functional MRI (fMRI) enables the detection of task responses as well as spontaneous interregional connectivity assessment of the living human brain without invasive or radioactive methodology. Resting-state functional connectivity analyses study similarities in the temporal behavior of blood oxygen level dependent (BOLD) signal fluctuations in different brain regions (Biswal et al., 1995; Cordes et al., 2000; Lowe et al., 2000; Greicius et al., 2003; Beckmann et al., 2005; Fox et al., 2005). Coherent spatial patterns of low-frequency (<0.1 Hz) fluctuations in the resting-state BOLD signal are referred to as a functional network. Alterations in functional connectivity of such networks are suggested to precede both structural changes and clinical symptoms (Greicius et al., 2004; Filippini et al., 2009). A number of studies have used independent component analysis (ICA) approaches to measure functional connectivity in clinical populations such as Alzheimer’s disease or dementia (Greicius et al., 2004; Rombouts et al., 2009; Seeley et al., 2009), schizophrenia (Jafri et al., 2008; Calhoun et al., 2009), depression (Anand et al., 2005; Greicius et al., 2007; Chen et al., 2008; Zhou et al., 2009; Sheline et al., 2010), epilepsy (Zhang et al., 2009), Huntington’s disease (Wolf et al., 2008), and amyotrophic lateral sclerosis (Mohammadi et al., 2009).
Independent component analysis as a blind source separation technique has become a major data-driven analysis tool for fMRI studies (McKeown et al., 1998; Biswal and Ulmer, 1999; Calhoun et al., 2001; Kiviniemi et al., 2003). It is an explorative data analysis method that produces a number of spatial maps (spatial components) and corresponding time courses (Calhoun et al., 2001). Generally, spatial ICA is a more appropriate method than time-domain ICA for analyzing resting-state fMRI data, given the small number of time points and large number of voxels (spatial samples) included in most fMRI datasets. Resting-state networks (RSNs) can be reliably and reproducibly detected using ICA at individual subject and group levels (Greicius et al., 2004; Damoiseaux et al., 2006; Shehzad et al., 2009; Zuo et al., 2010). Generally, the identification of meaningful neurophysiological spatial components is usually performed either by spatial correlation with a predefined template (Greicius et al., 2003; Van de Ven et al., 2004; Calhoun et al., 2008) or by visual inspection (Damoiseaux et al., 2006; DeLuca et al., 2006; Harrison et al., 2008).
Importantly, altering the dimensionality (model order) estimation in ICA can have a significant impact on the spatial characteristics of the RSNs identified (Abou Elseoud et al., 2010). Accordingly, ICA results may be “split” into a number of sub-networks, depending on the parameters of the analysis (e.g., model order selection). Notably, the process of ICA model order selection is somewhat arbitrary (i.e., one has to tell ICA how many components to estimate), depending on a number of factors, e.g., data quality (Strother et al., 2002, 2010), time points i.e., if one does not perform data reduction, the interpretation of the component maps can be a very time consuming task and a large majority of these maps are not useful (Calhoun et al., 2004), field strength (as the signal-to-noise ratio of BOLD signal increases with field strength), number of subjects (Yourganov et al., 2010), and regions or functions of interest (Kiviniemi et al., 2009; Abou Elseoud et al., 2010). In addition, automatic model order estimation may not be reliable enough to be implemented as a standard methodology (Yourganov et al., 2010), especially when comparing different studies of a given disease.
The decomposability of a network can be measured using modularity (Guimerà et al., 2004; Newman and Girvan, 2004), which can be used as a merit function to find the optimal partition of a network. There is strong evidence of brain modularity (Bullmore and Sporns 2009), arising from recent human neuroimaging studies showing anatomical (Chen et al., 2008) and functional (Ferrarini et al., 2009; Meunier et al., 2009a, 2009b) evidences for modularity of brain networks. Animal studies have supported such hierarchical organization (Hilgetag et al., 2000; Schwarz et al., 2008). The underlying functional mechanisms of the modularity of brain networks could be explained by the free-energy principle (Friston, 2009). Brain modularity, as shown by the free-energy principle, is essential for transmitting prediction errors to higher cortical areas, which use these errors to update an internal model that generates top–down predictions of sensory inputs (Friston, 2009, 2010). Meunier et al. (2009b) applied a computational algorithm to derive a hierarchical modular decomposition of human brain networks using fMRI. Eight large modules were depicted at the highest level of the hierarchy, each compromising more than 10 nodes. While at the lowest level, there were 57 sub-modules. Notably, these results stand very similar to ICA decompositions obtained at low model orders (where large-scale networks represent the large modules) as well as at high model orders (where fine-grained sub-networks represent the sub-modules).
Independent component analysis studies in clinical populations have reported functional connectivity differences, but the use of different ICA model orders makes the comparison of these results difficult. Previously, we have shown that how RSNs’ characteristics change as a function of ICA model order concerning a population of healthy subjects. There are strongly independent components (e.g., secondary sensory motor and basal ganglia) that cannot be depicted at low model orders, and, leaving them out from the analysis might lead to false negative results. Moreover, at higher model orders IC sources are finely clustered and therefore might be more sensitive to subtle connectivity alterations.
Based on our previous findings, we hypothesize that the detected disease-related differences in functional connectivity alter as a function of ICA model order. In order to investigate this hypothesis, we investigated between-group differences in functional connectivity with dual regression technique (Beckmann et al., 2009; Filippini et al., 2009). The null hypothesis was that the total volume of the detected between-group differences would not be affected by ICA model order and presents a straight linear relationship. We utilized seasonal affective disorder (SAD) as an example of a neuropsychiatric disease to compare with normal healthy controls (HCs). Our findings in SAD show only increased connectivity in SAD, which facilitates inferences on the effects of model order selection. Finally, functional connectivity changes in SAD involve RSNs that could be easily identified and followed up throughout estimated model orders.
Materials and Methods
Participants
This research is part of the SAD and light therapy project that has started in 2009 and still going on at Oulu University, Finland. In our study, SAD patients were recruited through advertisements in two waves during January–February 2009 (first wave) and November 2009–January 2010 (second wave) in the city of Oulu, Finland (latitude 65°01′N). The first wave represents the pilot study of the SAD and light therapy project, while the second wave represents the continuation of the same project. All SAD patients (39.78 ± 10.64 years, 30 ♀, 15 ♂) were interviewed by an experienced psychiatrist. Diagnostic and Statistical Manual of Mental Disorders (American Psychiatric Association, 1994) diagnoses for recurrent major depression (moderate or severe) were obtained using the Mini International Neuropsychiatric Interview (MINI; Sheehan et al., 1998). In addition, patients had to fulfill the diagnostic criteria for “seasonal pattern” according to DSM-IV-TR [American Psychiatric Association, 2000; although the diagnostic criteria for “seasonal pattern” can be applied to a diagnosis of major depressive episodes in both bipolar (I and II) disorder and recurrent MDD (American Psychiatric Association, 2000), only patients with recurrent unipolar depression were included in the present study to increase the homogeneity]. The ethical committee of Oulu University Hospital has approved the study for which the subjects have been recruited, and informed consent has been obtained from each subject individually according to the Helsinki declaration.
The exclusion criteria were as follows: lifetime psychotic disorder, other concurrent DSM-IV axis I except anxiety disorder, clinically significant DSM-IV axis II disorder, substance abuse or dependence, tobacco smoking, lifetime suicide attempt or suicide ideations during the past month, unstable physical disorder, psychotropic medications or corresponding herbal preparations, bright light therapy for the current episode, ocular-disorders except myopia/hyperopia. Furthermore, pregnant candidates were excluded. In addition, normal exclusion criteria for MRI-scanning were used. All SAD patients except four had no comorbid physical disorders (in the second wave: the first patient with arterial hypertension controlled by an angiotensin II receptor antagonist: the second patient suffers from arterial hypertension and hypercholesterolemia controlled by angiotensin II receptor antagonist and statins, respectively: the third patient is diagnosed with androgenic alopecia which is controlled by finasteride, and the fourth patient suffers from menopausal syndrome, using estradiol).
Imaging Methods
Altogether, 45 anti-depressant-free SAD patients and 45 age-, gender- and ethnicity-matched HCs (no concomitant medications) from the general population were imaged using the same protocol during the same winter-period. Resting-state BOLD data were collected on a GE Signa 1.5 Tesla whole body system with an eight channel receive coil, using an EPI GRE sequence (TR 1800 ms, TE 40 ms, 280 time points, 28 oblique axial slices, slice thickness 4 mm, inter-slice space 0.4, covering the whole brain, FOV 25.6 cm × 25.6 cm, with 64 × 64 matrix, parallel imaging factor 2, and a flip angle of 90°). T1-weighted scans were imaged using 3D FSPGR BRAVO sequence (TR 12.1 ms, TE 5.2 ms, slice thickness 1.0 mm, FOV 24.0 cm, matrix 256 × 256, and flip angle 20°, and NEX 1) in order to obtain anatomical images for co-registration of the fMRI data to standard space coordinates. The subjects were instructed to simply lay still inside the scanner with their eyes closed, think of nothing particular and not to fall asleep. Motion was minimized using soft pads fitted over the ears and hearing was protected.
Data Pre-Processing
Head motion in the fMRI data was corrected using multi-resolution rigid body co-registration of volumes, as implemented in FSL 3.3 MCFLIRT software (Jenkinson et al., 2002). The default settings used were: middle volume as reference, a three-stage search (8 mm rough + 4 mm, initialized with 8 mm results + 4 mm fine grain, initialized with the previous 4 mm step results) with final tri-linear interpolation of voxel values, and normalized spatial correlation as the optimization cost function. Brain extraction was carried out for motion corrected BOLD volumes with optimization of the deforming smooth surface model, as implemented in FSL 3.3 BET software (Smith 2002) using threshold parameters f = 0.5 and g = 0; and for 3D FSPGR volumes, using parameters f = 0.25 and g = 0. This procedure was verified with visual inspection of the extraction result. In some cases when the eye/tonsil tissue was not removed appropriately, these tissues were extracted manually. The resulting image was used as a mask for a secondary brain extraction. After successful brain extraction the BOLD volumes were spatially smoothed with Gaussian kernel (7.5 mm FWHM) and voxel time series were detrended using a Gaussian linear high-pass filter with a 100 s cutoff. The FSL 4.1.4 fslmaths tool was used for these steps. Multi-resolution affine co-registration as implemented in the FSL 4.1.4 FLIRT software (Jenkinson et al., 2002) was used to co-register mean non-smoothed fMRI volumes to 3D FSPGR volumes of corresponding subjects, and 3D FSPGR volumes to the Montreal Neurological Institute (MNI) standard structural space template (MNI152_T1_2mm_brain template included in FSL). Tri-linear interpolation was used, a correlation ratio was used as the optimization cost function, and regarding the rotation parameters a search was done in the full [−π π] range. The resulting transformations and the tri-linear interpolation were used to spatially standardize smoothed and filtered BOLD volumes to the MNI standard space. However, for computational reasons pertaining to later analysis steps, 4 mm resolution was retained after spatial normalization.
ICA Analysis
We have used spatial ICA in this paper and for simplicity, in the remainder of this paper, we refer to spatial ICA as ICA. ICA analysis was carried out using FSL 4.1.4 MELODIC software implementing probabilistic independent component analysis (PICA; Beckmann and Smith, 2004). Multisession temporal concatenation tool in MELODIC (implementing FastICA algorithm) was used to perform PICA related pre-processing and data conditioning in group analysis setting. ICA using 20 (low model order), 40, 60, 70, 80, 100, 120, and 150 (high model orders) independent component maps (IC maps) was applied to detect RSNs as described earlier (Kiviniemi et al., 2009; Abou Elseoud et al., 2010). The IC maps were thresholded using an alternative hypothesis test based on fitting a Gaussian/gamma mixture model to the distribution of voxel intensities within spatial maps (Beckmann et al., 2005) and controlling the local false-discovery rate at p < 0.5. Repeatability measures, e.g., ICASSO (Himberg et al., 2004), were not used in this study as our recent results (Remes et al., 2010) suggest that they provide only little improvement to IC estimates using FastICA. The expectation for the lack of differences is even more pronounced in a group-ICA setting due to increased SNR from pooling individual fMRI datasets into a single analysis.
The between-subject analysis of the resting data was carried out using a regression technique (dual regression) that allows for voxel-wise comparisons of resting-state fMRI (Beckmann et al., 2009; Filippini et al., 2009; Littow et al., 2010; Veer et al., 2010). Dual regression approach identifies subject-specific temporal dynamics and associated spatial maps within each subject’s fMRI data set. This involves (A) multiple linear regression of the z-score group-PICA maps against the preprocessed individual 4D resampled data sets yielding a subject-specific variance normalized (des norm = 1) time course for each component separately, and (B) multiple linear regression of these time courses was carried out against the preprocessed individual data sets in order to obtain subject-specific spatial maps.
Statistical difference was assessed non-parametrically using permutation testing implemented in FSL’s Randomize tool, Version 2.1, incorporating also threshold-free cluster enhancement (TFCE; Smith and Nichols, 2009). This involved deriving null distributions of t-values for the contrasts reflecting the between-group effects by performing 500 random permutations of group labels and testing the difference between groups for each permutation (Nichols and Holmes, 2002). For each RSN, the resulting statistical maps were thresholded at p < 0.05 (TFCE corrected for family wise errors). The resulting between-group difference maps were resampled into 2 mm.
Initially at low model order (most often used in the literature), RSNs were identified as anatomically and functionally classical RSNs upon visual inspection, ICA prominent low-frequency power on Fast Fourier Transformation (FFT) spectra, and slow fluctuation in time courses. RSNs were assigned to commonly described RSNs as previously reported (e.g., DeLuca et al. 2006; Kiviniemi et al., 2009; Smith et al., 2009; Abou Elseoud et al., 2010). At high model orders, RSNs were identified via spatial correlation coefficients (fslcc tool in FSL) using low model order RSNs as templates, and then verified by visual inspection across estimated model orders. The Juelich histological atlas (Eickhoff et al., 2007) and the Harvard–Oxford cortical and subcortical atlases (Harvard Center for Morphometric Analysis) provided with the FSL software were used to identify the anatomical characteristics of both RSNs and between-group differences.
For demonstration of the impact of ICA model order on between-group differences in functional connectivity, we have selected the motor and the visual large-scale networks. These RSNs were selected as they (a) showed most distinct disease-related changes and (b) could be further divided into several sub-networks at high model orders. The FSL fslstats tool was used to calculate the volume of non-zero voxels in each RSN and each significant between-group difference. These values were then divided by the number of voxels of the anatomical templates included in FSL in order to provide anatomical localization of the detected significant between-group differences as well as the RSNs. Graphs showing the total volume (number of non-zero voxels) of both between-group differences and RSNs as a function of ICA model order were made using Origin software (OriginPro 8 SR0, V8.0725). These total volumes were calculated by summing up all non-zero brain voxels using the FSL 4.1.4 fslmaths tool. The summed maps were selected from group-PICA maps (p < 0.5 threshold) and from between-group difference maps (TFCE corrected p < 0.05). RSN maps in Figure 2 are conservatively thresholded (z-score > 5) in order to show differences in functional segmentation across model orders. These maps show the core and the number of detected RSNs at each model order.
Results
The results show significant increased functional connectivity in SAD compared to HCs at all estimated model orders. A straight linear fit without any change as a function of model order (that corresponds to our null hypothesis) does not fit the data (R2 = 0.009, p = 0.8) and it has to be discarded. Contrary to the null hypothesis, the total volume of between-group differences significantly increased (R2 = 0.6, p = 0.0006) according to the third polynomial fit, peaking at model order 70 and then decreasing gradually as a function of ICA model order (Figure 1B). On the other hand, the total RSNs volume gradually increased, and then showed relative stability at higher model orders (Figure 1A). Notably, the total volume of between-group differences showed a marked elevation between model orders 60 and 70.
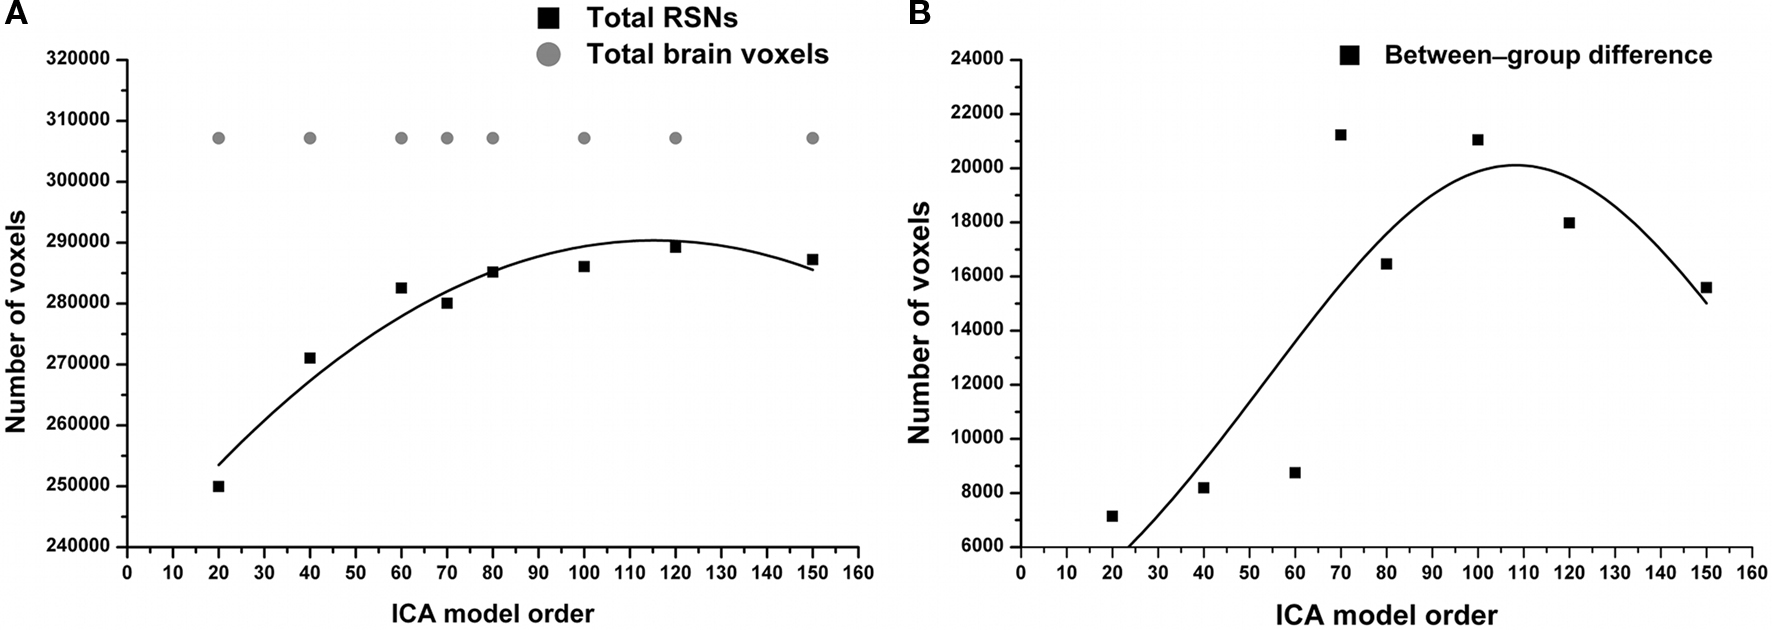
Figure 1. (A) RSNs total volume significantly increases as function of ICA model order reaching model order 60. Notably, higher model orders 60–150 showed relatively stable total volume. In gray, the total number of brain voxels used in the ICA analysis. (B) Total volume of between-group differences (see Figures 3, 4, green color) shows a non-linear increase in volume as a function of model order with volume maxima at model order of 70.
Moreover, at model orders 70 and 100, the total volume of between-group connectivity differences in proportion to the total RSNs volume (fraction of significant voxels) is nearly the same ≈ 0.075 (see Figure S1 in Supplementary Material). The fraction of significant voxels is highly correspondent to the volume of between-group differences due to narrow differences between total RSN volumes across model orders (Figure 1A). In this paper, for simplicity we categorized the estimated ICA model orders into two groups: large-scale and fine-grained levels.
Large-Scale RSNS (High Hierarchy)
Large-scale RSNs were localized using a low ICA model order of 20. At this high hierarchical level, the entire brain was segmented into 11 large-scale RSNs (Figure 2). SAD patients showed significant increases in functional connectivity in four out of the 11 identified RSNs involving the precuneus, the visual cortex, the motor and the somatosensory cortices as well as the bilateral caudate and thalamus nuclei (Table 1). Most of the large-scale RSNs appear to involve more than one functional node, e.g., the motor RSN involves both the entire motor, premotor and somatosensory cortices, in addition to the auditory cortex.
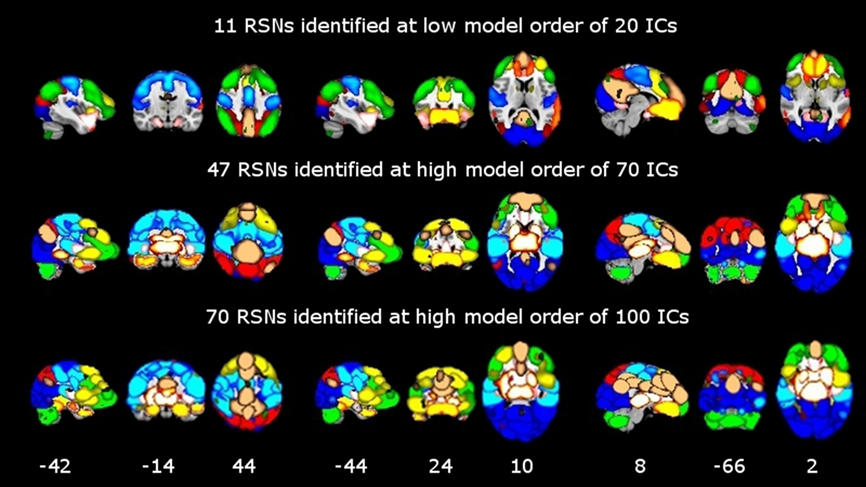
Figure 2. Functional segmentation of resting-state networks (RSNs) at different functional hierarchical levels superimposed on an MNI template. RSNs are thresholded at z-score > 5. Model order 20 yielded 11 large-scale networks (top). 47 and 70 fine-clustered RSNs obtained from model order 70 (middle) and 100 (bottom), respectively. The same color templates (Fslview color templates) were used to mark the fine-clustered and large-scale RSNs. Numbers at the bottom of the images refer to MNI coordinates (xyz).
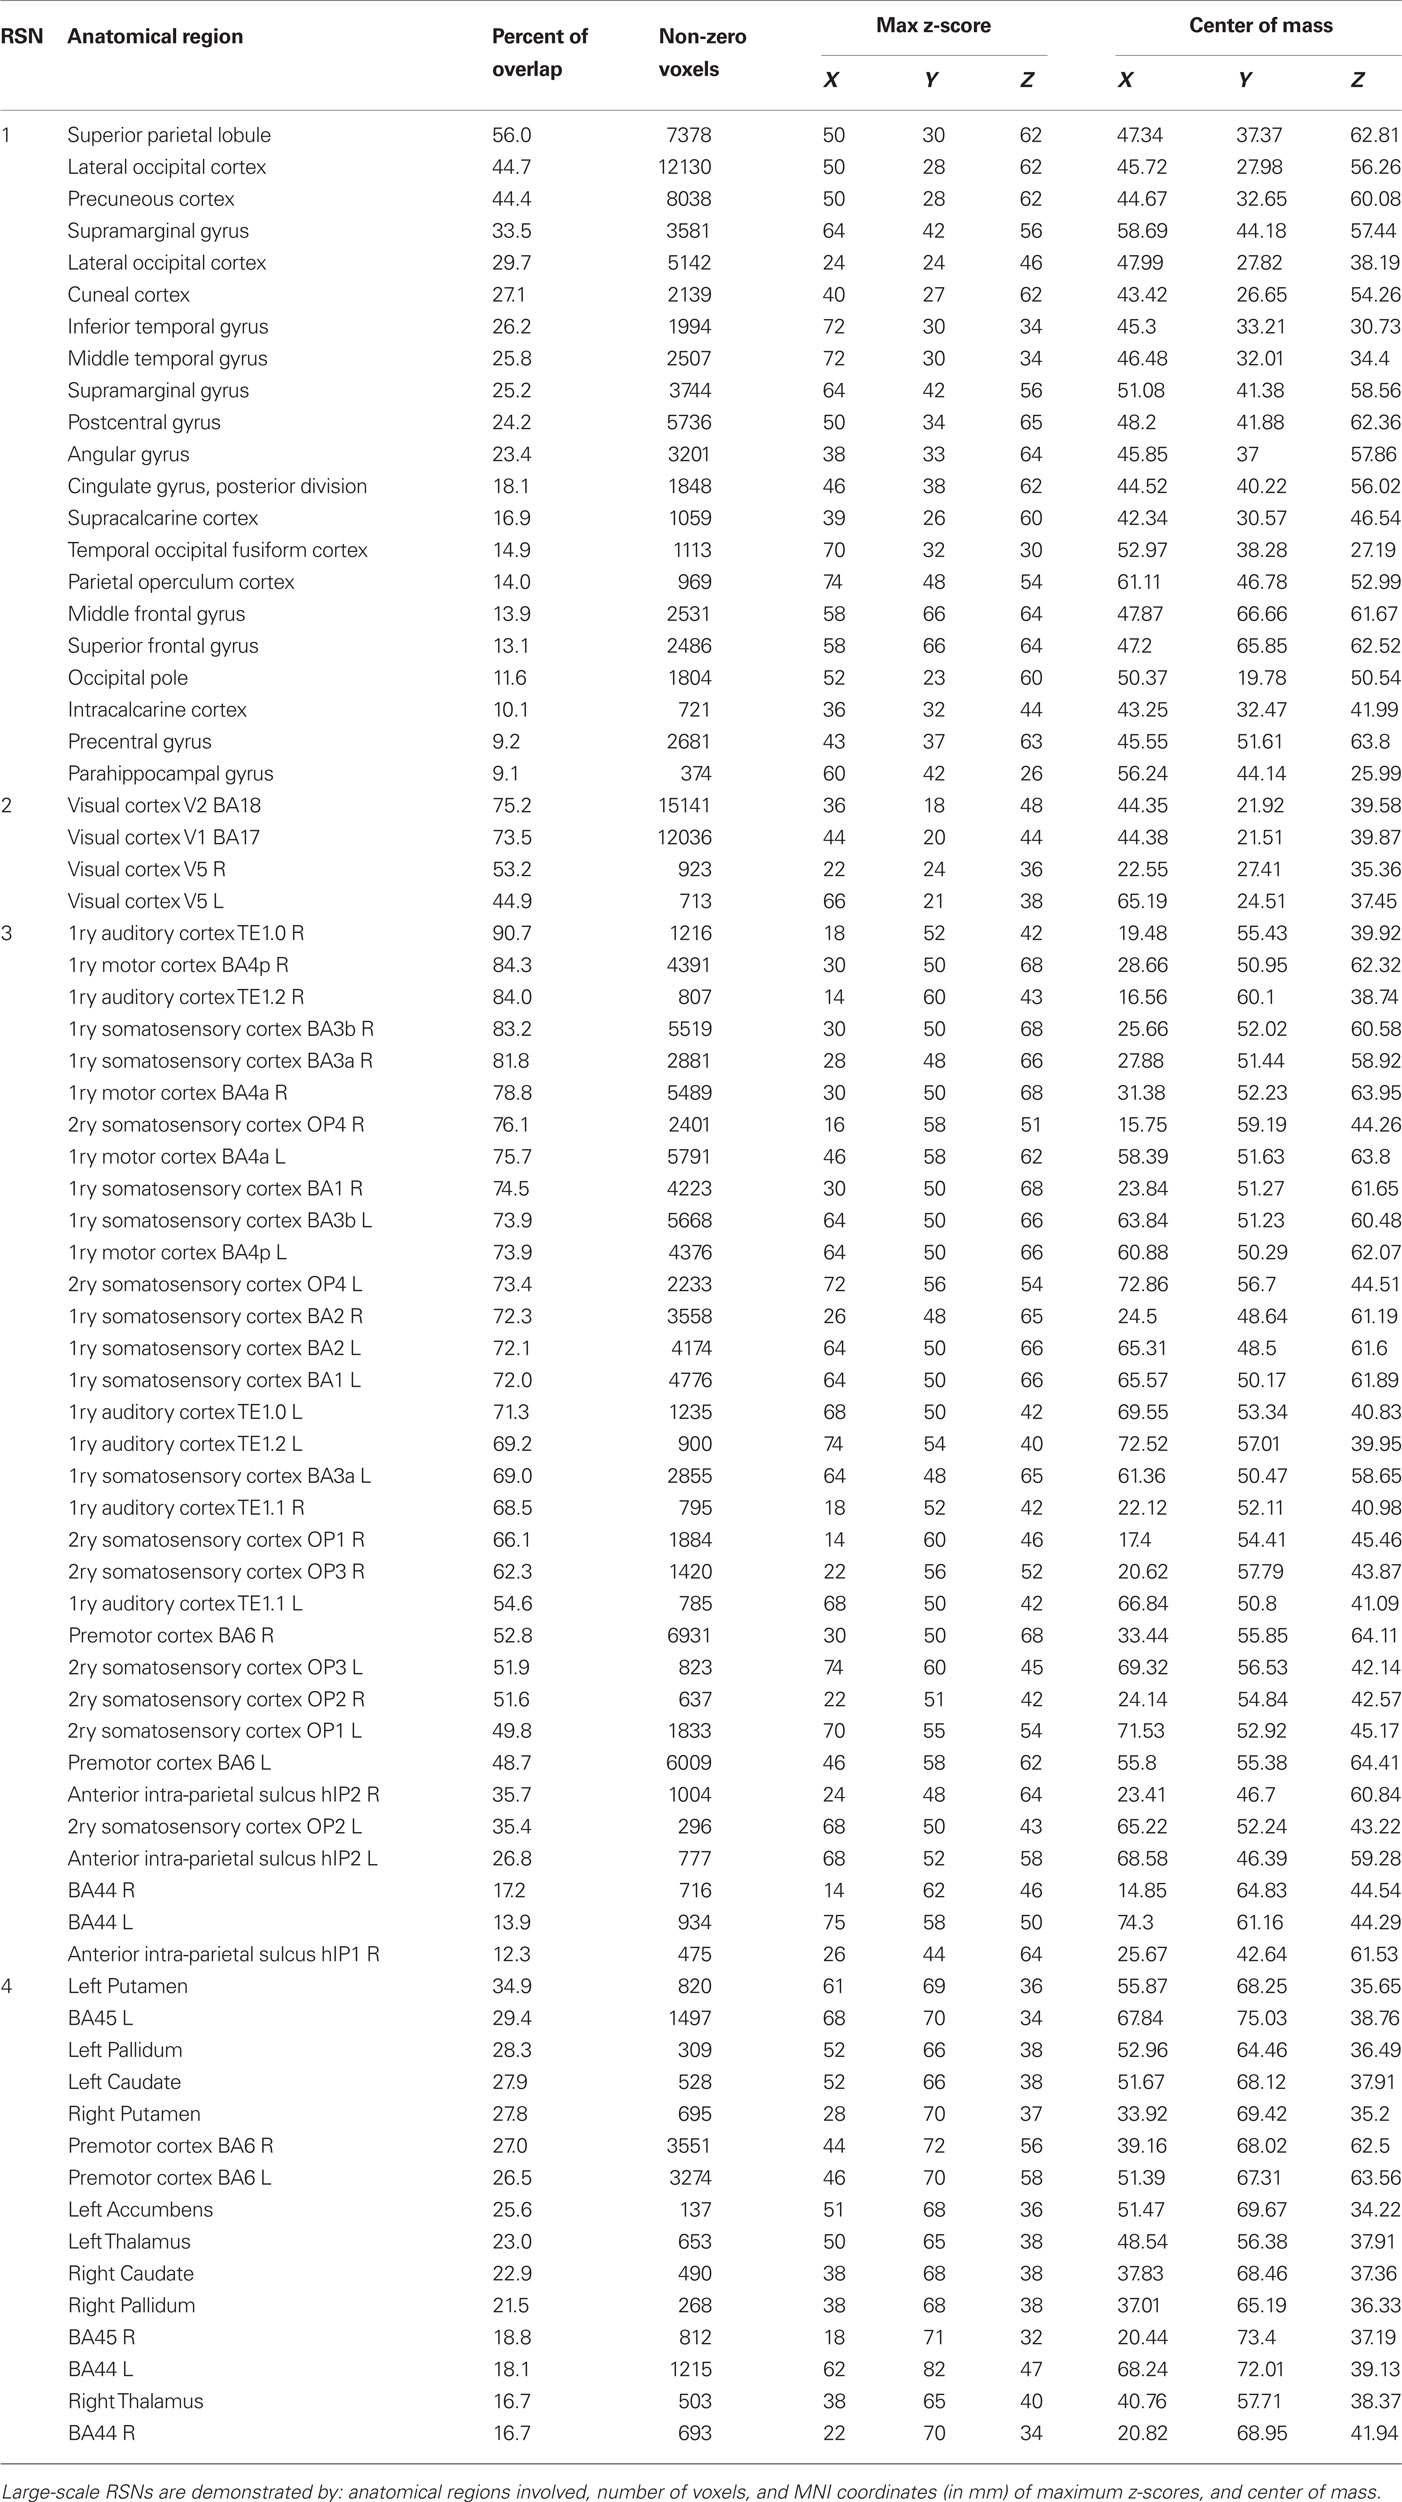
Table 1. Large-scale resting-state networks (RSNs) which involved significant increased connectivity at model order 20.
Fine-Grained Sub-Networks (Low Hierarchies)
At higher model orders, large-scale RSNs branched into sub-networks segmenting every network into smaller fine-grained sub-networks. For instance, the large-scale single sensorimotor RSN was segmented into 5–11 sub-networks (at model order 40–150) covering the entire motor, premotor and somatosensory cortices, in addition to, a network involving the auditory cortex (Figure 3). The remaining large-scale RSNs showed similar tendency to split down into either right and left, anterior and posterior, or superior and inferior compartments. Segmentation of the brain functionality into detailed sub-networks using ICA model orders of 40, 60, 70, 80, 100, 120, and 150 yielded 27, 40, 47, 54, 70, 81, and 95 RSNs, respectively (Table 2). At each model order, almost every network is decomposed of a number of smaller units (see Tables 1–8 in Supplementary Material). Therefore, each of these model orders represents a unique functional hierarchical level.
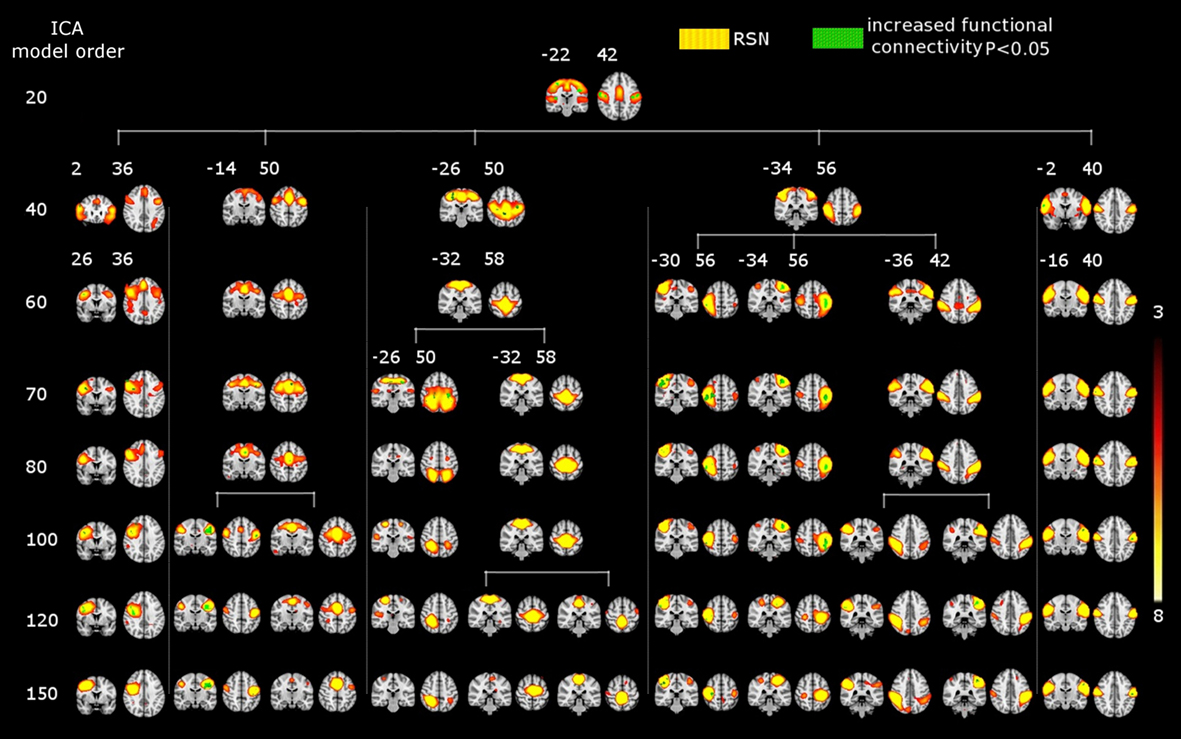
Figure 3. SAD significant increased functional connectivity (green) in the motor cortex at different ICA model orders (20, 40, 60, 70, 80, 100, 120, and 150) shown superimposed on MNI template. One RSN (red–yellow) involving both the motor cortices and the auditory cortex as well at the low model order of 20. At higher model orders this large-scale RSN splits into smaller fine-grained sub-networks. Notably, some of these networks still show significant increased connectivity, while others do not. Numbers at the bottom of the images refer to MNI coordinates (xyz). The left hemisphere corresponds to the right side and t-score threshold is shown at the right.
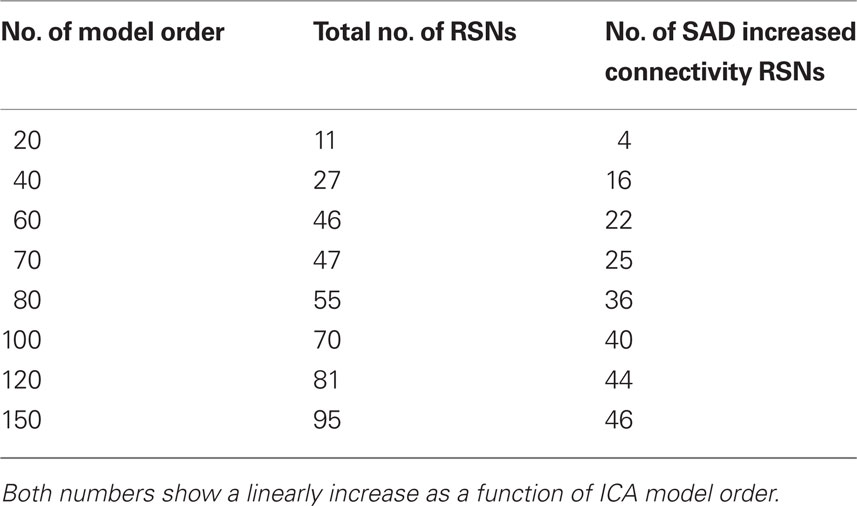
Table 2. The table shows the total number of resting-state networks (RSNs) and RSNs with a significant abnormal connectivity.
Figure 2 shows functional network segmentations at both large-scale (20 ICs) and fine-grained (70 and 100 ICs) levels. RSNs are thresholded at z-score > 5 for demonstration purposes. Notably, comparing these hierarchical levels, fine-grained level RSNs are segmented into sub-network clusters, i.e., right and left, anterior and posterior, or superior and inferior, etc. (Figure 2, the motor cortex in light blue color). Indeed functional segmentation at even higher model orders, e.g., 150, is possible and will yield focused detailed clusters, but at the same time is not feasible for demonstration purposes because such large number of clusters overlap widely (therefore, model orders 20, 70, and 100 were chosen for demonstration). Importantly, complex subcortical structures, e.g., basal ganglia, which are parts of large-scale RSNs at low model orders (not shown in Figure 2, z-score > 5) are clearly depicted as separate networks at high model orders (see Figure 2, e.g., thalamus and caudate in hot color).
The Effect of Functional Hierarchy on Between-Group Significant Differences
The results showed a significant linear increase in the total number of RSNs as a function of ICA model order. Interestingly, at low model order of 20, only one motor RSN covers the motor brain areas and also one visual RSN covers the visual areas (see Figures 3, 4). At model order 70, the total number of the motor RSNs was eight, while the visual RSNs consisted of 10 networks. At model order 150, the motor and visual RSNs consisted of 11 and 16 networks, respectively (see Figures 3, 4). Notably, some fine-grained RSNs do not involve between-group differences, although their lower model order RSN precursors show significant between-group differences, i.e., center motor and secondary somatosensory network (see Figures 3, 4 and Tables 3–7). It is obvious that the detected between-group differences are distributed differently at each model order, particularly at the highest estimated model orders (120 and 150). Despite the prominent spatial similarity of RSNs across model orders, some of the RSNs with significant differences at model order 100 and 120 do not show any differences in the equivalent RSNs at model order 150 and vice versa (see Figures 3, 4).
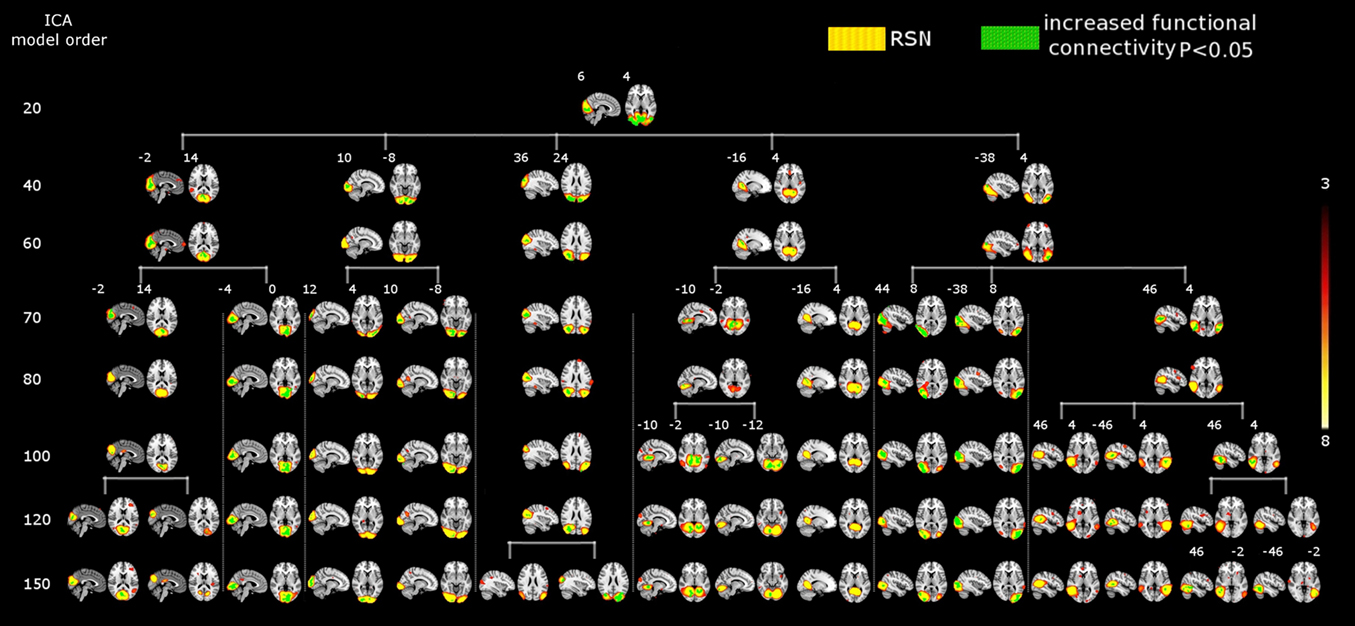
Figure 4. SAD significant increased functional connectivity (green) in the visual cortex at different ICA model orders (20, 40, 60, 70, 80, 100, 120, and 150) shown superimposed on MNI template. While at low model order of 20 the visual cortex was segmented into one RSN (red–yellow) which also showed a significant increased connectivity, higher model orders provided a more fine-grained segmentation. A prominent increase in the number of sub-networks (red–yellow) with significant increased connectivity is evident at higher model orders. Numbers at the bottom of the images refer to MNI coordinates (xyz). The left hemisphere corresponds to the right side and t-score threshold is shown at the right.
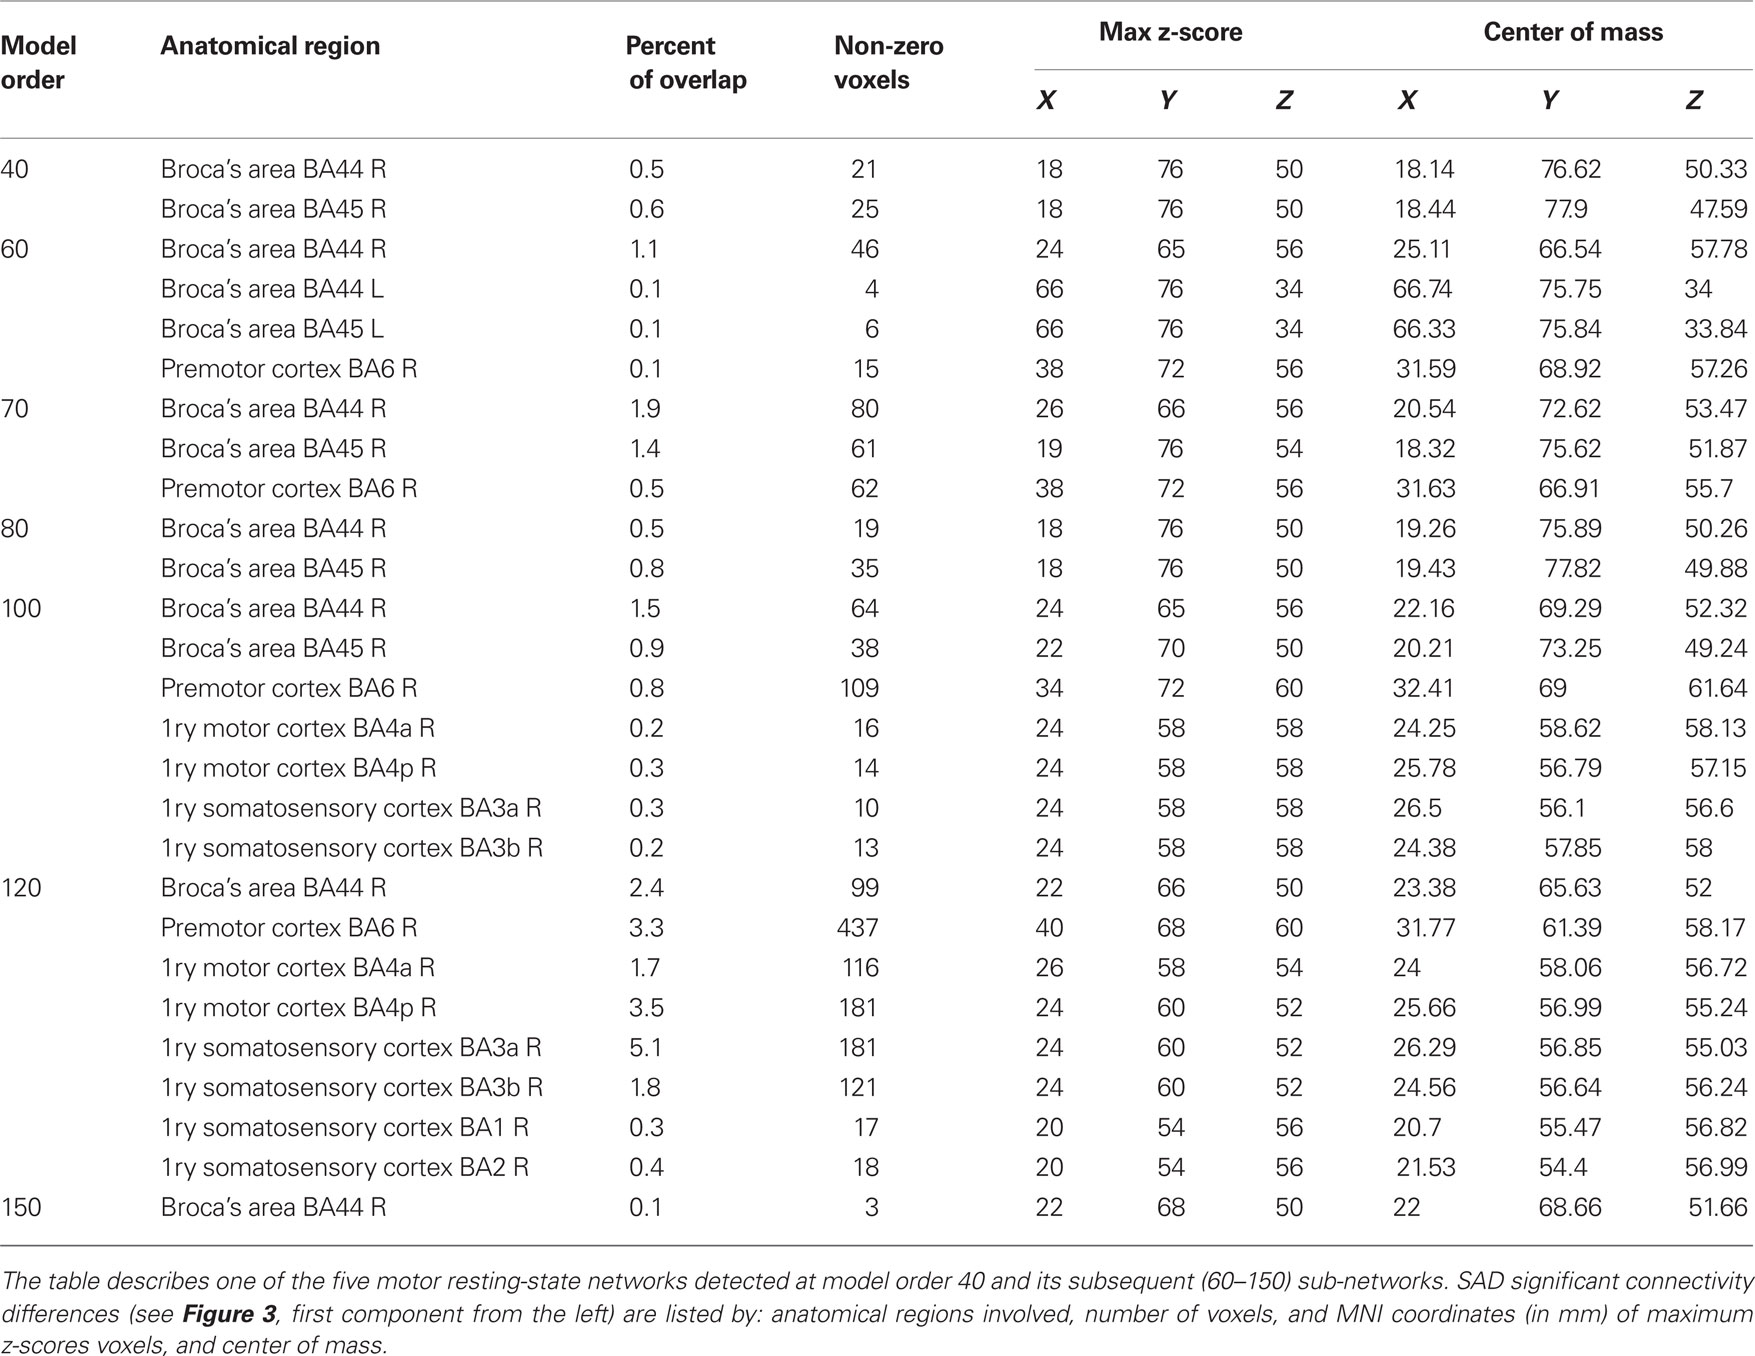
Table 3. SAD functional connectivity differences in the motor cortex at all estimated ICA model orders.
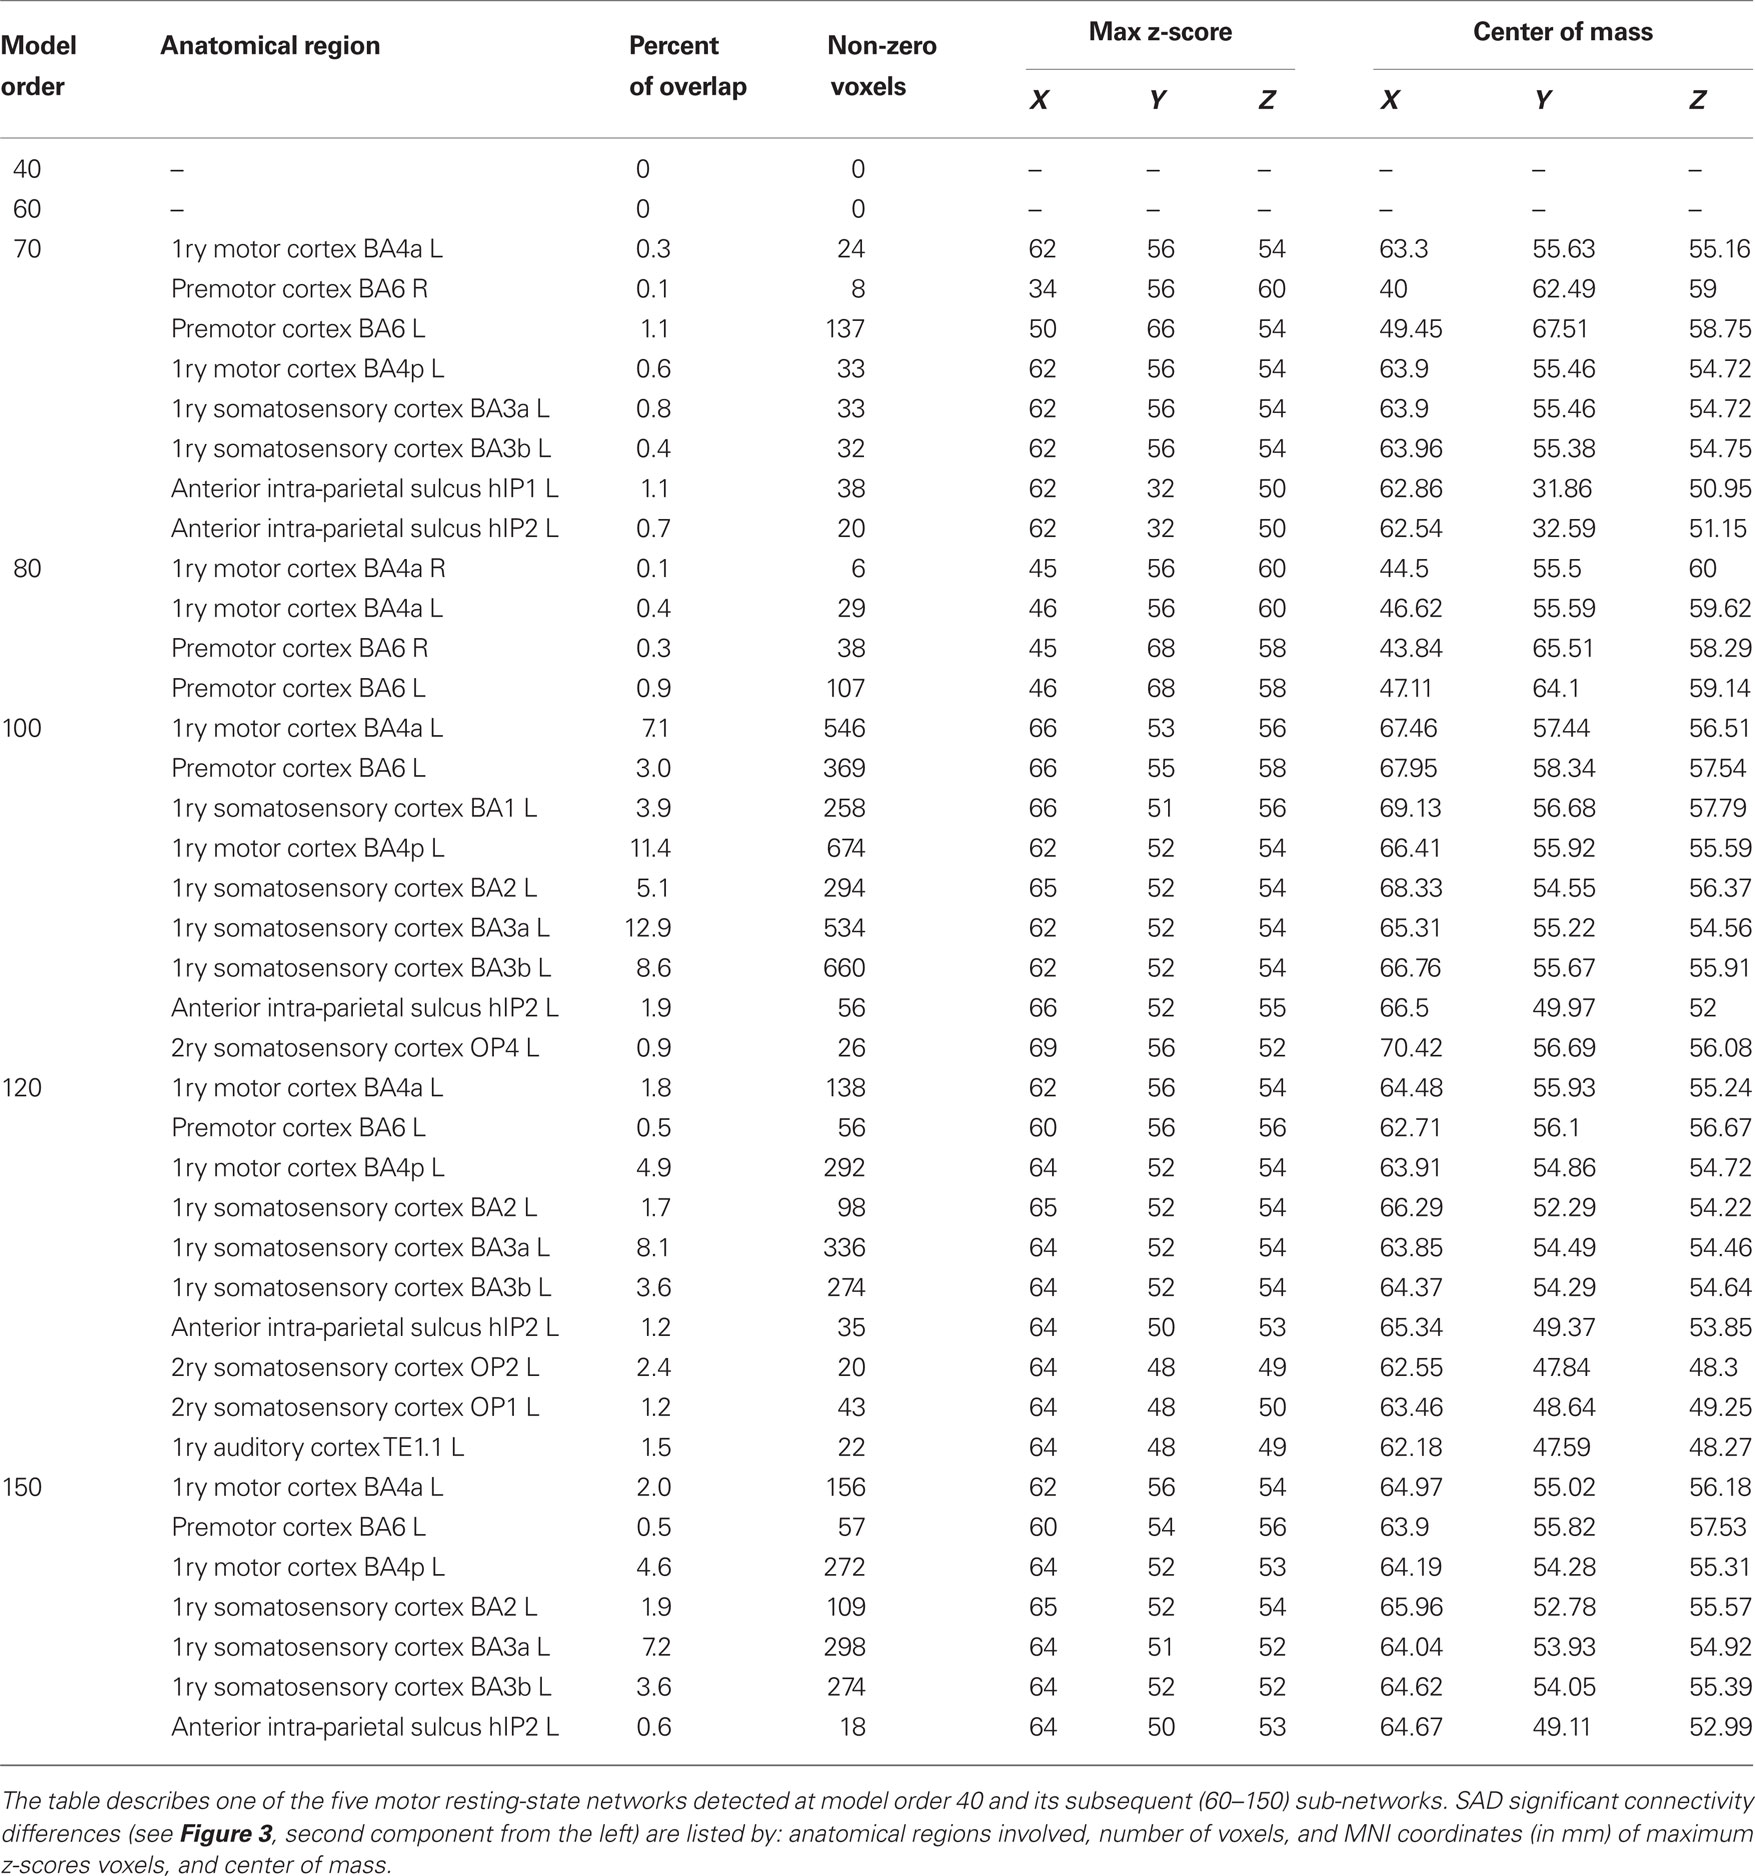
Table 4. SAD functional connectivity differences in the motor cortex at all estimated ICA model orders.
Table 5. SAD functional connectivity differences in the motor cortex at all estimated ICA model orders.
Table 6. SAD functional connectivity differences in the motor cortex at all estimated ICA model orders.
Table 7. SAD functional connectivity differences in the motor cortex at all estimated ICA model orders.
Discussion
Independent component analysis model order significantly influences the detected between-group differences in functional connectivity measured using the ICA dual regression approach. The total volume of significant between-group differences reaches maximum at model order 70, then further increases in ICA model order convey fewer between-group differences (Figure 1B). Also, the total volume of RSNs increased up to model order 70, after which it plateaus. Notably, the results revealed only increased functional connectivity in SAD at all estimated model orders facilitating inferences on the effects of model order selection.
The total volume of between-group differences and the total volume of RSNs showed a general trend of increase (Figure 1), suggesting a relationship between the spatial coverage of RSNs and that of between-group differences. However, there is a marked elevation between model orders 60 and 70 in the total volume of between-group differences without a corresponding increase in the total volume of RSNs. Also, while the total volume of RSNs plateaus at high model orders (70–150), the total volume of between-group differences gradually decreases. Moreover, at model orders 70 and 100, the fraction of significant voxels reaches maximum (see Figure S1 in Supplementary Material) which might be linked to the detected local maxima in the total volume of between-group differences. These findings might indicate possible contributions of other factors in the estimation of between-group differences.
Independent component analysis utilizes the entire spatial extent to estimate both large-scale RSNs and fine-grained RSNs by decomposing the functional data into components (ICA spatial modes) according to the estimated/selected model order (McKeown et al., 1998; Calhoun et al., 2001; Kiviniemi et al., 2003). Functional brain segmentation at model orders 20, 40, 60, 70, 80, 100, 120, and 150 yielded 27, 40, 47, 54, 70, 81, and 95 RSNs, respectively (Table 2). These RSN segmentations showed significant differences across model orders. Notably, at model order 20, 11 large-scale RSNs cover most of the brain cortex with relatively low z-score threshold of three. However, the most coherent core areas within these 11 RSNs at z-score > 5 do not involve all subcortical regions, parts of parietal and temporal cortices, or the cerebellum, c.f. Figure 2. On the other hand, fine-grained RSNs do cover the entire brain cortex as well as the cerebellum at the same threshold (z-score > 5).
The z-scores of the IC maps are non-linearly affected by model order as the calculation of z-score involves dividing by the standard deviation of the residual variance which decreases as a function of ICA model order. The RSN brain coverage perhaps could be adjusted accordingly by modifying the z-score threshold such that the coverage would be identical at all model orders. However, in the group-PICA dual regression approach applied here, the RSN brain coverage does not play a significant role in the results. The dual regression utilizes un-thresholded group-PICA maps in order to avoid double dipping of the data. Also, un-thresholded RSN volumes showed only 2.3 % difference in brain coverage (data not shown here). Moreover, the TFCE method (used to retain only significant between-group differences in dual regression) does not use such fixed thresholds either.
Although there is a high spatial consistency between RSNs at high model orders e.g., 70–150 (see Figures 3, 4), the detected between-group differences do not show the same degree of consistency (see Tables 3–7). It seems that some between-group differences are relatively more consistent across model orders than others. Each model order is a unique solution to the decomposition of the spatial brain data and subsequent model orders usually yield RSNs that do not share exactly the same brain regions. In spatial domain ICA, the mixing vector representing function in time is the one being modified when maximizing non-Gaussian distribution of spatial ICA modes. The time-domain mixing vector is likely to capture somewhat different temporal aspects of the data within each model order, particularly at high model orders that retain more of the original data for the actual ICA step. Although the core of RSNs remains very similar across model orders, between-group differences are uniquely estimated at each model order.
Our results showed that the total volume of RSN maps captured at high model orders exceeds that of large-scale RSNs at the same threshold p < 0.5 level by 13% (Figure 1, left). The exceeding volume could be explained by: (1) Filling in of the uncovered brain regions at low model orders, e.g., the cerebellum. (2) Partial overlaps within non-gray matter brain regions, e.g., white matter at a given threshold. In our analysis the PCA data reduction step prior to ICA was matched to the number of ICA model order. Thus, the non-gray matter brain regions shared by some RSNs are likely due to ICA capturing more of the data variance and/or detecting different T2*-weighted image effects and assigning them to different RSNs. In addition, at the high model orders (e.g., >100), it is sometimes difficult to differentiate RSN and non-RSN sources due to the same reason of increased variance capture.
Multilevel Exploration of Functional Brain Connectivity
Measuring functional brain connectivity at different hierarchical levels using ICA might provide an advantage in modeling the systematic effects of pathology in brain disorders. Probably, diagnosing neuropsychiatric disorders might require selecting the optimal ICA model order according to the function under investigation, not only the number of RSNs or the volume of between-group differences. Also, information regarding the underlying functionality of fine-grained sub-networks shall play an essential role in determining the hierarchical level needed to profile each disorder. Additionally, in some brain disorders functional connectivity abnormalities might be detected among both large-scale and fine-grained RSNs, while in other disorders abnormalities may lay either among large-scale or fine-grained RSNs. Therefore, there may be no definite model order for detecting aberrant functional connectivity for all diseases.
As we mentioned earlier, SAD was used only as an example of brain disease in this study. The main focus of this study was to explore if disease sensitivity could be optimized by exploring functional connectivity differences at multiple ICA model orders. Therefore, detailed interpretation of SAD-related connectivity differences is beyond the scope of this paper. More interestingly however, our results showed SAD-related increased functional connectivity in RSNs including brain regions that have been reported to involve increased metabolism in SAD, e.g., in the frontal, orbitofrontal, right parietal, and left middle temporal cortices, and in the right caudate: whereas brain regions of reduced metabolism were also recorded, e.g., the right middle temporal cortex and left parietal cortex (Cohen et al., 1992). Increased functional connectivity might be associated with increased underlying cerebral metabolism. In addition, other brain areas not yet associated with SAD were also detected, e.g., the PCC, precuneus, and the visual cortex. Future work aims at detailed interpretation and discussion of SAD-related functional connectivity differences detected in this study on neuropsychiatric and neurofunctional bases.
Modularity demonstrated in a wide range of complex systems enables the identification of the optimal partition of a network. There is strong evidence for the modular organization of human brain networks (Chen et al., 2008; Bullmore and Sporns 2009; Ferrarini et al., 2009; Meunier et al., 2009a, 2009b; Valencia et al., 2009). Salvador et al. (2005) proposed partial correlation methods to build group-level RSNs based upon an averaged similarity matrix across subjects, while van den Heuvel et al. (2008) have implemented an individual clustering adjacency matrix. Also, Ferrarini et al. (2009) have described the hierarchical modular structure of RSNs using a partial correlation analysis. Meunier et al. (2009b) functionally segmented the brain into eight large modules, each compromising more than 10 nodes at the highest level of the hierarchy, and 57 sub-modules at the lowest level. Recently, Bellec et al. (2010) detected a minimum of seven RSNs using bootstrap analysis of stable clusters and suggested that there might be many numbers of clusters (where local maxima of clustering stability could be spotted). Our ICA segmentations are consistent with these previous results that highlight the modular segmentation of the human brain. Nevertheless, a more detailed investigation driven by similarity between the ICA functional hierarchy of RSNs and the above findings using different methodologies for assessing resting-state brain activity would be beneficial.
The potential utility of group based ICA approaches has been demonstrated by the increasing number of studies examining clinical populations. Large-scale networks (i.e., low model order components) are compact and easy to identify, including networks such as the visual, auditory, sensorimotor, etc. Notably, ICA shows tendency toward “splitting” of large-scale networks into sub-networks by increasing the number of estimated ICs. Previously, we showed that the use of high model order ICA is an important and useful tool for obtaining detailed parcellation of the functional hierarchy of neural sub-systems (Abou Elseoud et al., 2010). It is important to notice that different ICA model orders describe different functional connectivity and hierarchical aspects. Our results showed that a large-scale network with significant differences in connectivity splits into sub-networks. Some of these sub-networks still show connectivity differences, while the rest show normal connectivity, i.e., some of the sensorimotor and visual sub-networks show no changes in connectivity at higher model orders. This finding indicates that although the branched sub-networks descended from a common large-scale network, they are independent from each other at the fine-grained levels of the hierarchy.
It is also important to consider the neurofunctional meaning of such fine-grained sub-networks when selecting ICA model order. At present, assigning every sub-network to a neuronal sub-functionality appears to be difficult. A number of studies showed conclusions linking networks’ splitting and sub-functionalities. Seeley et al. (2007) identified such a split in a network suggested to be involved in executive function, revealing separate purported “control” and “salience” networks. Earlier, Seifritz et al. (2002) showed ICA of the auditory cortex that yielded a unique spatial map and a temporal pattern, suggesting the presence of two concurrent temporally independent processes. Then by temporally decomposing the signal into temporal ICs, transient and sustained components of the human auditory cortex were separated. Additionally, high model orders can be used to detect individual subcortical components belonging to the thalamus and the basal ganglia, which are not detectable using low model order (Ystad et al., 2010). Moreover, on the millimeter-scale, marked differences in the patterns of functional connectivity can be detected (Margulies et al., 2007). Future studies are needed in order to link functional segmentation to anatomical parcellation and to fill in the gap between fine-grained networks and sub-functionality.
At high model orders there is a large increase in statistical tests performed compared to low model orders due to the increased number of functional RSN sources. The presently applied TFCE correction method corrects the results at brain voxel level, but does not adjust for the risk (false positives) induced by increasing the number of RSNs. Currently we are planning statistical methods that could correct for the type I error also at the level of RSN in combination with dual regression. Therefore, we performed corrections only at individual IC level. In general, our results at high model orders, particularly model order 70 are in line with results at low model orders. Moreover, the total volume of significant between-group differences showed no significant increase after model order 70. However, it would be beneficial to develop a methodology for correcting for multiple comparisons simultaneously within and between RSN maps.
Functional Hierarchy and Disease Sensitivity
Neuropsychiatric disorders (e.g., depression, dementia, schizophrenia, Alzheimer’s, etc.) might occur at either the micro-level or macro-level, particularly at the initial stages, and may extend to both levels later on (Stoffers et al., 2008; Krishnan et al., 2009; Zhang et al., 2010). Some disorders target specific brain systems or regions and spare others within the same anatomical structure, consequently affecting some functions and preserving others. Importantly, the choice of ICA model order when the ultimate goal is detecting between-group difference should be considered cautiously. Our results showed a small number of brain voxels with significant between-group differences at low model orders (Figure 1, right). Moreover, large-scale RSNs at lower model orders suffer from the joining of multiple areas known to be functionally independent (Abou Elseoud et al. 2010; see Figure 3 and Table 3, at model order 20, one RSN included both motor and auditory cortices). Also, large-scale RSNs are unable to capture subcortical brain regions as separate RSNs (Abou Elseoud et al. 2010; Ystad et al., 2010; see Figure 2). On the contrary, at high model orders the total volume of between-group differences reaches maximum. However, there is an increased risk of false positives due to an increased number of components at higher model orders. Therefore, as discussed earlier it might be that applying different statistical methods for correcting results at high model orders could provide a reasonable solution.
We emphasize that results presented here apply to our 1.5 Tesla group-ICA setting with the present imaging parameters and data pre-processing. Additionally, different optimal model orders might be found when higher field strengths and higher resolutions are used. However, as clinical applications require analysis of individual fMRI datasets, an additional challenge remains, concerning the matter of how one can detect subject-specific RSNs robustly at fine-grained levels. High field magnets, e.g., 3 or 7 Tesla, might offer an alternative which could provide individual subject datasets with adequate quality needed for detecting subject-specific RSNs.
Conclusion
In this paper we show that detected disease-related differences in functional connectivity alter as a function of ICA model order. The results showed only increased functional connectivity at all estimated model orders. Our findings suggest that multilevel ICA exploration of functional connectivity enables optimization of sensitivity to brain disorders. The volume of between-group differences altered significantly as a function of ICA model order reaching maximum at model order 70 (which seems to be an optimal level that conveys the largest between-group difference). Our results show that fine-grained RSNs enable better detection of detailed disease-related functional connectivity changes. However, high model orders show an increased risk of false positives that needs to be overcome.
Conflict of Interest Statement
The authors declare that the research was conducted in the absence of any commercial or financial relationships that could be construed as a potential conflict of interest.
Acknowledgments
The authors gratefully thank Stephen Smith for beneficial and helpful discussions on the methods. Also, we would like to acknowledge Anu Liettu, M.D. for taking part in the enrollment interviews of SAD patients with Markku Timonen. We would also like to thank our reviewers for their constructive comments and suggestions on the manuscript. This research was supported by the Finnish Academy grants no. 111711 and 123772, the Finnish Medical Foundation and the Neurological Foundation. The granting bodies did not have any role in any of the following aspects of this study: design, data collection, management, data analysis and interpretation of results and findings, or preparation, review or manuscript approval. M.D. Markku Timonen has been reimbursed by two medical companies (Wyeth and Pfizer) for attending two conferences, and has been paid fees for speaking on different occasions by Eli Lilly, Astra Zeneca, BMS, and Pfizer. In addition, Markku Timonen is a minor shareholder in Valkee Ltd. Juuso Nissilä is a shareholder and CEO of Valkee Ltd. company (Oulu, Finland), which is a producer and developer of the bright light devices for SAD.
Supplementary Material
The Supplementary Material for this article can be found online at http://www.frontiersin.org/systems_neuroscience/10.3389/fnsys.2011.00037/abstract
References
Abou Elseoud, A., Starck, T., Remes, J., Nikkinen, J., Tervonen, O., and Kiviniemi, V. (2010). The effect of model order selection in group PICA. Hum. Brain Mapp. 31, 1207–1216.
American Psychiatric Association. (1994). Diagnostic and Statistical Manual of Mental Disorders, 4th edition. Washington, D.C.: American Psychiatric Association.
American Psychiatric Association. (2000). Diagnostic and Statistical Manual of Mental Disorders, 4th edition. Text revision. Washington, D.C.: American Psychiatric Association.
Anand, A., Li, Y., Wang, Y., Wu, J., Gao, S., Bukhari, L., Mathews, V. P., Kalnin, A., and Lowe, M. J. (2005). Activity and connectivity of brain mood regulating circuit in depression: a functional magnetic resonance study. Biol. Psychiatry 57, 1079–1088.
Beckmann, C., Mackay, C., Filippini, N., and Smith, S. (2009). Group comparison of resting-state FMRI data using multi-subject ICA and dual regression. 15th Annual Meeting of Organization for Human Brain Mapping, San Francisco, poster 441SU-AM.
Beckmann, C. F., DeLuca, M., Devlin, J. T., and Smith, S. M. (2005). Investigations into resting-state connectivity using independent component analysis. Philos. Trans. R. Soc. Lond. B. Biol. Sci. 360, 1001–1013.
Beckmann, C. F., and Smith, S. M. (2004). Probabilistic independent component analysis for functional magnetic resonance imaging. IEEE Trans. Med. Imaging 23, 137–152.
Bellec, P., Rosa-Neto, P., Lyttelton, O., Benali, H., and Evans, A. (2010). Multi-level bootstrap analysis of stable clusters in resting-state fMRI. Neuroimage 51, 1126–1139.
Biswal, B. B., and Ulmer, J. L. (1999). Blind source separation of multiple signal sources on fMRI data sets using Independent component analysis. J. Comp. Assisst. Tomogr. 23, 265–271.
Biswal, B. B., Yetkin, F. Z., Haughton, V. M., and Hyde, J. S. (1995). Functional connectivity in the motor cortex of resting human brain using echo-planar MRI. Magn. Reson. Med. 34, 537–541.
Bullmore, E., and Sporns, O. (2009). Complex brain networks: graph theoretical analysis of structural and functional systems. Nat. Rev. Neurosci. 10, 186–198.
Calhoun, V., Kiehl, K., and Pearlson, G. (2008). Modulation of temporally coherent brain networks estimated using ICA at rest and during cognitive tasks. Hum. Brain Mapp. 29, 828–838.
Calhoun, V. D., Adali, T., and Pearlson, G. (2004). Independent component analysis applied to fMRI data: a generative model for validating results. J. VLSI Signal Process. Syst. 37, 281–291.
Calhoun, V. D., Adali, T., Pearlson, G. D., and Pekar, J. J. (2001). Spatial and temporal independent component analysis of functional MRI data containing a pair of task-related waveforms. Hum. Brain Mapp. 13, 43–53.
Calhoun, V. D., Eichele, T., and Pearlson, G. (2009). Functional brain networks in schizophrenia: a review. Front. Hum. Neurosci. 3, 17. doi: 10.3389/neuro.09.017.2009
Chen, C. H., Suckling, J., Ooi, C., Fu, C. H., Williams, S. C., Walsh, N. D., Mitterschiffthaler, M. T., Pich, E. M., and Bullmore, E. (2008). Functional coupling of the amygdala in depressed patients treated with antidepressant medication. Neuropsychopharmacology 33, 1909–1918.
Chen, Z., He, Y., Rosa-Neto, P., Germann, J., and Evans, A. C. (2008). Revealing modular architecture of human brain structural networks by using cortical thickness from MRI. Cereb. Cortex 18, 2374–2381.
Cohen, R. M., Gross, M., Nordahl, T. E., Semple, W. E., Oren, D. A., and Rosenthal, N. (1992). Preliminary data on the metabolic brain pattern of patients with winter seasonal affective disorder. Arch. Gen. Psychiatry 49, 545–552.
Cordes, D., Haughton, V. M., Arfanakis, K., Wendt, G. J., Turski, P. A., Mortiz, C. h., Quigley, M. A., and Meyerand, M. E. (2000). Mapping functionally related regions of brain with functional connectivity in the cerebral cortex in “resting-state” data. Am. J. Neuroradiol. 22, 1326–1333.
Damoiseaux, J., Rombouts, S., Barkhof, R., Scherltens, P., Stam, C., Smith, S., and Beckmann, C. (2006). Consistent resting-state networks across healthy subjects. Proc. Natl. Acad. Sci. U.S.A. 103, 848–853.
DeLuca, M., Beckmann, C., DeStefano, N., Matthews, P., and Smith, S. (2006). fMRI resting state networks define distinct modes of long-distance interactions in the human brain. Neuroimage 29, 1359–1367.
Eickhoff, S. B., Paus, T., Caspers, S., Grosbras, M. H., Evans, A. C., Zilles, K., and Amunts, K. (2007). Assignment of functional activations to probabilistic cytoarchitectonic areas revisited. Neuroimage 36, 511–521.
Ferrarini, L., Veer, I. M., Baerends, E., Tol, M. J., Renken, R., Van der Wee, N., Veltman, D., Aleman, A., Zitman, F., Penninx, B., Buchem, M., Reiber, J., Rombouts, S., and Milles, J. (2009). Hierarchical Functional Modularity in the Resting-State Human Brain. Hum. Brain Mapp. 30, 2220–2231.
Filippini, N., Maclntosh, B., Hough, M., Goodwin, G., Frisoni, G., Smith, S., Matthews, P., Beckmann, C., and Mackay, C. (2009). Distinct patterns of brain activity in young adults carrying the APOE-ε4 allele. Proc. Natl. Acad. Sci. U.S.A. 106, 7209–7214.
Fitzgerald, P. B., Laird, A. R., Maller, J., and Daskalakis, Z. J. (2008). A meta-analytic study of changes in brain activation in depression. Hum. Brain Mapp. 29, 683–695.
Fox, M. D., Snyder, A. Z., Vincent, J. L., Corbetta, M., Van Essen, D. C., and Raichle, M. E. (2005). The human brain is intrinsically organized into dynamic, anticorrelated functional networks. Proc. Natl. Acad. Sci. U.S.A. 102, 9673–9678.
Friston, K. (2009). The free-energy principle: a rough guide to the brain? Trends Cogn. Sci. 13, 293–301.
Friston, K. (2010). The free-energy principle: a unified brain theory? Nat. Rev. Neurosci. 11, 127–138.
Greicius, M. D., Flores, B. H., Menon, V., Glover, G. H., Solvason, H. B., Kenna, H., Reiss, A. J., and Schatzberg, A. F. (2007). Resting-state functional connectivity in major depression: abnormally increased contributions from subgenual cingulate cortex and thalamus. Biol. Psychiatry 62, 429–437.
Greicius, M. D., Krasnow, B., Reiss, A. L., and Menon, V. (2003). Functional connectivity in the resting brain: a network analysis of the default mode hypothesis. Proc. Natl. Acad. Sci. U.S.A. 100, 253–258.
Greicius, M. D., Srivastava, G., Reiss, A. L., and Menon, V. (2004). Default-mode network activity distinguishes Alzheimer’s disease from healthy aging: evidence from functional MRI. Proc. Natl. Acad. Sci. U.S.A. 101, 4637–4642.
Guimerà, R., Sales-Pardo, M., and Amaral, L. A. N. (2004). Modularity from fluctuations in random graphs and complex networks. Phys. Rev. E 70, 025101.
Harrison, B., Pujol, J., Ortiz, H., Fornito, A., Pantelis, C., and Yücel, M. (2008). Modulation of brain resting-state networks by sad mood induction. PLoS ONE 3, e1794. doi: 10.1371/journal.pone.0001794
Hilgetag, C. C., Burns, G. A., O’Neill, M. A., and Scannell, J. W. (2000). Anatomical connectivity defines the organization of clusters of cortical areas in the macaque and the cat. Philos. Trans. R. Soc. Lond B. Biol. Sci. 355, 91–110.
Himberg, J., Hyvärinen, A., and Esposito, F. (2004).Validating the independent components of neuroimaging time series via clustering and visualization. Neuroimage 22, 1214–1222.
Jafri, M. J., Pearlson, G. D., Stevens, M., and Calhoun, V. D. (2008). A method for functional network connectivity among spatially independent resting-state components in schizophrenia. Neuroimage 39, 1666–1168.
Jenkinson, M., Bannister, P., Brady, M., and Smith, S. (2002). Improved optimization for the robust and accurate linear registration and motion correction of brain images. Neuroimage 17, 825–841.
Kiviniemi, V., Kantola, J. H., Jauhiainen, J., Hyvärinen, A., and Tervonen, O. (2003). Independent component analysis of nondeterministic fMRI signal sources. Neuroimage 19, 253–260.
Kiviniemi, V., Starck, T., Remes, J., Long, X., Nikkinen, J., Haapea, M., Veijola, M., Moilanen, I., Isohanni, M., Zang, Y., and Tervonen, O. (2009). Functional segmentation of the brain cortex using high model order group PICA. Hum. Brain Mapp. 30, 3865–3886.
Krishnan, R. R., Keefe, R., and Kraus, M. (2009). Schizophrenia is a disorder of higher order hierarchical processing. Med. Hypotheses 72, 740–744.
Littow, H., Abou Elseoud, A., Haapea, M., Isohanni, M., Mankinen, K., Moilanen, I., Nikkinen, J., Rahko, J., Rantala, H., Remes, J., Starck, T., Tervonen, O., Veijola, J., Beckmann, C., and Kiviniemi, V. (2010). Age-related differences in functional nodes of the brain cortex – a high model order group ICA study. Front. Sys. Neurosci. 4, 32. doi: 10.3389/fnsys.2010.00032
Lowe, M. J., Dzemidizic, M., Lurito, J. T., Mathews, V. P., and Phillips, M. D. (2000). Correlations in low-frequency BOLD fluctuations reflect cortico-cortical connections. Neuroimage 12, 582–587.
Margulies, D. S., Kelly, C., Uddin, L. Q., Bharat, B. B., Castenllanos, F. X., and Milham, M. P. (2007). Mapping the functional connectivity of the anterior cingulate cortex. Neuroimage 37, 579–588.
McKeown, M. J., Makeig, S., Brown, G. G., Kindermann, S., Bell, A., and Sejnowski, T. (1998). Analysis of fMRI data by blind source separation into independent spatial components. Hum. Brain Mapp. 6, 160–188.
Meunier, D., Achard, S., Morcom, A., and Bullmore, E. T. (2009b). Age-related changes in modular organization of human brain functional networks. Neuroimage 44, 715–723. doi: 10.3389/neuro.11.037.2009
Meunier, D., Lambiotte, R., Fronito, A., Ersche, K. D., and Bullmore, E. T. (2009a). Hierarchical modularity in human brain functional networks. Front. Neuroinformatics 3, 37.
Mohammadi, B., Kollewe, K., Samii, A., Krampfl, K., Dengler, R., and Münte, T. (2009). Changes of resting state brain networks in amyotrophic lateral sclerosis. Exp. Neurol. 217, 147–153.
Newman, M. E. J., and Girvan, M. (2004). Finding and evaluating community structure in networks. Phys. Rev. E 69, 026113.
Nichols, T. E., and Holmes, A. P. (2002). Nonparametric permutation tests for functional neuroimaging: a primer with examples. Hum. Brain Mapp. 15, 1–25.
Remes, J. J., Starck, T., Nikkinen, J., Ollila, E., Beckmann, C. F., Tervonen, O., Kiviniemi, V., and Silven, O. (2010). Effects of repeatability measures on results of fMRI sICA: a study on simulated and real resting-state effects. Neuroimage 56, 554–569.
Rombouts, S. A. R. B., Damoiseaux, J. S., Goekoop, R., Barkhof, F., Scheltens, P., Smith, S. M., and Beckmann, C. F. (2009). Model-free group analysis shows altered bold fMRI networks in dementia. Hum. Brain Mapp. 30, 256–266.
Salvador, R., Suckling, J., Coleman, M., Pickard, J. D., Menon, D., and Bullmore, E. (2005). Neurophysiological architecture of functional magnetic resonance images of human brain. Cereb. Cortex 15, 1332–1342.
Schwarz, A. J., Gozzi, A., and Bifone, A. (2008). Community structure and modularity in networks of correlated brain activity. Magn. Reson. Imaging 26, 914–920.
Seeley, W. W., Crawford, R. K., Zhou, J., Miller, B. L., and Greicius, M. D. (2009). Neurodegenerative diseases target large-scale human brain networks. Neuron 62, 42–52.
Seeley, W. W., Menon, V., Schatzberg, A. F., Keller, J., Glover, G. H., Kenna, H., Reiss, A. L., and Greicius, M. D. (2007). Dissociable intrinsic connectivity networks for salience processing and executive control. J. Neurosci. 27, 2349–2356.
Seifritz, E., Esposito, F., Hennel, F., Mustovic, H., Neuhoff, J. G., Bilecen, D., Tedeschi, G., Scheffler, K., and Di Salle, F. (2002). Spatiotemporal pattern of neural processing in the human auditory cortex. Science 297, 1706–1708.
Sheehan, D. V., Lecrubier, Y., Sheehan, K. H., Amorim, P., Janavs, J., Weiller, E., Hergueta, T., Baker, R., and Dunbar, G. C. (1998). The Mini-International Neuropsychiatric Interview (M.I.N.I.): the development and validation of a structured diagnostic psychiatric interview for DSM-IV and ICD-10. J. Clin. Psychiatry 59(Suppl. 20), S22–S33, quiz 34–57.
Shehzad, Z., Kelly, A. M., Reiss, P., Gee, D., Gotimer, K., Uddin, L. Q., Lee, S. H., Margulies, D. S., Roy, A., Biswal, B. B., Petkova, E., Castellanos, F. X., and Milham, M. P. (2009). The resting brain: unconstrained yet reliable. Cereb. Cortex 19, 2209–2229.
Sheline, Y. I., Prince, J. L., Yan, Z., and Mintun, M. A. (2010). Resting-state functional MRI in depression unmasks increased connectivity between networks via the dorsal nexus. Proc. Natl. Acad. Sci. U.S.A. 107, 11020–11025.
Smith, S. M., Fox, P. T., Miller, K. L., Glahn, D. C., Fox, P. M., Mackay, C. E., Filippini, N., Watkins, K. E., Toro, R., Laird, A. R., and Beckmann, C. F. (2009). Correspondence of the brain’s functional architecture during activation and rest. Proc. Natl. Acad. Sci. U.S.A. 106, 13040–13045.
Smith, S. M., and Nichols, T. S. (2009). Threshold-free cluster enhancement: addressing problems of smoothing, threshold dependence and localisation in cluster inference. Neuroimage 44, 83–98.
Stoffers, D., Bosboom, J. L. W., Deijen, J. B., Wolters, E. Ch., Stam, C. J., and Berendse, H. W. (2008). Increased cortico-cortical functional connectivity in early-stage Parkinson’s disease: an MEG study. Neuroimage 41, 212–222.
Strother, S. C., Anderson, J., Hansen, L. K., Kjems, U., Kustra, R., Sidtis, J., Frutinger, S., Muley, S., LaConte, S., and Rottenberg, D. (2002). The quantitative evaluation of functional neuroimaging experiments: the NPAIRS data analysis framework. Neuroimage 15, 747–771.
Strother, S. C., Oder, A., Spring, R., and Grady, C. (2010). “The NPAIRS computational statistics framework for data analysis in neuroimaging,” in 19th International Conference on Computational Statistics: Keynote, Invited and Contributed Papers, eds Y. Lechevallier and G. Saporta (Paris: Physica-Verlag, Springers), 111–120.
Valencia, M., Pastor, M. A., Fernandez-Seara, M. A., Artieda, J., Martinerie, J., and Chavez, M. (2009). Complex modular structure of large-scale brain networks. Chaos 19, 023119.
Van de Ven, V., Formisano, E., Prvulovic, D., Roeder, C., and Linden, D. (2004). Functional connectivity as revealed by spatial independent component analysis of fMRI measurements during rest. Hum. Brain Mapp. 22, 165–178.
van den Heuvel, M., Mandl, R., and Hulshoff, P. (2008). Normalized cut group clustering of resting-state fMRI data. PLoS ONE 3, e2001. doi: 10.1371/journal.pone.0002001
Veer, I. M., Beckmann, C. F., Baerends, E., van Tol, M. J., Ferrarini, L., Milles, J. R., Veltman, D. J., Aleman, A., van Buchem, M. A., van der Wee, N. J., and Rombouts, S. A. (2010). Whole Brain resting-State analysis reveals decreased functional connectivity in major depression. Front. Neurosci. 4, 41. doi: 10.3389/fnsys.2010.00041
Wolf, R. C., Sambataro, F., Vasic, N., Schönfeldt-Lecuona, C., Ecker, D., and Landwehrmeyer, B. (2008). Aberrant connectivity of lateral prefrontal networks in presymptomatic Huntington’s disease. Exp. Neurol. 213, 137–144.
Yourganov, G., Chen, X., Lukic, A. S., Grady, C. L., Small, S. L., Wernick, M. N., and Strother, S. C. (2010). Dimensionality estimation for optimal detection of functional networks in BOLD fMRI data. NeuroImage 56, 531–543.
Ystad, M., Eichele, T., Lundervold, A. J., and Lundervold, A. (2010). Subcortical functional connectivity and verbal episodic memory in healthy elderly – a resting state fMRI study. Neuroimage 52, 279–388.
Zhang, H. Y., Wang, S. J., Liu, B., Ma, Z. L., Yang, M., Zhang, Z. J., and Teng, G. J. (2010). Resting brain connectivity: changes during the progress of Alzheimer disease. Radiology 256, 598–606.
Zhang, Z., Lu, G., Zhong, Y., Tan, Q., Yang, Z., Liao, W., Chen, Z., Shi, J., and Liu, Y. (2009). Impaired attention network in temporal lobe epilepsy: a resting fMRI study. Neurosci. Lett. 458, 97–101.
Zhou, Y., Yu, C., Zheng, H., Liu, Y., Song, M., Qin, W., Li, K., and Jiang, T. (2009). Increased neural resources recruitment in the intrinsic organization in major depression. J. Affect. Disord. 121, 220–230.
Keywords: resting-state, fMRI, ICA, model order, functional connectivity, dual regression, modularity, seasonal affective disorder
Citation: Abou Elseoud A, Littow H, Remes J, Starck T, Nikkinen J, Nissilä J, Timonen M, Tervonen O and Kiviniemi V (2011) Group-ICA model order highlights patterns of functional brain connectivity. Front. Syst. Neurosci. 5:37. doi: 10.3389/fnsys.2011.00037
Received: 19 November 2010; Accepted: 20 May 2011;
Published online: 03 June 2011.
Edited by:
Jose Bargas, Universidad Nacional Autónoma de México, MéxicoReviewed by:
Tom Eichele, University of Bergen, NorwayVince D. Calhoun, University of New Mexico, USA
Copyright: © 2011 Abou Elseoud, Littow, Remes, Starck, Nikkinen, Nissilä, Timonen, Tervonen and Kiviniemi. This is an open-access article subject to a non-exclusive license between the authors and Frontiers Media SA, which permits use, distribution and reproduction in other forums, provided the original authors and source are credited and other Frontiers conditions are complied with.
*Correspondence: Ahmed Abou Elseoud, Department of Diagnostic Radiology, Oulu University Hospital, P.O.Box 50, 90029 OYS, Oulu, Finland. e-mail: ahmed.abou.elsoud@oulu.fi; abouelseoud.ahmed@gmail.com