Ascending Axonal Degeneration of the Corticospinal Tract in Pure Hereditary Spastic Paraplegia: A Cross-Sectional DTI Study

 , ,
, ,
Abstract
:
1. Introduction
2. Materials and Methods
2.1. Subjects
2.2. MR Imaging
2.3. Tract-Based Spatial Statistics
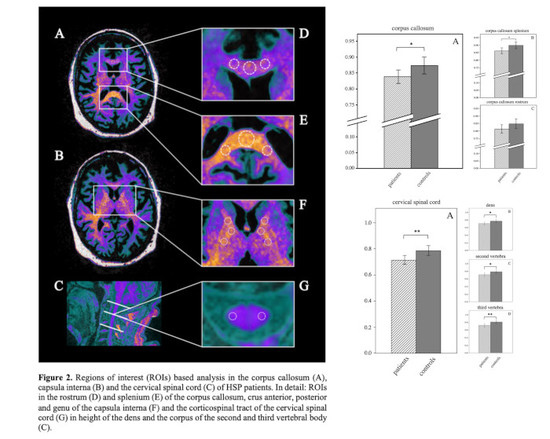
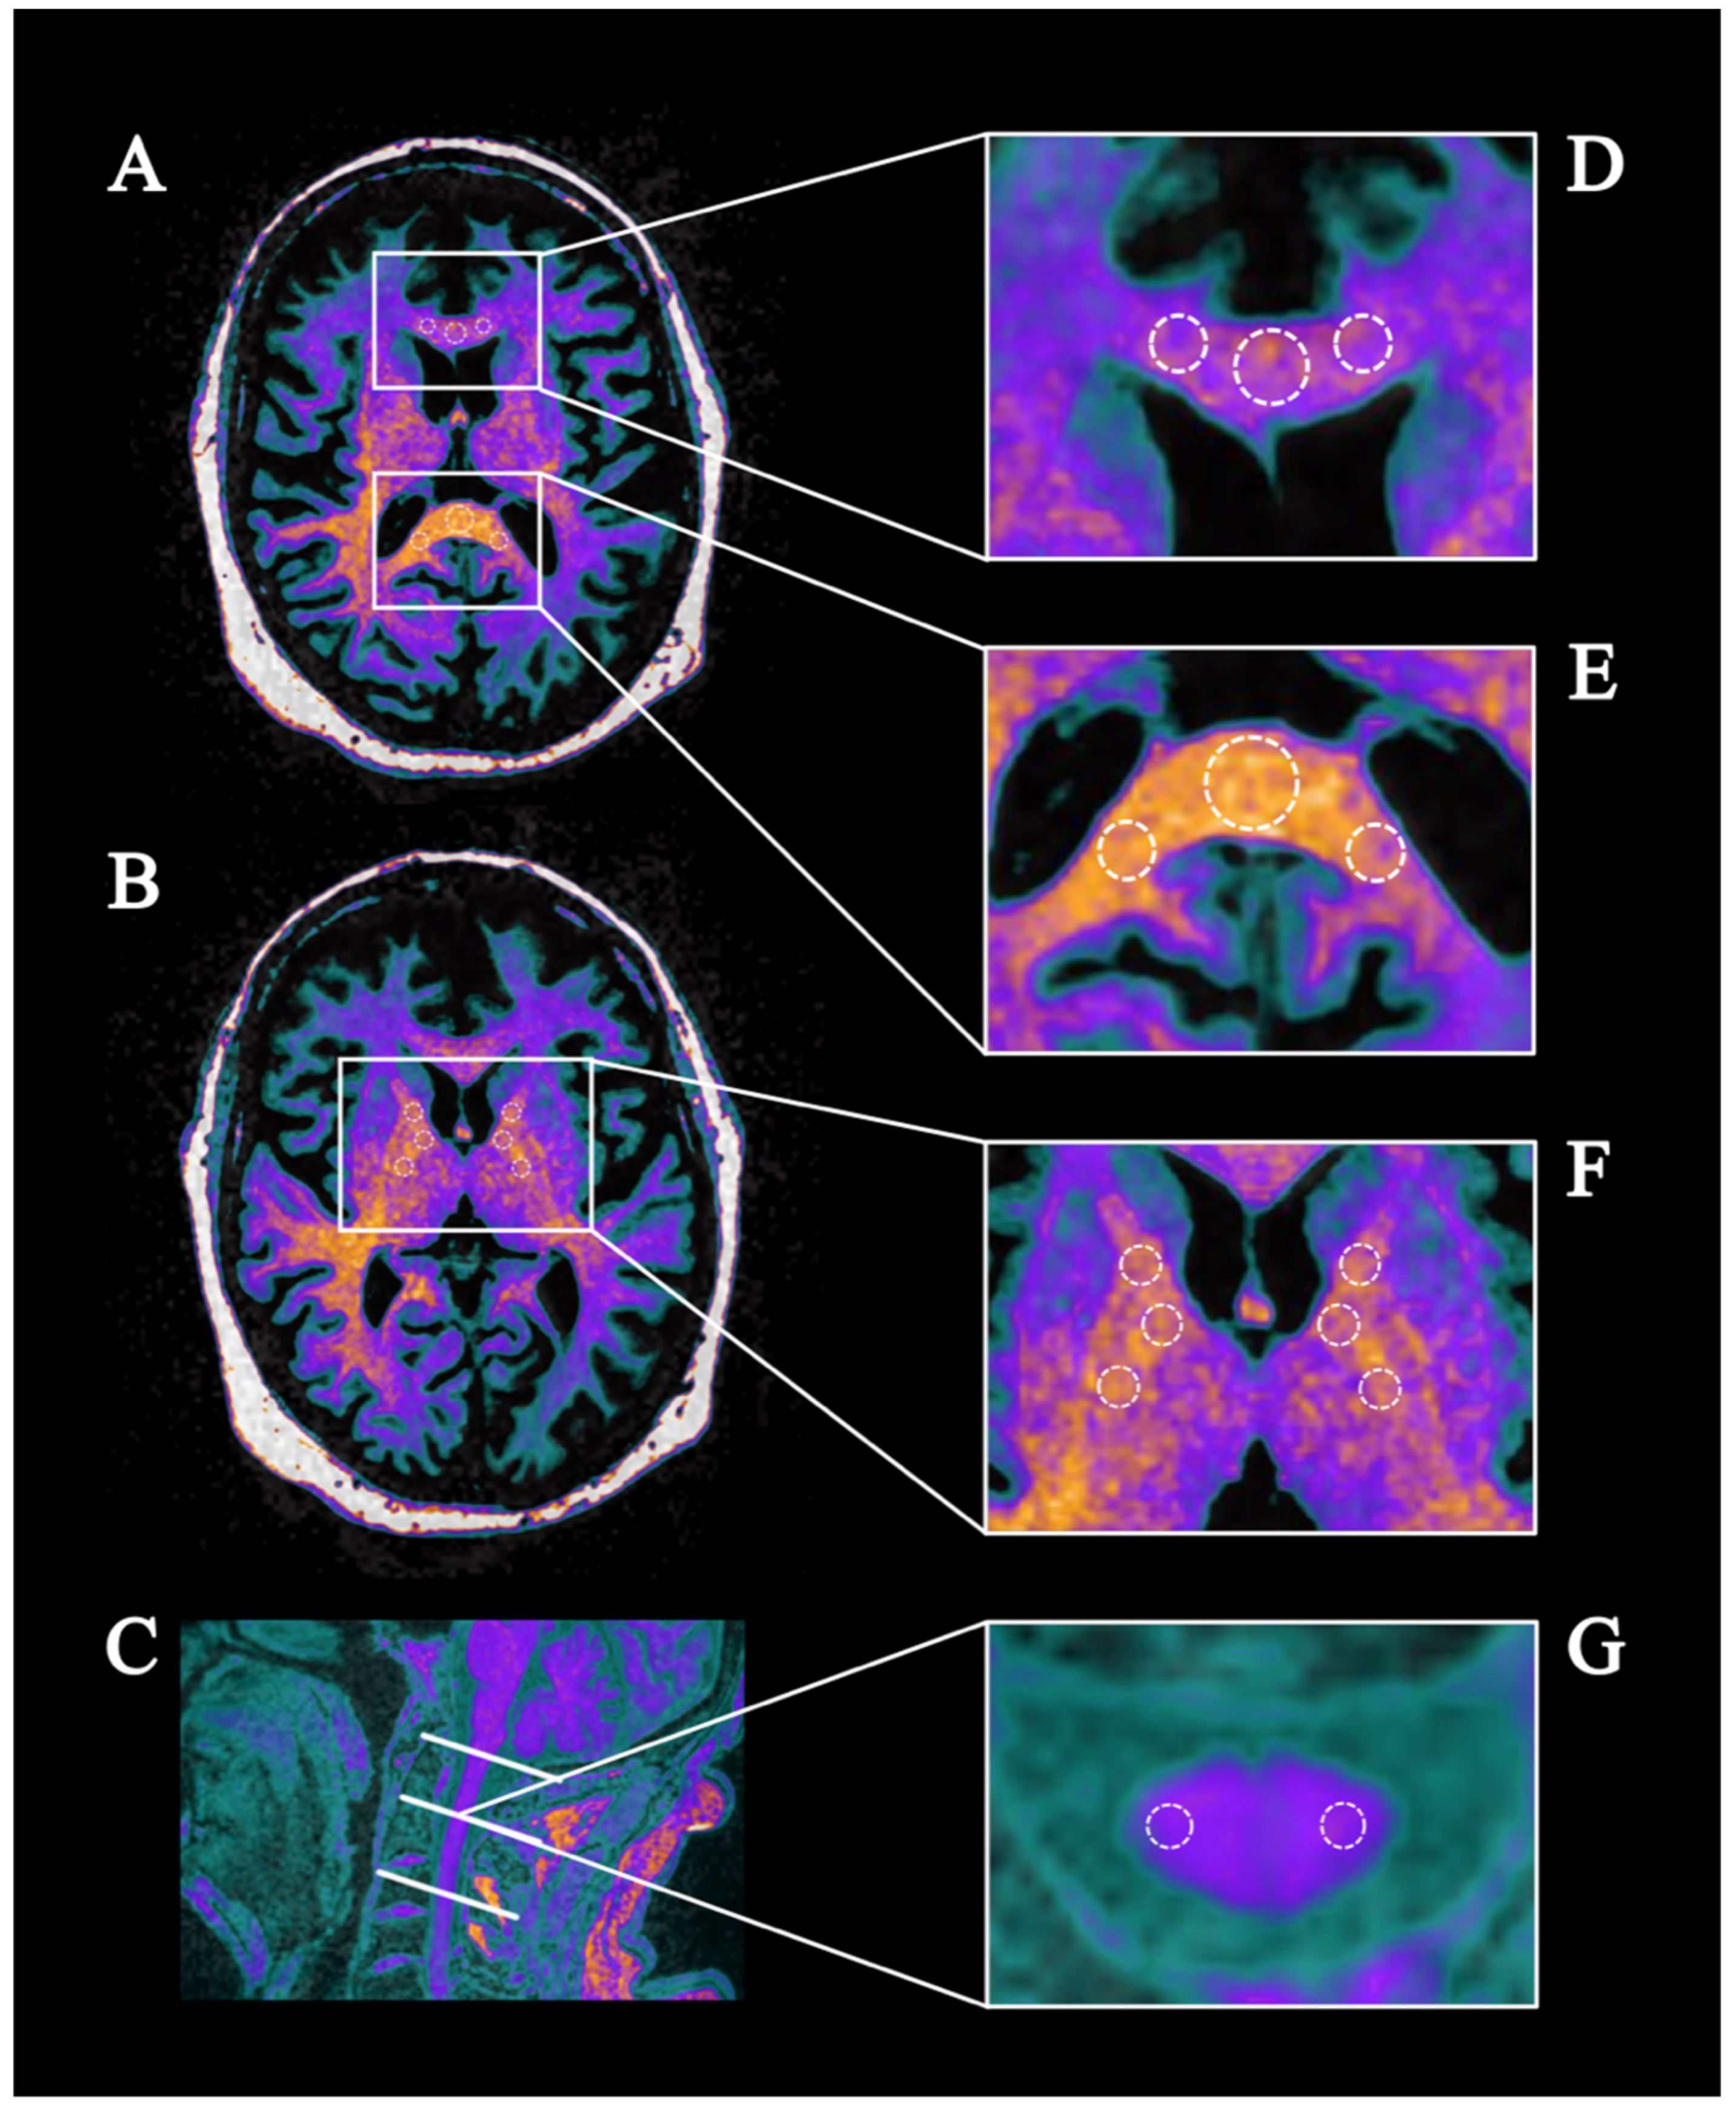
2.4. Region of Interest (ROI)-Based Analysis
2.5. Statistical Analysis
3. Results
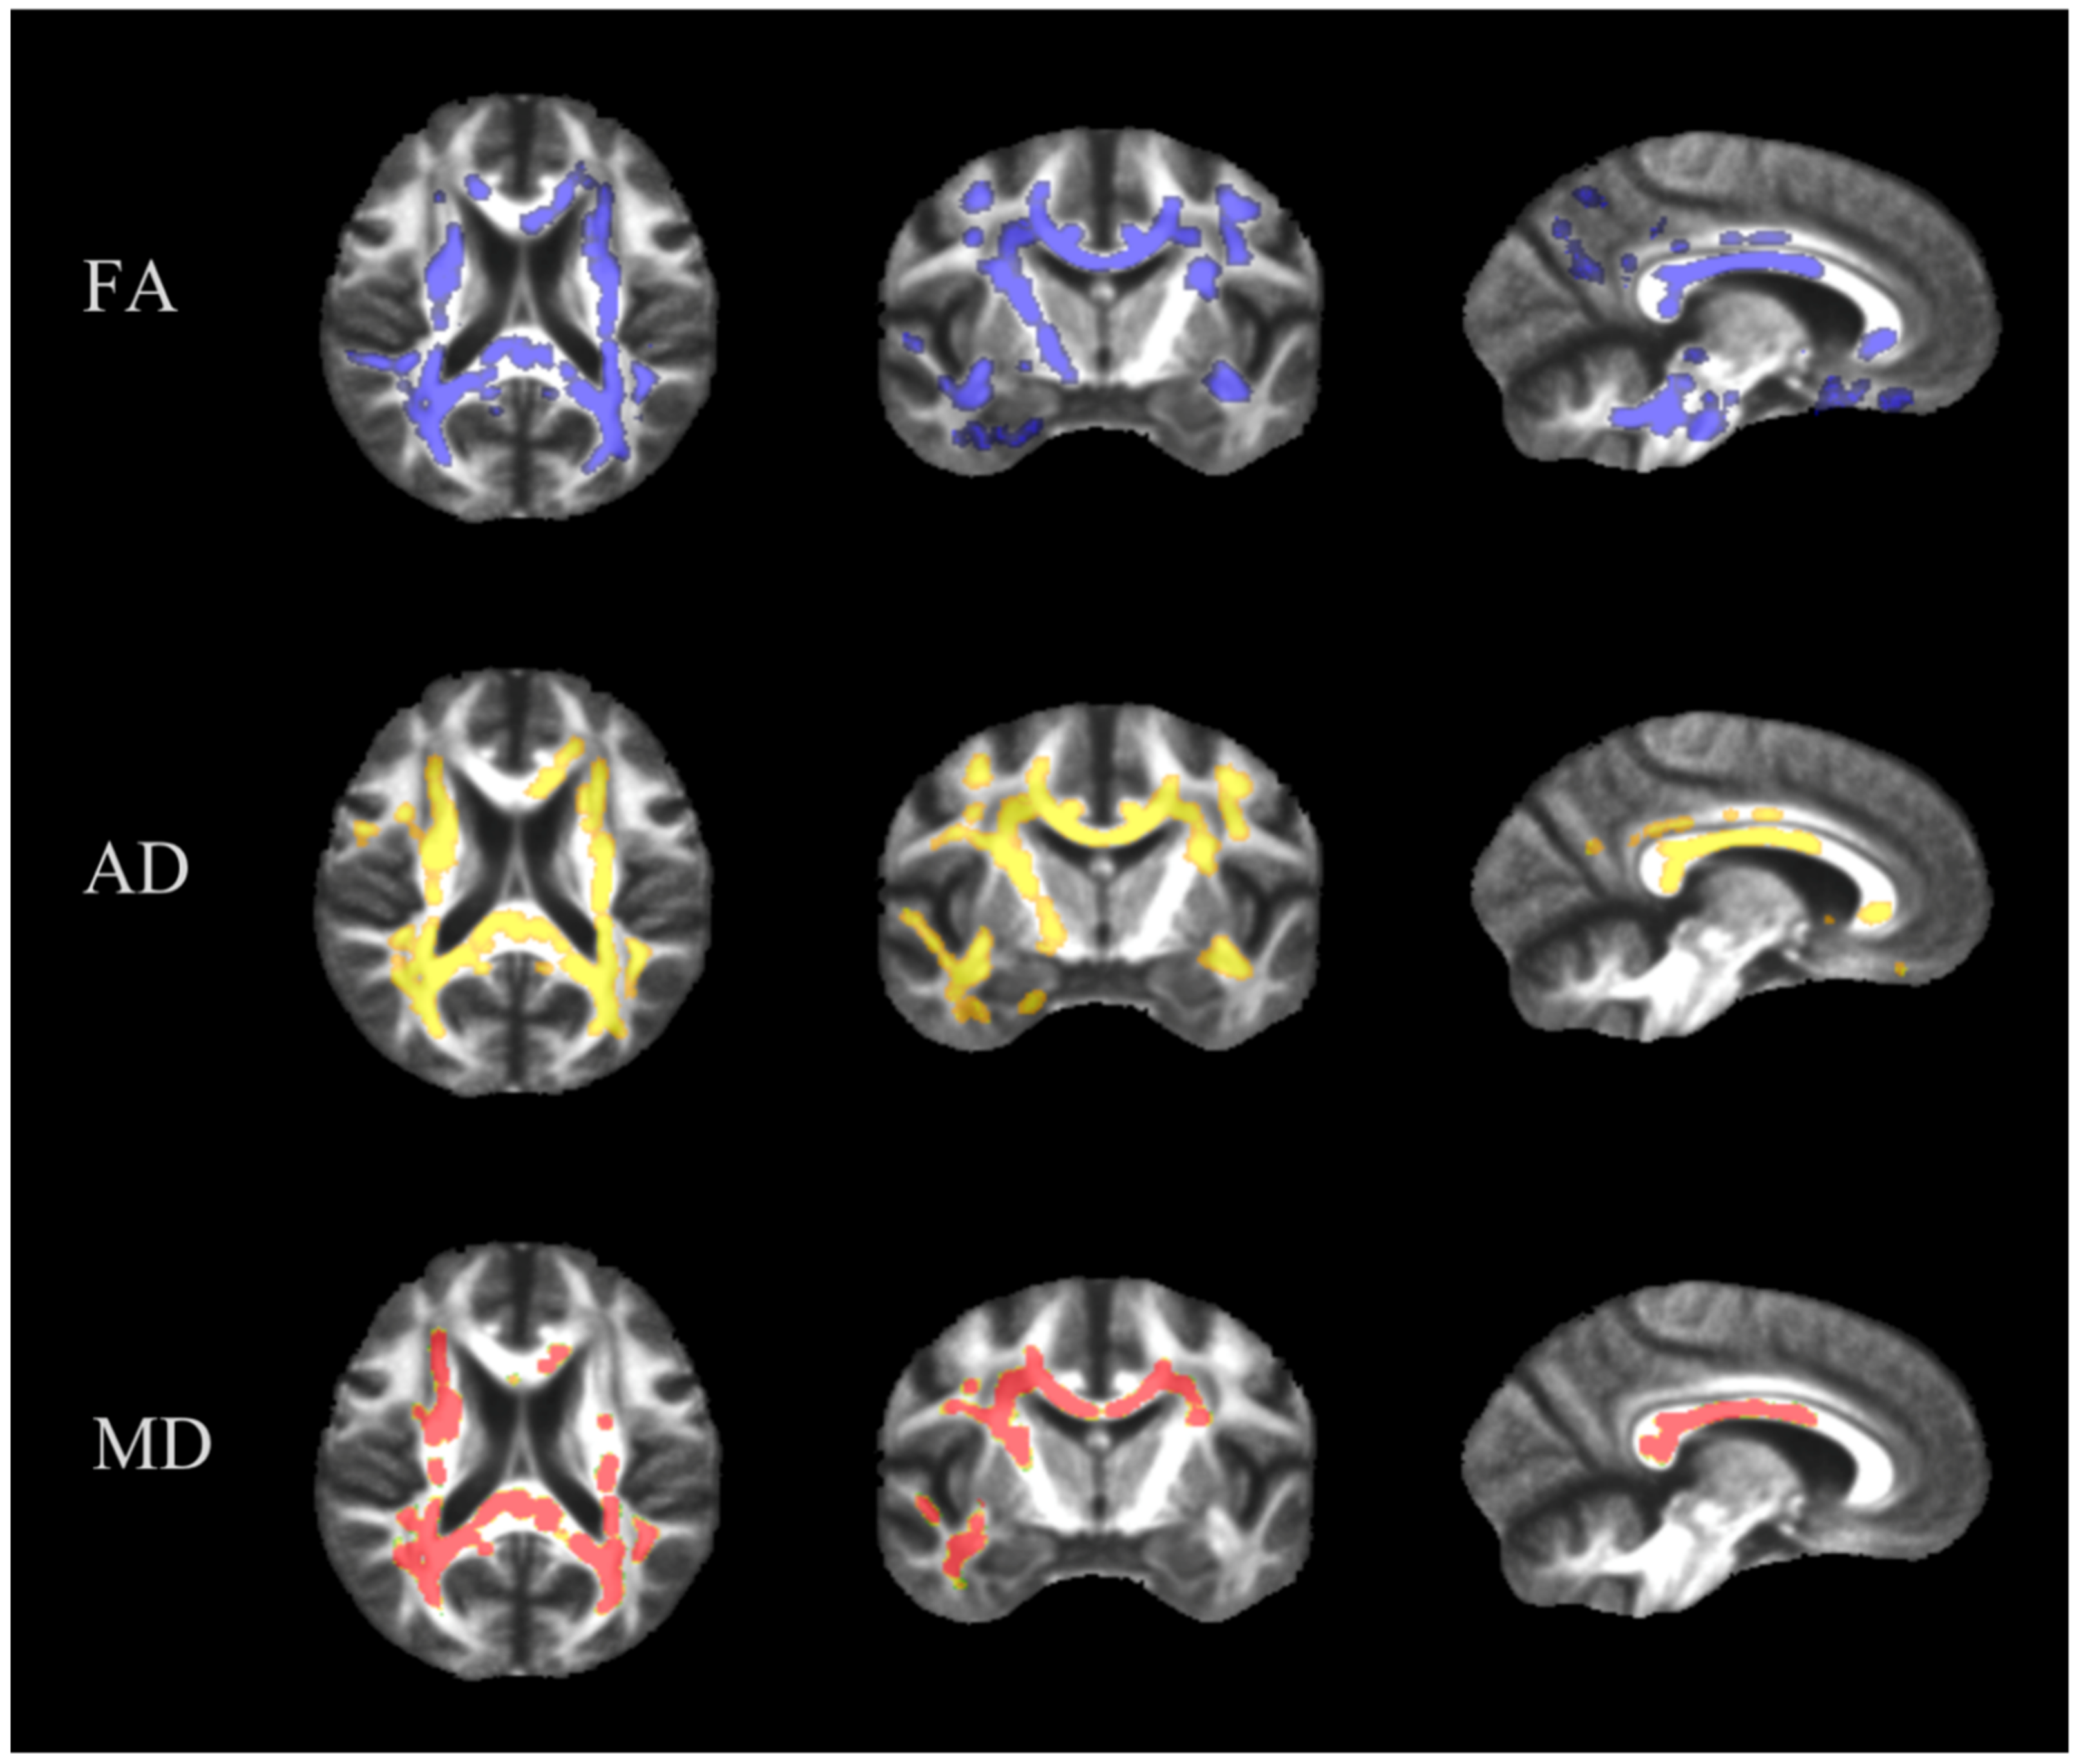
3.1. TBSS
3.2. ROI-Based Analysis
3.3. ROI-Based Analysis of the Internal Capsule
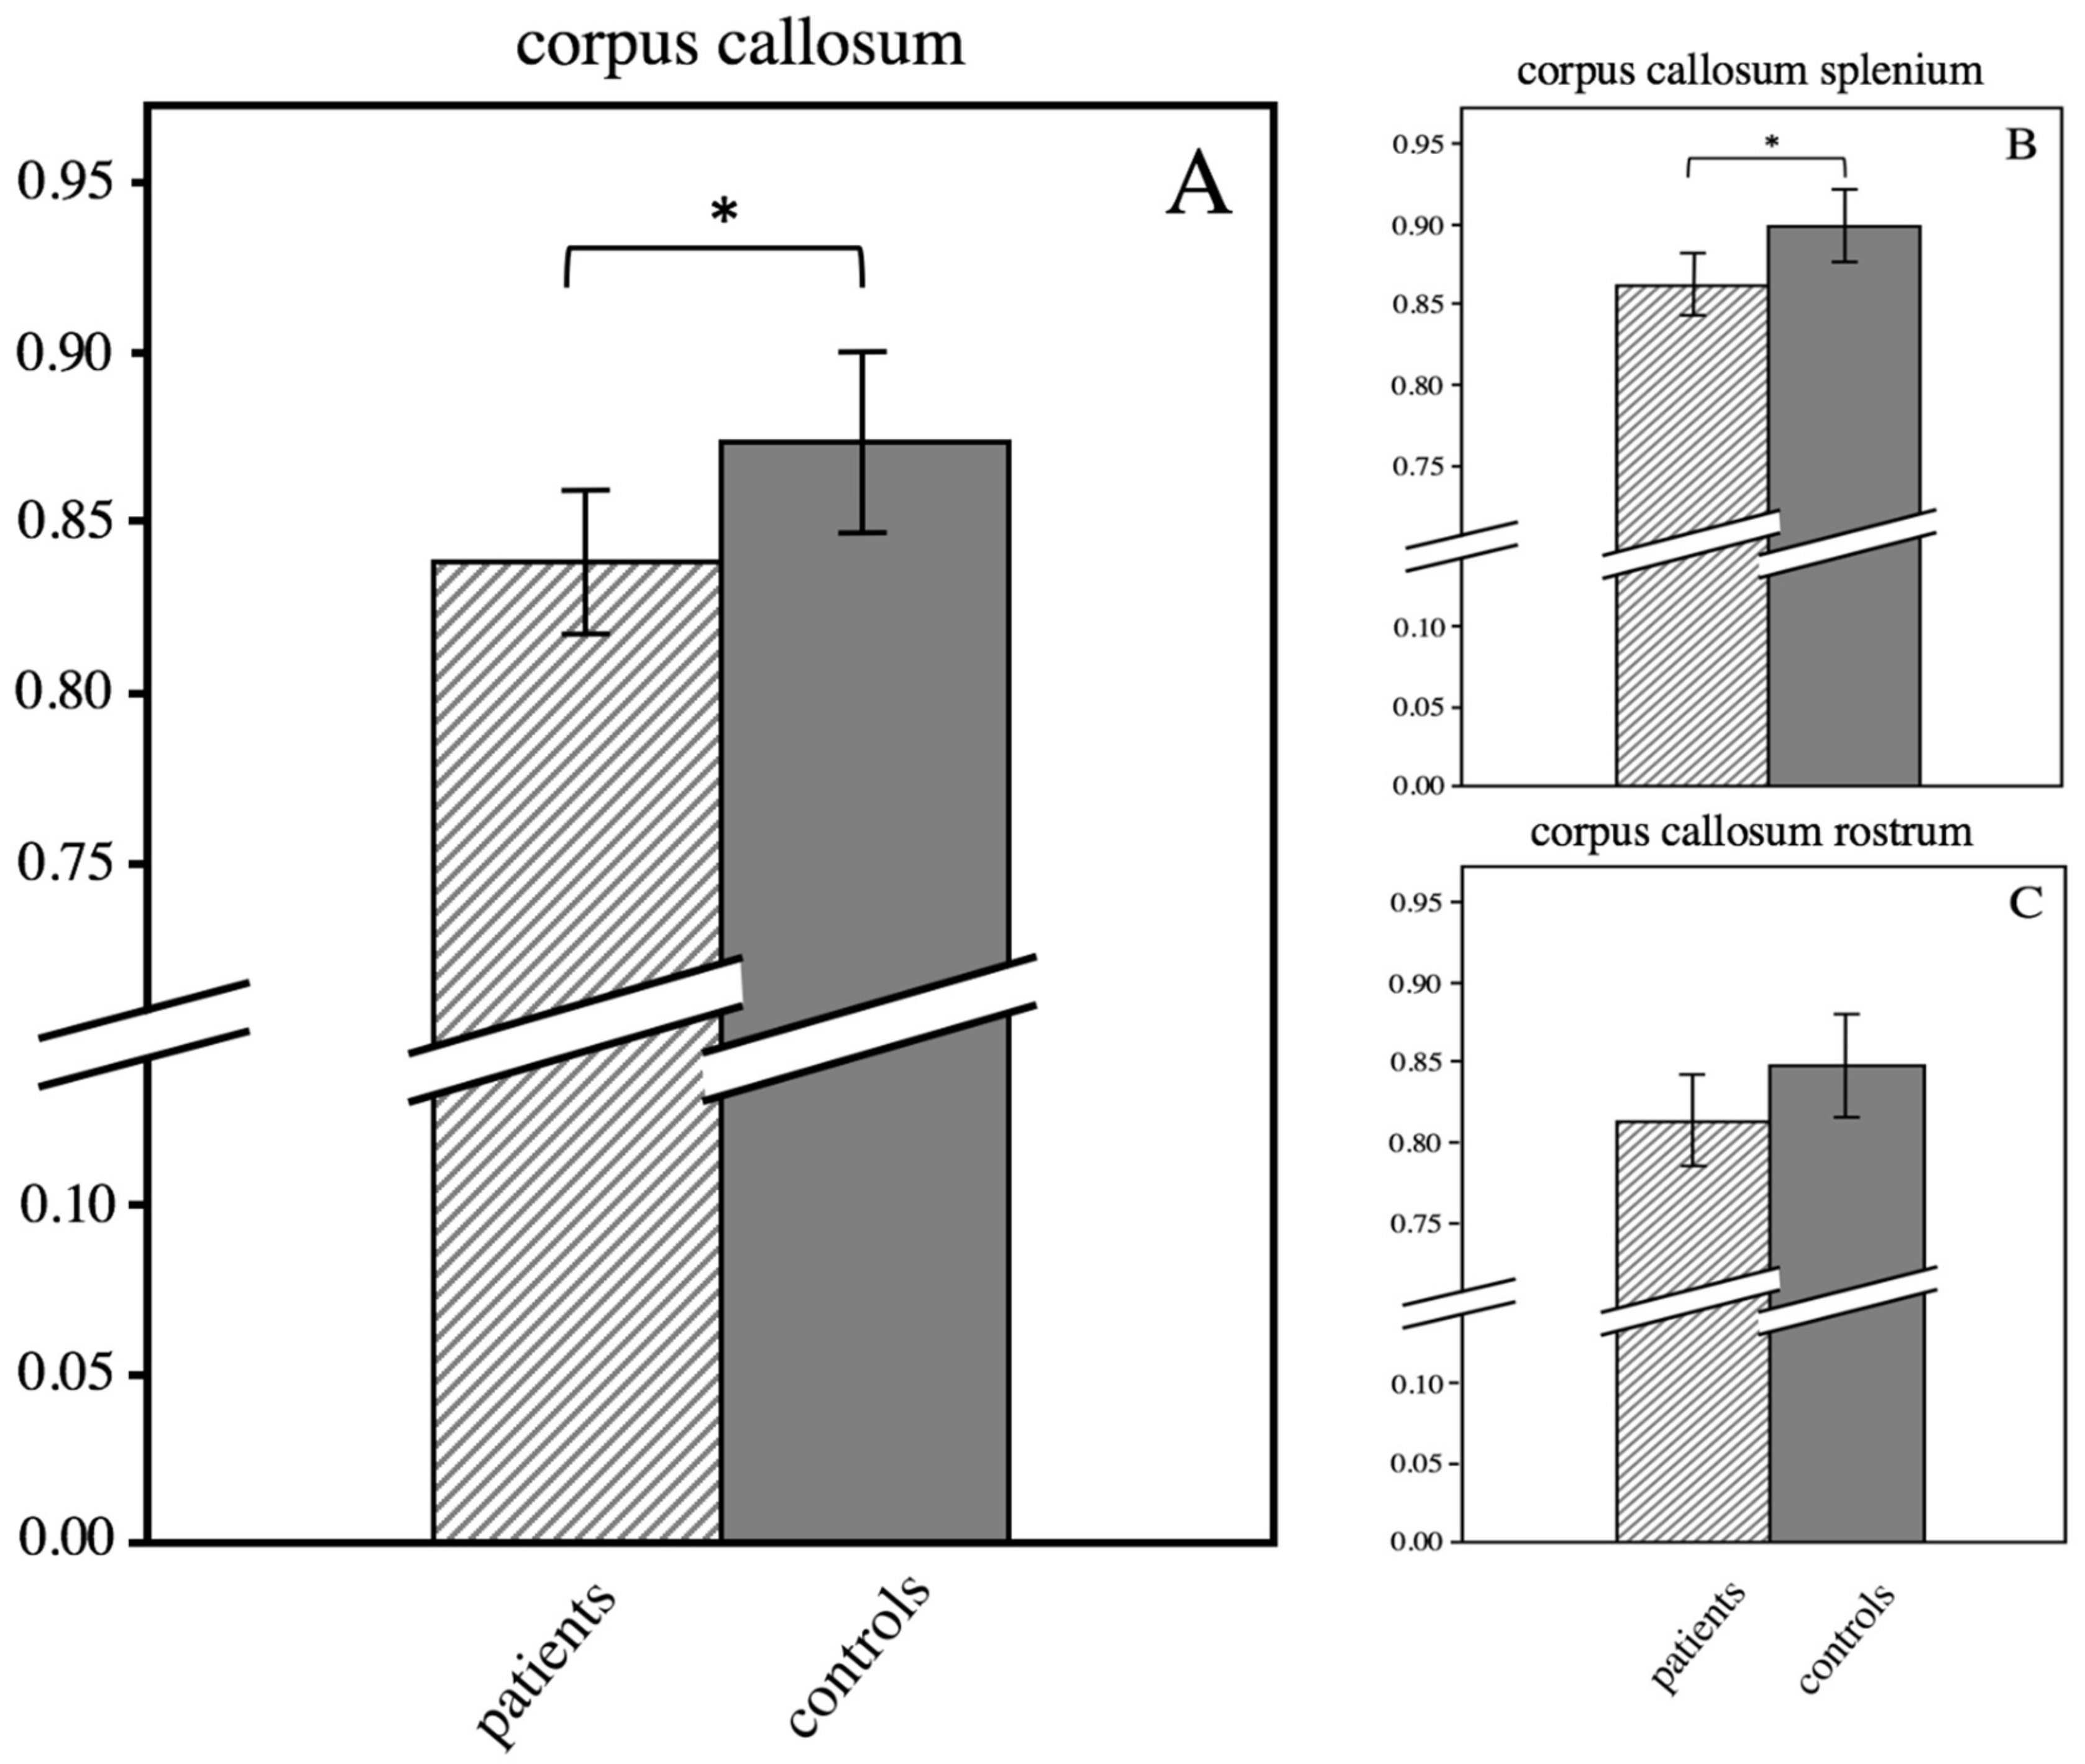
3.4. ROI-Based Analysis of the Corpus Callosum
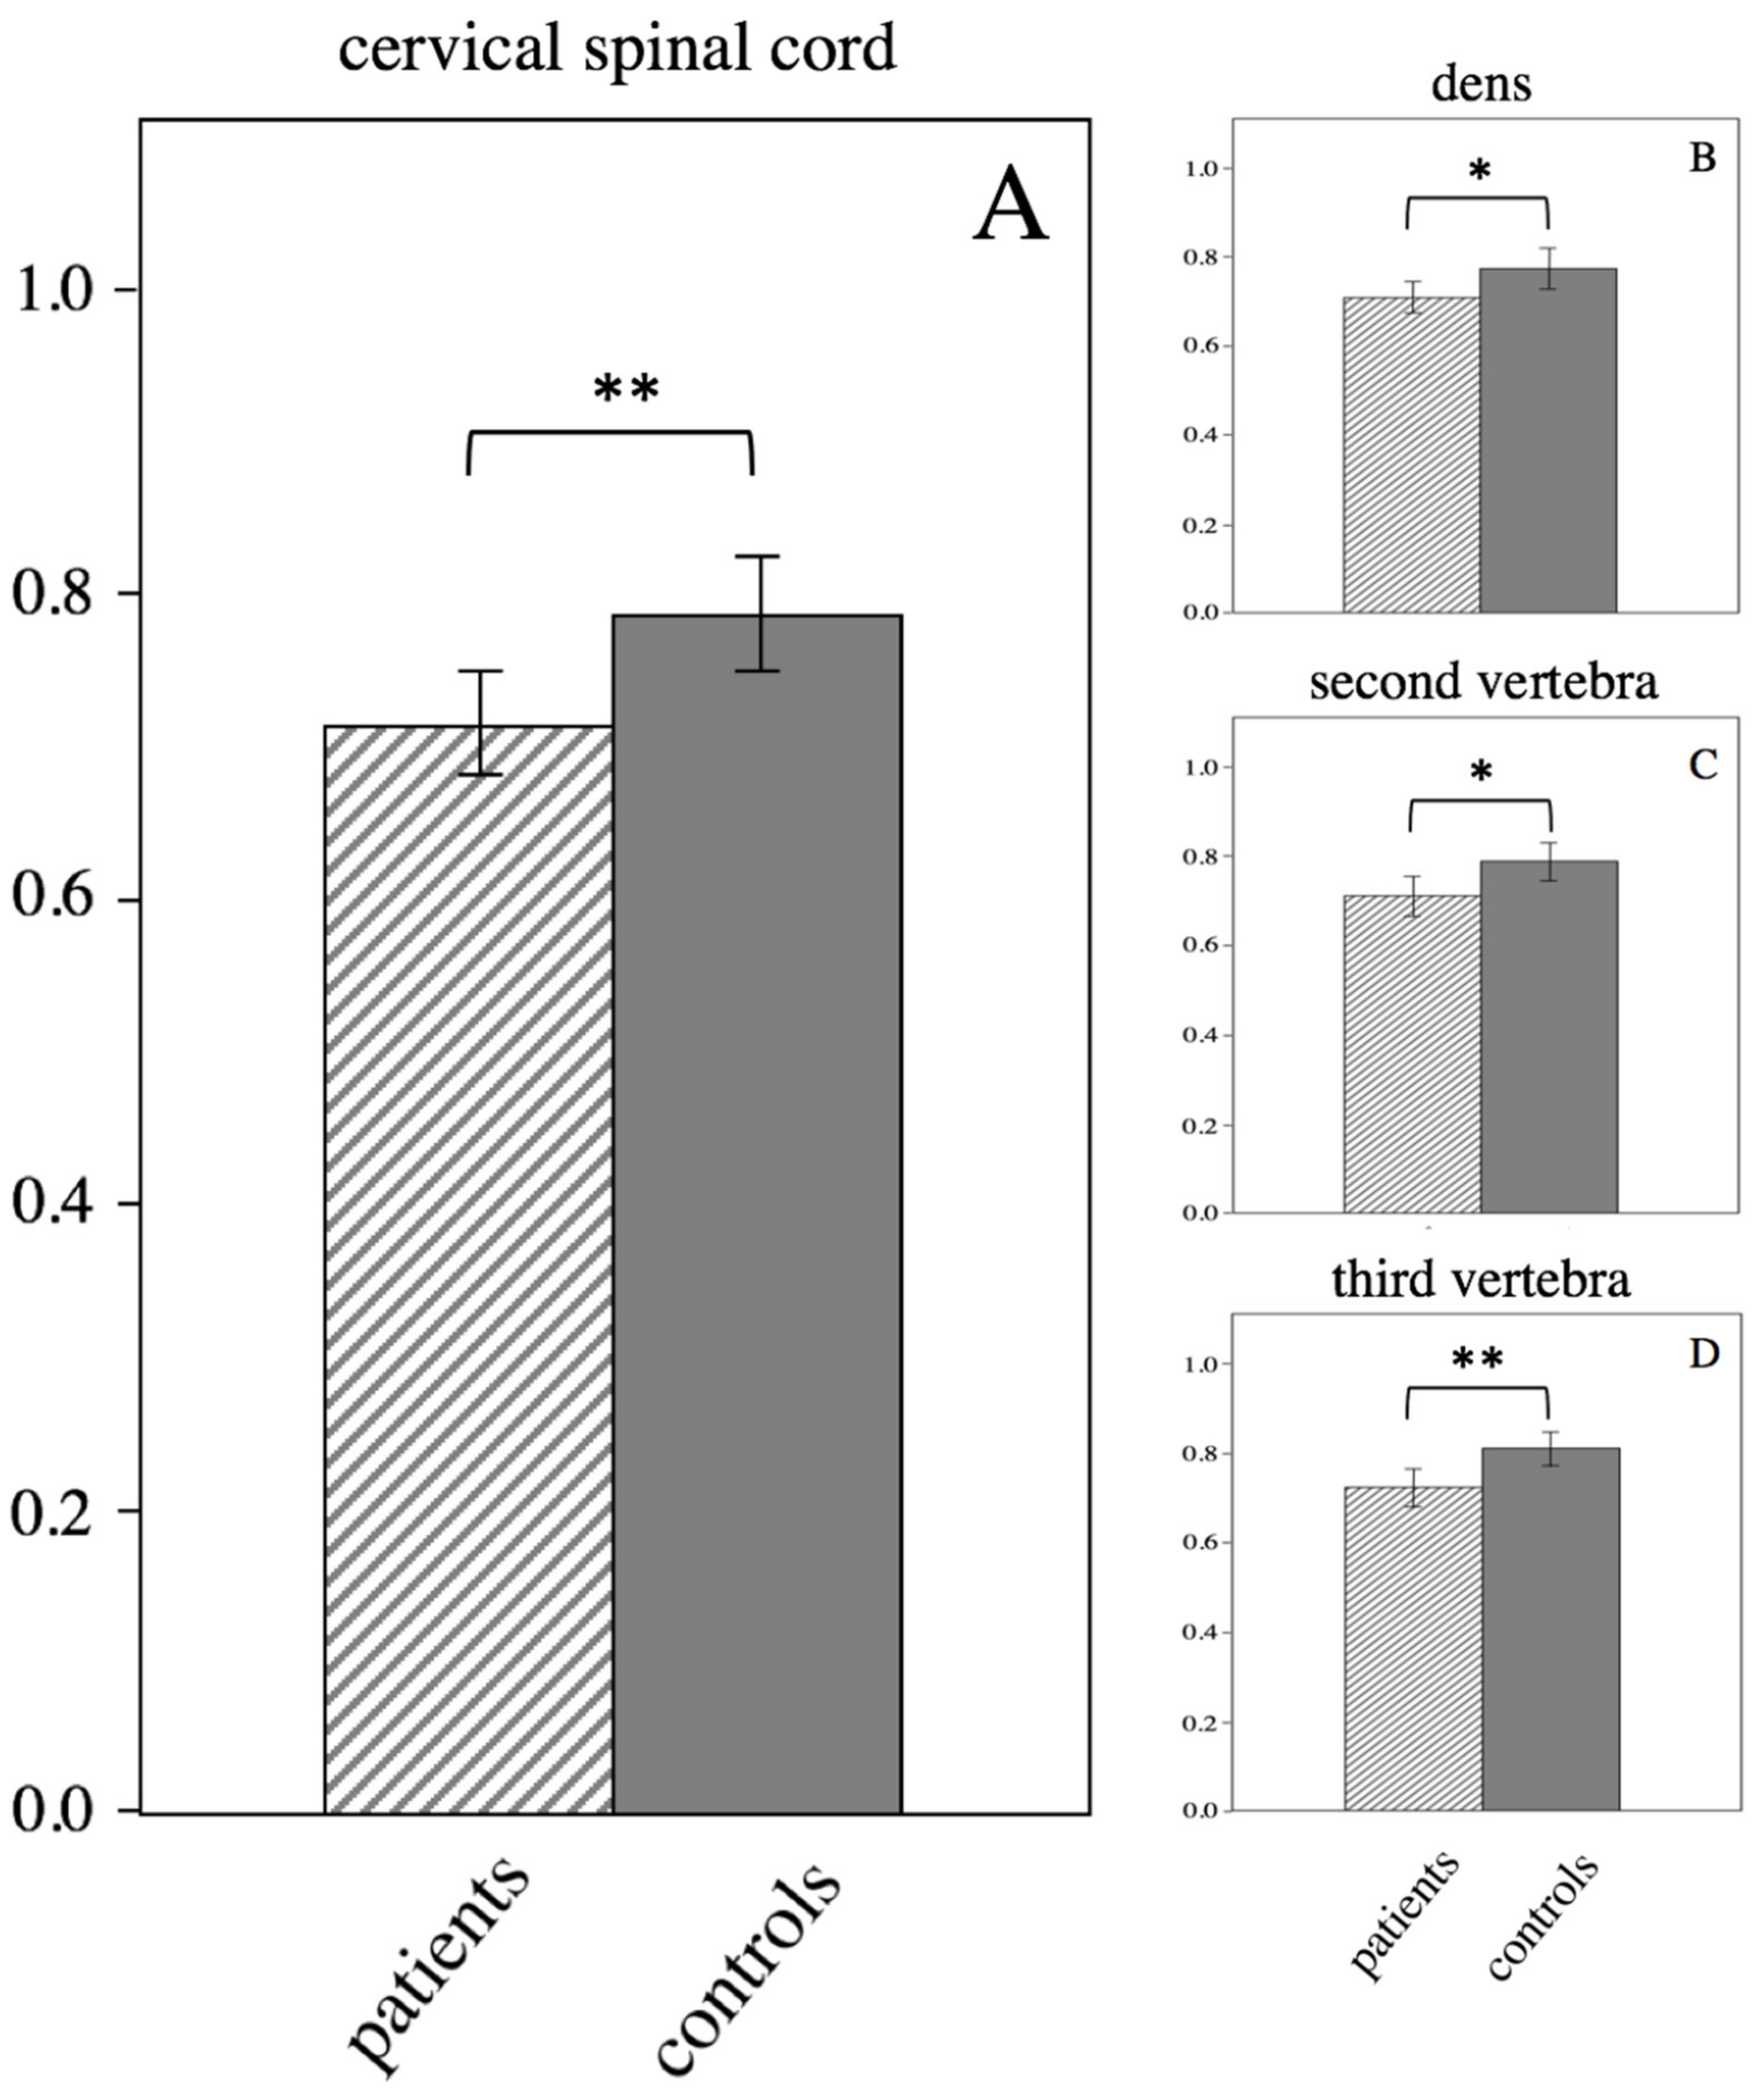
3.5. ROI-Based Analysis of the Cervical Spinal Cord
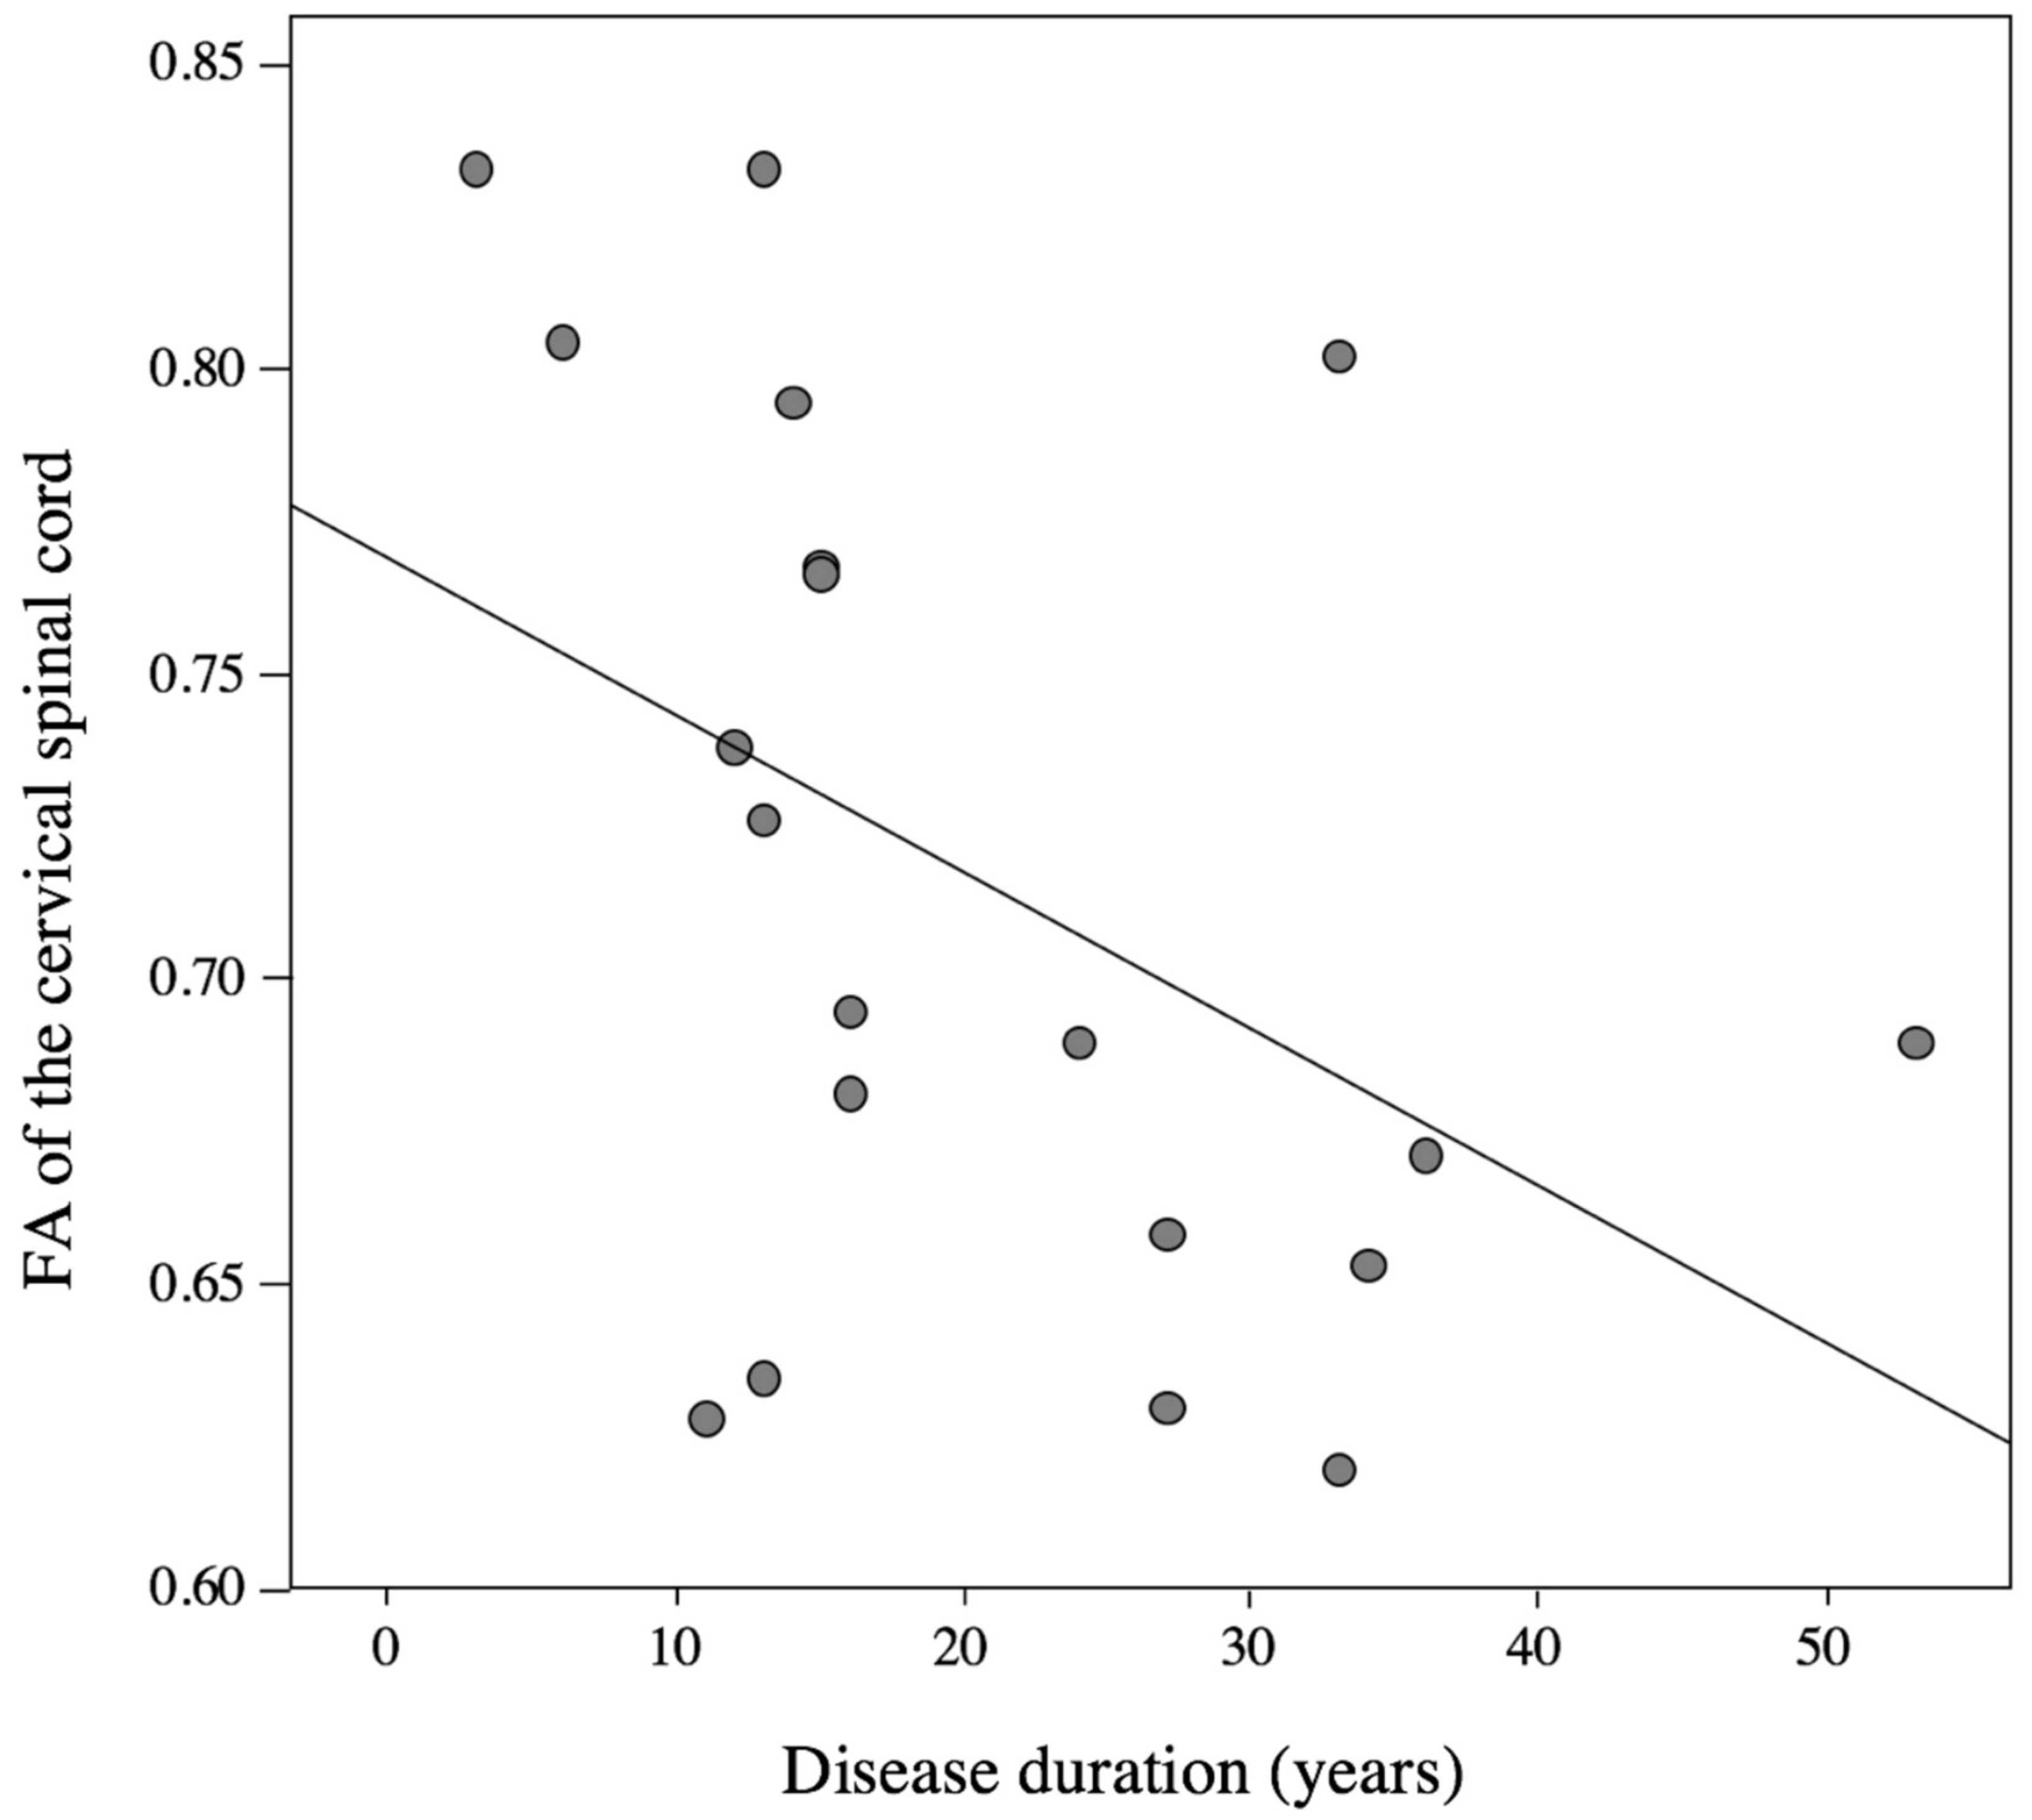
3.6. Correlation Analysis between DTI Parameters and Clinical Data
4. Discussion
5. Conclusions
Author Contributions
Funding
Acknowledgments
Conflicts of Interest
Abbreviations
| 1. | Hereditary spastic paraplegia (HSP) |
| 2. | High angular resolution diffusion tensor imaging (HARDI-DTI) |
| 3. | Tract-based spatial statistic (TBSS) |
| 4. | Fractional anisotropy (FA) |
| 5. | Corticospinal tract (CST) |
| 6. | Spastic paraplegia (SPG) |
| 7. | pure HSP (pHSP) |
| 8. | Region-of-interest (RO) |
| 9. | Spastic paraplegia rating scale (SPRS) |
| 10. | echo planar imaging (EPI) |
| 11. | NIfTI files (Neuroimaging Informatics Technology Initiative) |
| 12. | FMRIB Diffusion Toolbox (FDT) |
| 13. | standard deviation (SD) |
| 14. | interquartile range (IQR) |
| 15. | Axial diffusivity (AD) |
| 16. | Mean diffusivity (MD) |
| 17. | Radial diffusivity (RD) |
References
- Blackstone, C. Cellular pathways of hereditary spastic paraplegia. Annu. Rev. Neurosci. 2012, 35, 25–47. [Google Scholar] [CrossRef] [PubMed]
- Harding, A. Hereditary Spastic Paraplegias. Semin. Neurol. 1993, 13, 333–336. [Google Scholar] [CrossRef] [PubMed]
- Harding, A. Classification of the hereditary ataxias and paraplegias. Lancet 1983, 321, 1151–1155. [Google Scholar] [CrossRef]
- Ruano, L.; Melo, C.; Silva, M.C.; Coutinho, P. The Global Epidemiology of Hereditary Ataxia and Spastic Paraplegia: A Systematic Review of Prevalence Studies. Neuroepidemiology 2014, 42, 174–183. [Google Scholar] [CrossRef] [PubMed]
- Erichsen, A.K.; Koht, J.; Stray-Pedersen, A.; Abdelnoor, M.; Tallaksen, C.M.E. Prevalence of hereditary ataxia and spastic paraplegia in southeast Norway: A population-based study. Brain 2009, 132, 1577–1588. [Google Scholar] [CrossRef]
- Coutinho, P.; Ruano, L.; Loureiro, J.L.; Cruz, V.T.; Barros, J.; Tuna, A.; Silva, M.C. Hereditary ataxia and spastic paraplegia in Portugal: a population-based prevalence study. JAMA Neurol. 2013, 70, 746–755. [Google Scholar] [CrossRef] [PubMed]
- Klebe, S.; Stevanin, G.; Depienne, C. Clinical and genetic heterogeneity in hereditary spastic paraplegias: From SPG1 to SPG72 and still counting. Rev. Neurol. 2015, 171, 505–530. [Google Scholar] [CrossRef] [Green Version]
- Novarino, G.; Fenstermaker, A.G.; Zaki, M.S.; Hofree, M.; Silhavy, J.L.; Heiberg, A.D.; Abdellateef, M.; Rosti, B.; Scott, E.; Mansour, L.; et al. Exome sequencing links corticospinal motor neuron disease to common neurodegenerative disorders. Science 2014, 343, 506–511. [Google Scholar] [CrossRef]
- Lo Giudice, T.; Lombardi, F.; Santorelli, F.M.; Kawarai, T.; Orlacchio, A. Hereditary spastic paraplegia: Clinical-genetic characteristics and evolving molecular mechanisms. Exp. Neurol. 2014, 261, 518–539. [Google Scholar] [CrossRef]
- Orlen, H.; Melberg, A.; Raininko, R.; Kumlien, E.; Entesarian, M.; Soderberg, P.; Dahl, N. SPG11 mutations cause Kjellin syndrome, a hereditary spastic paraplegia with thin corpus callosum and central retinal degeneration. Am. J. Med. Genet. B. Neuropsychiatr. Genet. 2009, 150, 984–992. [Google Scholar] [CrossRef]
- Stromillo, M.L.; Malandrini, A.; Dotti, M.T.; Battaglini, M.; Borgogni, F.; Tessa, A.; Storti, E.; Denora, P.S.; Santorelli, F.M.; Gaudiano, C.; et al. Structural and metabolic damage in brains of patients with SPG11-related spastic paraplegia as detected by quantitative MRI. J. Neurol. 2011, 258, 2240–2247. [Google Scholar] [CrossRef] [PubMed]
- Hourani, R.; El-Hajj, T.; Barada, W.; Hourani, M.; Yamout, B. MR Imaging Findings in Autosomal Recessive Hereditary Spastic Paraplegia. Am. J. Neuroradiol. 2009, 30, 936–940. [Google Scholar] [CrossRef] [PubMed] [Green Version]
- Goizet, C.; Boukhris, A.; Maltête, D.; Guyant-Maréchal, L.; Truchetto, J.; Mundwiller, E.; Hanein, S.; Jonveaux, P.; Roelens, F.; Loureiro, J.L.; et al. SPG15 is the second most common cause of hereditary spastic paraplegia with thin corpus callosum. Neurology 2009, 73, 1111–1119. [Google Scholar] [CrossRef]
- Agosta, F.; Scarlato, M.; Spinelli, E.G.; Canu, E.; Benedetti, S.; Bassi, M.T.; Casali, C.; Sessa, M.; Copetti, M.; Pagani, E.; et al. Hereditary Spastic Paraplegia: Beyond Clinical Phenotypes toward a Unified Pattern of Central Nervous System Damage. Radiology 2015, 276, 207–218. [Google Scholar] [CrossRef] [PubMed] [Green Version]
- Franca, M.C.; Yasuda, C.L.; Pereira, F.R.; D’abreu, A.; Lopes-Ramos, C.M.; Rosa, M.V.; Lopes-Cendes, I. White and grey matter abnormalities in patients with SPG11 mutations. J. Neurol. Neurosurg. Psychiatry 2012, 83, 828–833. [Google Scholar] [CrossRef]
- Oguz, K.K.; Sanverdi, E.; Has, A.; Temucin, C.; Turk, S.; Doerschner, K. Tract-based spatial statistics of diffusion tensor imaging in hereditary spastic paraplegia with thin corpus callosum reveals widespread white matter changes. Diagn. Interv. Radiol. 2013, 19, 181–186. [Google Scholar]
- Garaci, F.; Toschi, N.; Lanzafame, S.; Meschini, A.; Bertini, E.; Simonetti, G.; Floris, R. Diffusion tensor imaging in SPG11- and SPG4-linked hereditary spastic paraplegia. Int. J. Neurosci. 2014, 124, 261–270. [Google Scholar] [CrossRef]
- Rezende, T.J.R.; De Albuquerque, M.; Lamas, G.M.; Martinez, A.R.M.; Campos, B.M.; Casseb, R.F.; Silva, C.B.; Branco, L.M.T.; D’Abreu, A.; Lopes-Cendes, I.; et al. Multimodal MRI-Based Study in Patients with SPG4 Mutations. PLOS ONE 2015, 10, e0117666. [Google Scholar] [CrossRef]
- Duning, T.; Warnecke, T.; Schirmacher, A.; Schiffbauer, H.; Lohmann, H.; Mohammadi, S.; Young, P.; Deppe, M. Specific pattern of early white-matter changes in pure hereditary spastic paraplegia. Mov. Disord. 2010, 25, 1986–1992. [Google Scholar] [CrossRef]
- Lindig, T.; Bender, B.; Hauser, T.-K.; Mang, S.; Schweikardt, D.; Klose, U.; Karle, K.N.; Schüle, R.; Schöls, L.; Rattay, T.W. Gray and white matter alterations in hereditary spastic paraplegia type SPG4 and clinical correlations. J. Neurol. 2015, 262, 1961–1971. [Google Scholar] [CrossRef]
- Hedera, P.; Eldevik, O.P.; Maly, P.; Rainier, S.; Fink, J.K. Spinal cord magnetic resonance imaging in autosomal dominant hereditary spastic paraplegia. Neuroradiol. 2005, 47, 730–734. [Google Scholar] [CrossRef] [PubMed] [Green Version]
- Smith, S.M. Fast robust automated brain extraction. Hum. Brain Mapp. 2002, 17, 143–155. [Google Scholar] [CrossRef] [PubMed]
- Jenkinson, M.; Beckmann, C.F.; Behrens, T.E.; Woolrich, M.W.; Smith, S.M. FSL. NeuroImage 2012, 62, 782–790. [Google Scholar] [CrossRef] [PubMed] [Green Version]
- Wakana, S.; Caprihan, A.; Panzenboeck, M.M.; Fallon, J.H.; Perry, M.; Gollub, R.L.; Hua, K.; Zhang, J.; Jiang, H.; Dubey, P.; et al. Reproducibility of quantitative tractography methods applied to cerebral white matter. NeuroImage 2007, 36, 630–644. [Google Scholar] [CrossRef] [PubMed] [Green Version]
- Hua, K.; Zhang, J.; Wakana, S.; Jiang, H.; Li, X.; Reich, D.S.; Mori, S. Tract probability maps in stereotaxic spaces: Analyses of white matter anatomy and tract-specific quantification. Neuroimage 2008, 39, 336–347. [Google Scholar] [CrossRef] [PubMed] [Green Version]
- Douaud, G.; Jbabdi, S.; Behrens, T.E.; Menke, R.A.; Gass, A.; Monsch, A.U.; Rao, A.; Whitcher, B.; Kindlmann, G.; Matthews, P.M.; et al. DTI measures in crossing-fibre areas: Increased diffusion anisotropy reveals early white matter alteration in MCI and mild Alzheimer’s disease. NeuroImage 2011, 55, 880–890. [Google Scholar] [CrossRef] [PubMed]
- Salat, D.; Tuch, D.; Greve, D.; Van Der Kouwe, A.; Hevelone, N.; Zaleta, A.; Rosen, B.; Fischl, B.; Corkin, S.; Rosas, H.D.; et al. Age-related alterations in white matter microstructure measured by diffusion tensor imaging. Neurobiol. Aging 2005, 26, 1215–1227. [Google Scholar] [CrossRef]
- Unrath, A.; Riecker, A.; Ludolph, A.C.; Kassubek, J.; Müller, H.-P.; Sperfeld, A.-D.; Müller, H.; Sperfeld, A. Whole brain-based analysis of regional white matter tract alterations in rare motor neuron diseases by diffusion tensor imaging. Hum. Brain Mapp. 2010, 31, 1727–1740. [Google Scholar] [CrossRef]
- Alexander, A.L.; Lee, J.E.; Lazar, M.; Field, A.S. Diffusion tensor imaging of the brain. Neurotherapeutics 2007, 4, 316–329. [Google Scholar] [CrossRef] [Green Version]
- Aghakhanyan, G.; Martinuzzi, A.; Frijia, F.; Vavla, M.; Hlavata, H.; Baratto, A.; Martino, N.; Paparella, G.; Montanaro, D. Brain White Matter Involvement in Hereditary Spastic Paraplegias: Analysis with Multiple Diffusion Tensor Indices. Am. J. Neuroradiol. 2014, 35, 1533–1538. [Google Scholar] [CrossRef] [Green Version]
- Dreha-Kulaczewski, S.; Dechent, P.; Helms, G.; Frahm, J.; Gärtner, J.; Brockmann, K. Cerebral metabolic and structural alterations in hereditary spastic paraplegia with thin corpus callosum assessed by MRS and DTI. Neuroradiology 2006, 48, 893–898. [Google Scholar] [CrossRef] [PubMed]
- Sadeghi, N.; Arrigoni, F.; D’angelo, M.G.; Thomas, C.; Irfanoglu, M.O.; Hutchinson, E.B.; Pierpaoli, C. Tensor-based morphometry using scalar and directional information of diffusion tensor MRI data (DTBM): Application to hereditary spastic paraplegia. Hum. Brain Mapp. 2018, 39, 4643–4651. [Google Scholar] [CrossRef] [PubMed]
- Martinuzzi, A.; Montanaro, D.; Vavla, M.; Paparella, G.; Bonanni, P.; Musumeci, O.; Brighina, E.; Hlavata, H.; Rossi, G.; Aghakhanyan, G.; et al. Clinical and Paraclinical Indicators of Motor System Impairment in Hereditary Spastic Paraplegia: A Pilot Study. PloS ONE 2016, 11, e0153283. [Google Scholar] [CrossRef] [PubMed]
- Servelhere, K.R.; Faber, I.; Saute, J.A.M.; Moscovich, M.; D’Abreu, A.; Jardim, L.B.; Teive, H.A.G.; Lopes-Cendes, I.; França, M.C. Non-motor symptoms in patients with hereditary spastic paraplegia caused by SPG4 mutations. Eur. J. Neurol. 2016, 23, 408–411. [Google Scholar] [CrossRef] [PubMed]
- Solowska, J.M.; Baas, P.W. Hereditary spastic paraplegia SPG4: what is known and not known about the disease. Brain 2015, 138, 2471–2484. [Google Scholar] [CrossRef] [PubMed] [Green Version]
- Wharton, S.B.; McDermott, C.J.; Grierson, A.J.; Wood, J.D.; Gelsthorpe, C.; Ince, P.G.; Shaw, P.J. The Cellular and Molecular Pathology of the Motor System in Hereditary Spastic Paraparesis due to Mutation of the Spastin Gene. J. Neuropathol. Exp. Neurol. 2003, 62, 1166–1177. [Google Scholar] [CrossRef] [Green Version]
- Song, S.-K.; Sun, S.-W.; Ramsbottom, M.J.; Chang, C.; Russell, J.; Cross, A.H. Dysmyelination Revealed through MRI as Increased Radial (but Unchanged Axial) Diffusion of Water. NeuroImage 2002, 17, 1429–1436. [Google Scholar] [CrossRef]
- Budde, M.D.; Xie, M.; Cross, A.H.; Song, S.-K. Axial diffusivity is the primary correlate of axonal injury in the experimental autoimmune encephalomyelitis spinal cord: A quantitative pixelwise analysis. J. Neurosci. 2009, 29, 2805–2813. [Google Scholar] [CrossRef]
- Metwalli, N.S.; Benatar, M.; Nair, G.; Usher, S.; Hu, X.; Carew, J.D. Utility of axial and radial diffusivity from diffusion tensor MRI as markers of neurodegeneration in amyotrophic lateral sclerosis. Brain Res. 2010, 1348, 156–164. [Google Scholar] [CrossRef]
- Fink, J.K. Hereditary spastic paraplegia: Clinico-pathologic features and emerging molecular mechanisms. Acta Neuropathol. 2013, 126, 307–328. [Google Scholar] [CrossRef]
- DeLuca, G.C.; Esiri, M.M.; Ebers, G. The extent of axonal loss in the long tracts in hereditary spastic paraplegia. Neuropathol. Appl. Neurobiol. 2004, 30, 576–584. [Google Scholar] [CrossRef] [PubMed]
- Behan, W.M.; Maia, M. Strumpell’s familial spastic paraplegia: Genetics and neuropathology. J. Neurol. Neurosurg. Psychiatry 1974, 37, 8–20. [Google Scholar] [CrossRef] [PubMed]


| Clinical Information | Patients with pHSP (n = 20) | Controls (n = 17) | p-Value | |
|---|---|---|---|---|
| Age | 52.7 ± 9.7 | 55.0 ± 8.9 | 0.45 | |
| Gender (female) | 60.0% | 64.7% | 0.82 | |
| Disease onset (year) | 32.0 ± 15.2 | |||
| Disease duration (year) | 20.7 ± 12.3 | |||
| Genetic mutation: | SPG4 SPG5 SPG31 unknown | 10 (50%) 2 (10%) 1 (5%) 7 (35%) | ||
| SPRS score | total | 17.7 ± 7.2 | ||
| subitem A | 11.0 ± 4.4 | |||
| subitem B | 3.9 ± 1.8 | |||
| subitem C | 2.8 ± 2.0 |
| Anatomical Region | Patients | Controls | p-Value |
|---|---|---|---|
| corpus callosum | 0.84 ± 0.05 | 0.87 ± 0.05 | 0.048 |
| corpus callosum splenium | 0.86 ± 0.04 | 0.90 ± 0.04 | 0.017 |
| corpus callosum rostrum | 0.81 ± 0.06 | 0.85 ± 0.06 | 0.104 |
| internal capsule | 0.77 ± 0.06 | 0.80 ± 0.06 | 0.048 |
| cerebral crura | 0.80 ± 0.06 | 0.82 ± 0.06 | 0.209 |
| cervical spinal cord | 0.72 ± 0.07 | 0.79 ± 0.07 | 0.003 |
| cervical spinal cord dens | 0.71 ± 0.07 | 0.77 ± 0.09 | 0.045 |
| cervical spinal cord second vertebra (body) | 0.71 ± 0.10 | 0.79 ± 0.08 | 0.022 |
| cervical spinal cord third vertebra (body) | 0.72 ± 0.09 | 0.81 ± 0.08 | 0.003 |
© 2019 by the authors. Licensee MDPI, Basel, Switzerland. This article is an open access article distributed under the terms and conditions of the Creative Commons Attribution (CC BY) license (http://creativecommons.org/licenses/by/4.0/).
Share and Cite
List, J.; Kohl, Z.; Winkler, J.; Marxreiter, F.; Doerfler, A.; Schmidt, M.A. Ascending Axonal Degeneration of the Corticospinal Tract in Pure Hereditary Spastic Paraplegia: A Cross-Sectional DTI Study. Brain Sci. 2019, 9, 268. https://doi.org/10.3390/brainsci9100268
List J, Kohl Z, Winkler J, Marxreiter F, Doerfler A, Schmidt MA. Ascending Axonal Degeneration of the Corticospinal Tract in Pure Hereditary Spastic Paraplegia: A Cross-Sectional DTI Study. Brain Sciences. 2019; 9(10):268. https://doi.org/10.3390/brainsci9100268
Chicago/Turabian StyleList, Julia, Zacharias Kohl, Juergen Winkler, Franz Marxreiter, Arnd Doerfler, and Manuel A. Schmidt. 2019. "Ascending Axonal Degeneration of the Corticospinal Tract in Pure Hereditary Spastic Paraplegia: A Cross-Sectional DTI Study" Brain Sciences 9, no. 10: 268. https://doi.org/10.3390/brainsci9100268