Imaging and Molecular Mechanisms of Alzheimer’s Disease: A Review

 , and
, and
Abstract
:1. Introduction
2. Imaging of Neurodegeneration
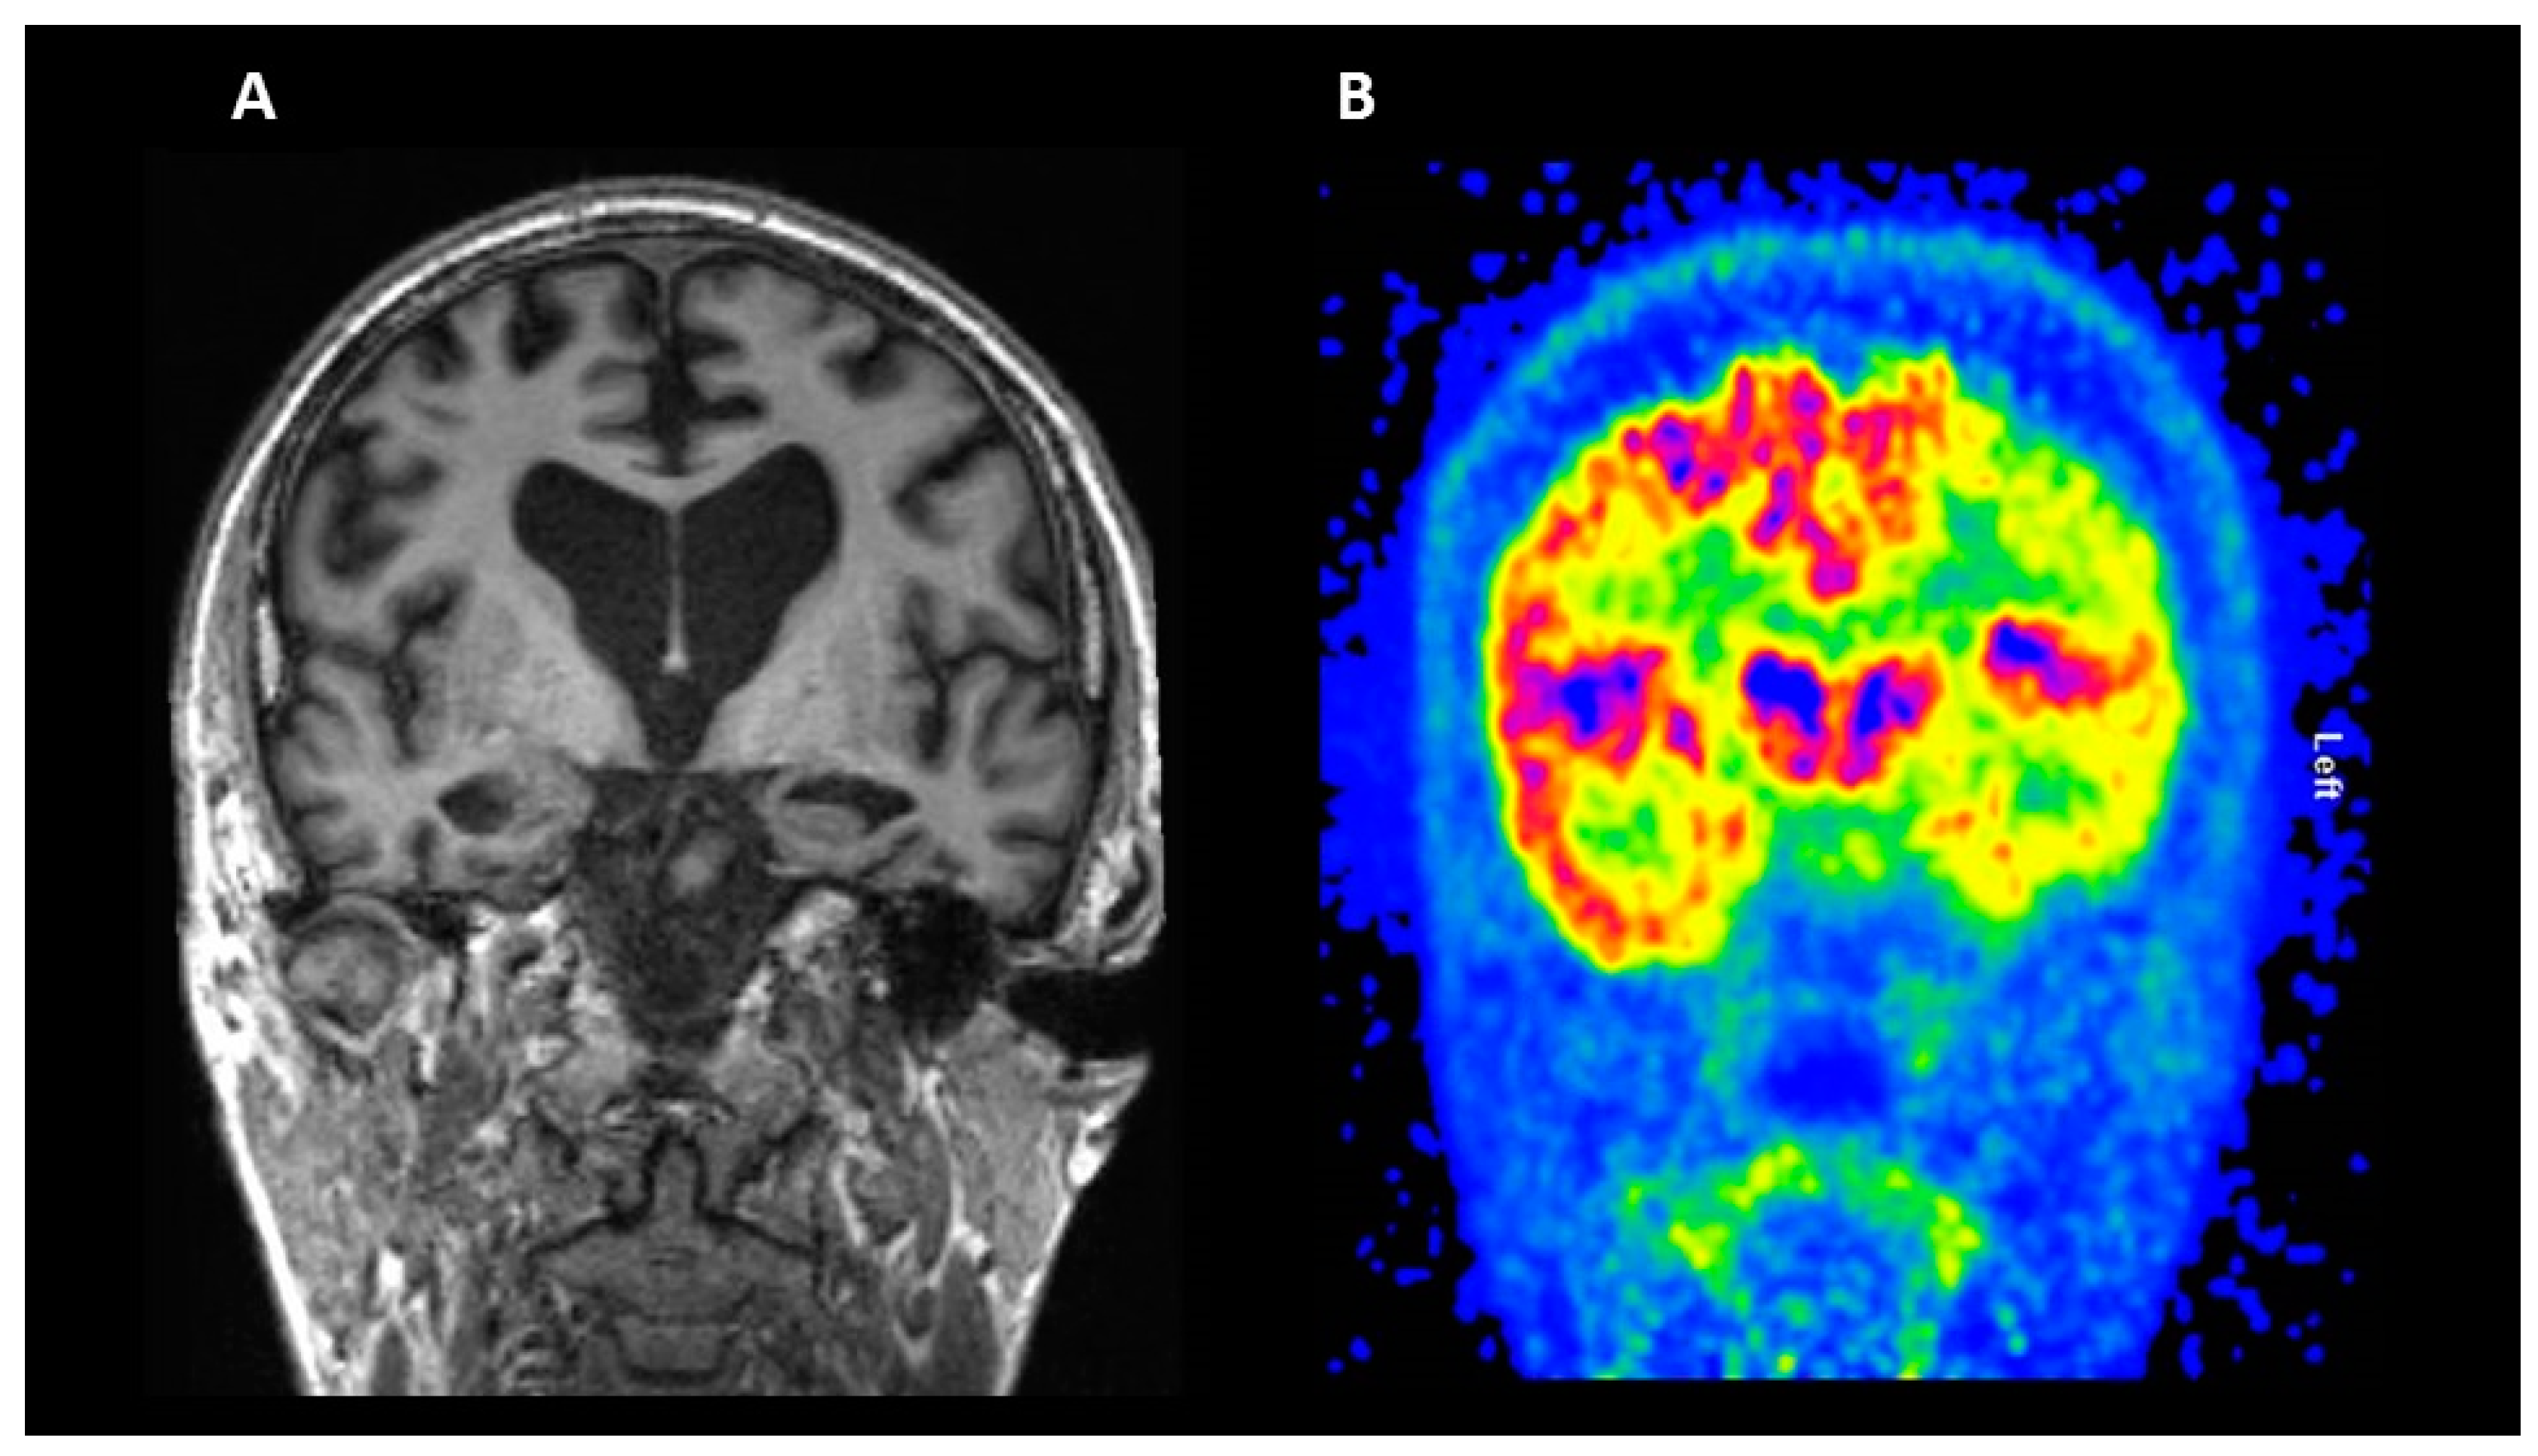
2.1. Structural Magnetic Resonance Imaging (MRI)
2.2. Fluorodeoxyglucose (FDG) PET
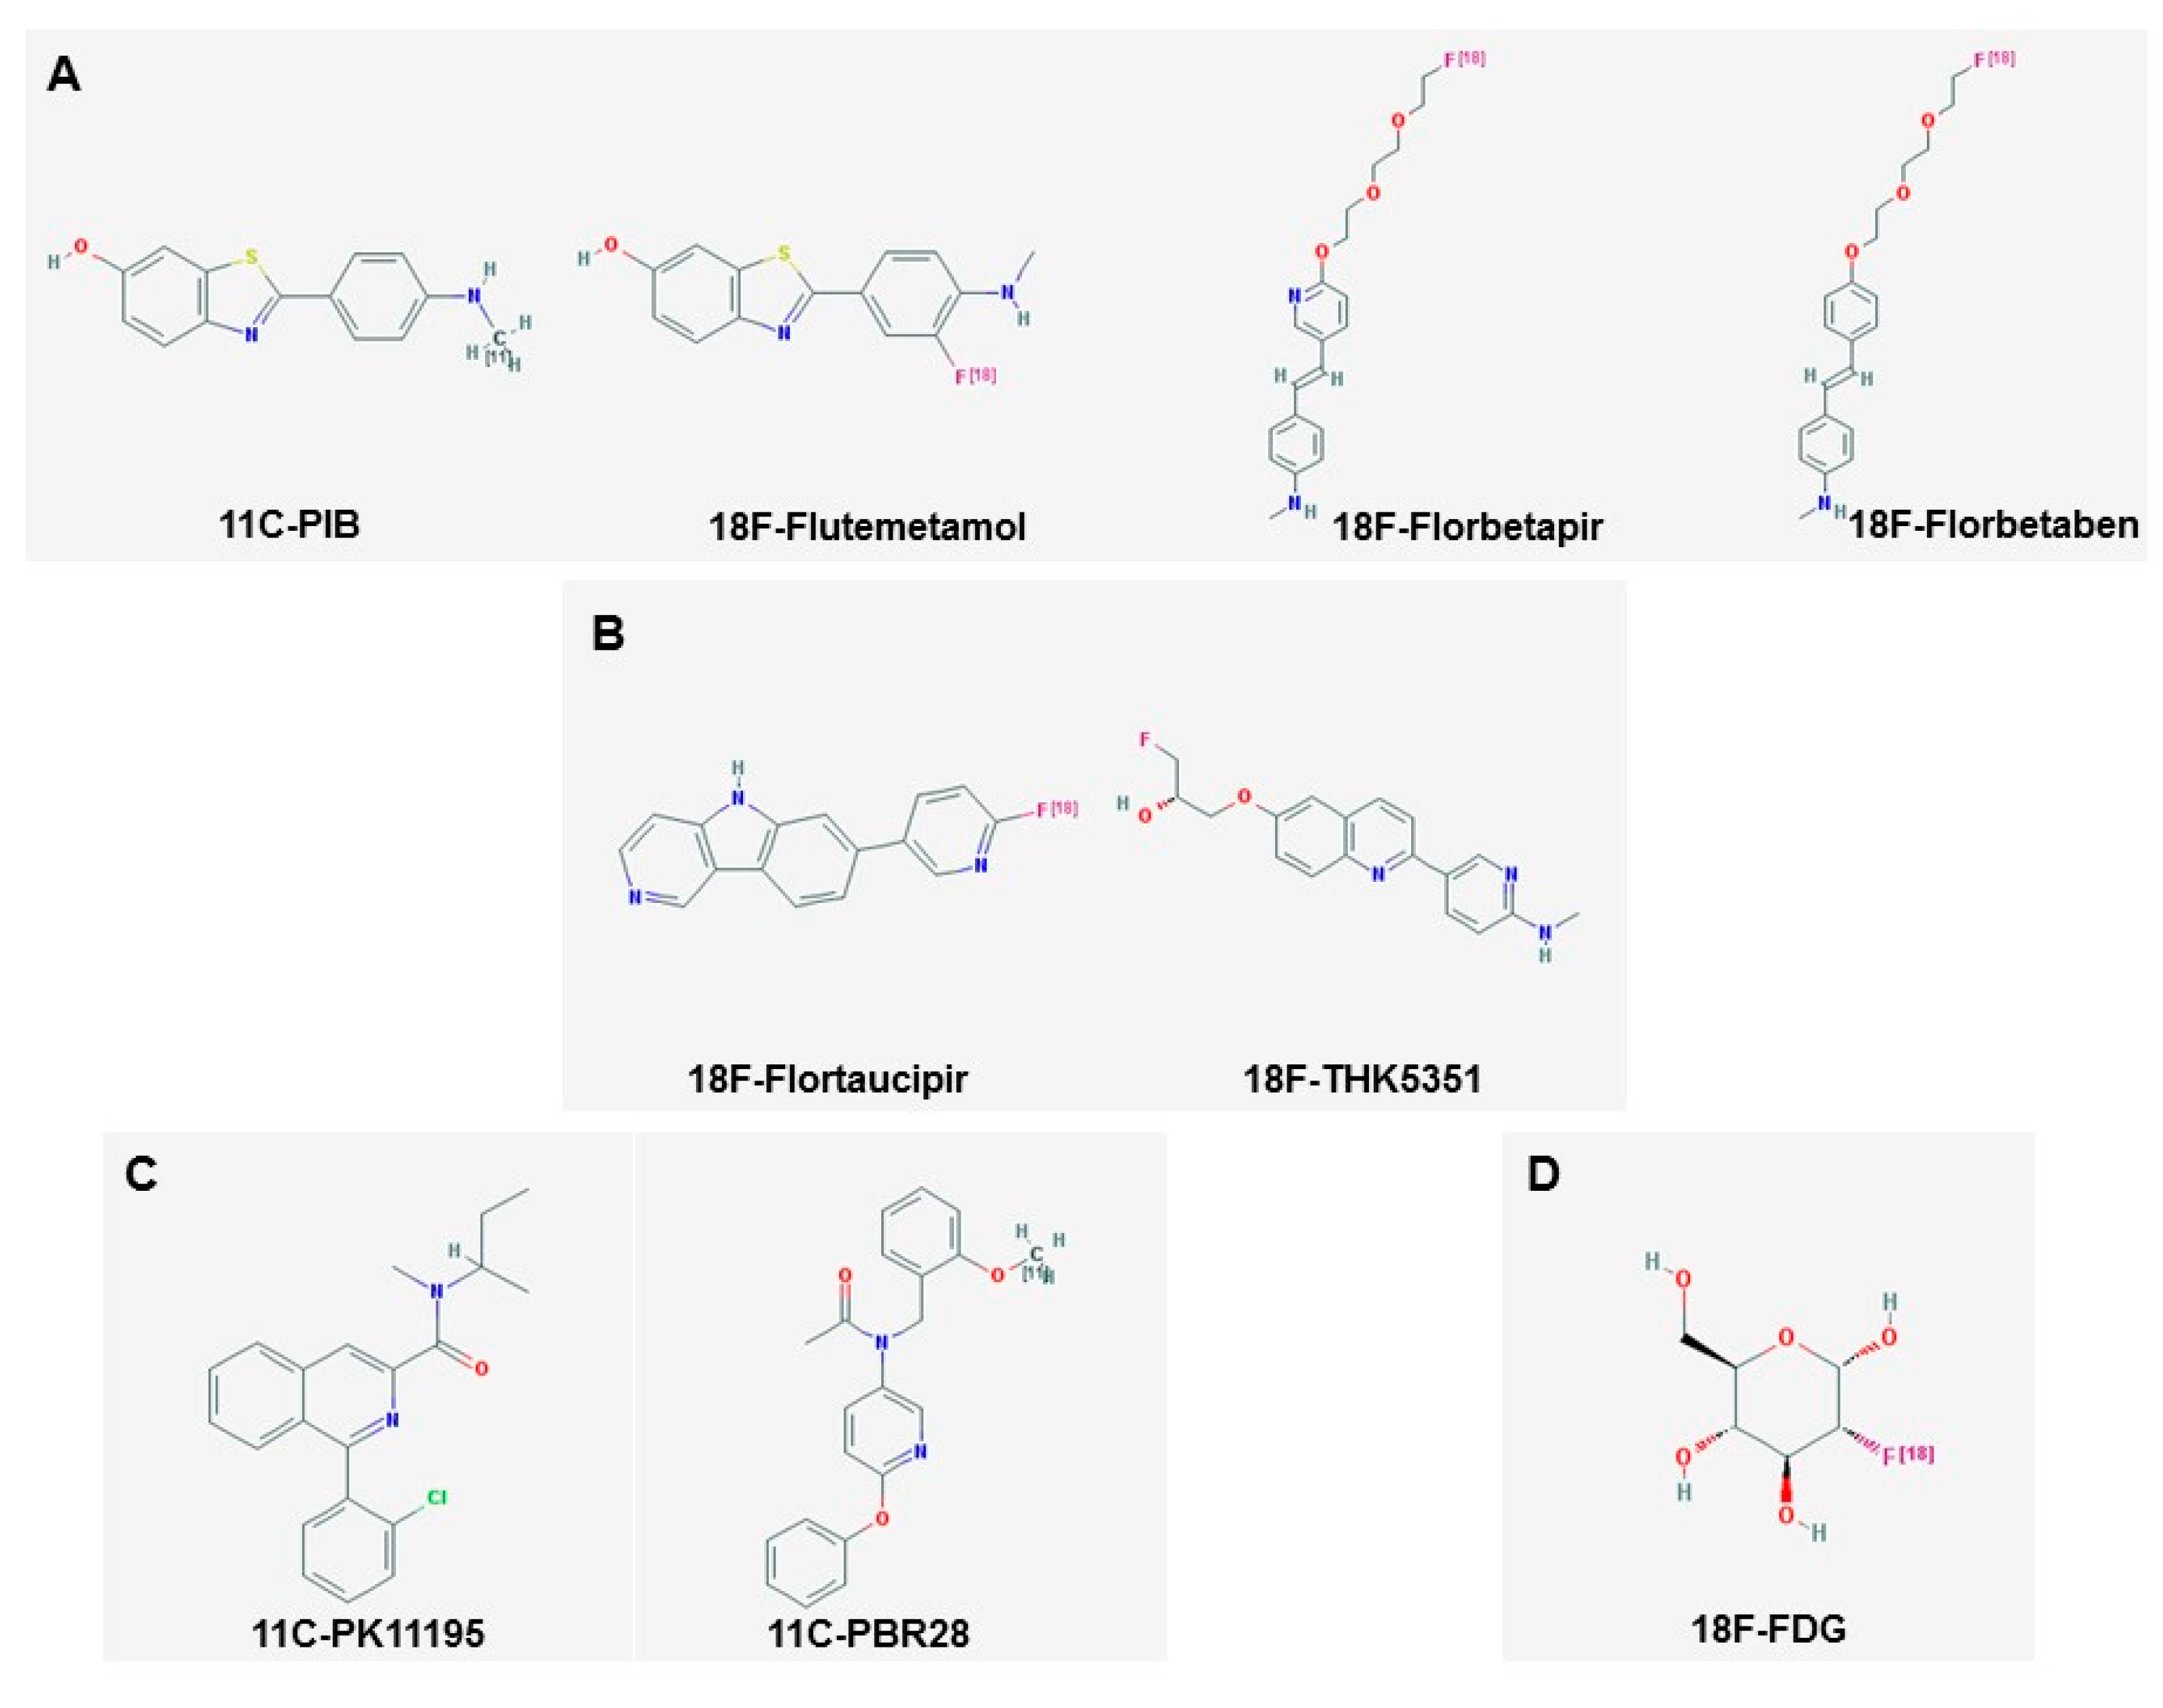
3. Amyloid Imaging
4. Tau Imaging
5. Imaging of Neuroinflammation
5.1. Imaging Microglia
5.2. Imaging Astrocytes
6. Imaging of Blood–Brain Barrier Dysfunction
7. Limitations and Future Perspectives
Funding
Conflicts of Interest
References
- Prince, M.; Wimo, A.; Guerchet, M.; Ali, G.; Wu, Y.; Prina, M. World Alzheimer Report 2015—The Global Impact of Dementia: An Analysis of Prevalence, Incidence, Cost and Trends; Alzheimer’s Disease International (ADI): London, UK, 2015. [Google Scholar]
- Alzheimer’s Association. 2018 Alzheimer’s disease facts and figures. Alzheimer’s Dement. 2018, 14, 367–429. [Google Scholar] [CrossRef]
- Scheltens, P.; Blennow, K.; Breteler, M.M.; de Strooper, B.; Frisoni, G.B.; Salloway, S.; Van der Flier, W.M. Alzheimer’s disease. Lancet 2016, 388, 505–517. [Google Scholar] [CrossRef]
- McKhann, G.M.; Knopman, D.S.; Chertkow, H.; Hyman, B.T.; Jack, C.R., Jr.; Kawas, C.H.; Klunk, W.E.; Koroshetz, W.J.; Manly, J.J.; Mayeux, R.; et al. The diagnosis of dementia due to Alzheimer’s disease: Recommendations from the National Institute on Aging-Alzheimer’s Association workgroups on diagnostic guidelines for Alzheimer’s disease. Alzheimer’s Dement. 2011, 7, 263–269. [Google Scholar] [CrossRef] [PubMed]
- Selkoe, D.J.; Hardy, J. The amyloid hypothesis of Alzheimer’s disease at 25 years. EMBO Mol. Med. 2016, 8, 595–608. [Google Scholar] [CrossRef] [PubMed]
- Small, S.A.; Duff, K. Linking Abeta and tau in late-onset Alzheimer’s disease: A dual pathway hypothesis. Neuron 2008, 60, 534–542. [Google Scholar] [CrossRef] [PubMed]
- Frisoni, G.B.; Boccardi, M.; Barkhof, F.; Blennow, K.; Cappa, S.; Chiotis, K.; Demonet, J.F.; Garibotto, V.; Giannakopoulos, P.; Gietl, A.; et al. Strategic roadmap for an early diagnosis of Alzheimer’s disease based on biomarkers. Lancet Neurol. 2017, 16, 661–676. [Google Scholar] [CrossRef]
- Kollack-Walker, S.; Liu, C.Y.; Fleisher, A.S. The Role of Neuroimaging in the Assessment of the Cognitively Impaired Elderly. Neurol. Clin. 2017, 35, 231–262. [Google Scholar] [CrossRef] [PubMed]
- Frisoni, G.B.; Fox, N.C.; Jack, C.R., Jr.; Scheltens, P.; Thompson, P.M. The clinical use of structural MRI in Alzheimer disease. Nat. Rev. Neurol. 2010, 6, 67–77. [Google Scholar] [CrossRef] [PubMed] [Green Version]
- Whitwell, J.L.; Josephs, K.A.; Murray, M.E.; Kantarci, K.; Przybelski, S.A.; Weigand, S.D.; Vemuri, P.; Senjem, M.L.; Parisi, J.E.; Knopman, D.S.; et al. MRI correlates of neurofibrillary tangle pathology at autopsy: A voxel-based morphometry study. Neurology 2008, 71, 743–749. [Google Scholar] [CrossRef] [PubMed] [Green Version]
- Vemuri, P.; Wiste, H.J.; Weigand, S.D.; Shaw, L.M.; Trojanowski, J.Q.; Weiner, M.W.; Knopman, D.S.; Petersen, R.C.; Jack, C.R., Jr.; Alzheimer’s Disease Neuroimaging Initiative. MRI and CSF biomarkers in normal, MCI, and AD subjects: Predicting future clinical change. Neurology 2009, 73, 294–301. [Google Scholar] [CrossRef] [PubMed] [Green Version]
- Vemuri, P.; Whitwell, J.L.; Kantarci, K.; Josephs, K.A.; Parisi, J.E.; Shiung, M.S.; Knopman, D.S.; Boeve, B.F.; Petersen, R.C.; Dickson, D.W.; et al. Antemortem MRI based STructural Abnormality iNDex (STAND)-scores correlate with postmortem Braak neurofibrillary tangle stage. Neuroimage 2008, 42, 559–567. [Google Scholar] [CrossRef] [PubMed] [Green Version]
- Sluimer, J.D.; van der Flier, W.M.; Karas, G.B.; Fox, N.C.; Scheltens, P.; Barkhof, F.; Vrenken, H. Whole-brain atrophy rate and cognitive decline: Longitudinal MR study of memory clinic patients. Radiology 2008, 248, 590–598. [Google Scholar] [CrossRef] [PubMed]
- Cardenas, V.A.; Chao, L.L.; Studholme, C.; Yaffe, K.; Miller, B.L.; Madison, C.; Buckley, S.T.; Mungas, D.; Schuff, N.; Weiner, M.W. Brain atrophy associated with baseline and longitudinal measures of cognition. Neurobiol. Aging 2011, 32, 572–580. [Google Scholar] [CrossRef] [PubMed] [Green Version]
- Jack, C.R., Jr.; Shiung, M.M.; Gunter, J.L.; O’Brien, P.C.; Weigand, S.D.; Knopman, D.S.; Boeve, B.F.; Ivnik, R.J.; Smith, G.E.; Cha, R.H.; et al. Comparison of different MRI brain atrophy rate measures with clinical disease progression in AD. Neurology 2004, 62, 591–600. [Google Scholar] [CrossRef] [PubMed] [Green Version]
- Hua, X.; Lee, S.; Yanovsky, I.; Leow, A.D.; Chou, Y.Y.; Ho, A.J.; Gutman, B.; Toga, A.W.; Jack, C.R., Jr.; Bernstein, M.A.; et al. Optimizing power to track brain degeneration in Alzheimer’s disease and mild cognitive impairment with tensor-based morphometry: An ADNI study of 515 subjects. Neuroimage 2009, 48, 668–681. [Google Scholar] [CrossRef] [PubMed]
- Jack, C.R., Jr.; Lowe, V.J.; Weigand, S.D.; Wiste, H.J.; Senjem, M.L.; Knopman, D.S.; Shiung, M.M.; Gunter, J.L.; Boeve, B.F.; Kemp, B.J.; et al. Serial PIB and MRI in normal, mild cognitive impairment and Alzheimer’s disease: Implications for sequence of pathological events in Alzheimer’s disease. Brain 2009, 132, 1355–1365. [Google Scholar] [CrossRef] [PubMed]
- Josephs, K.A.; Whitwell, J.L.; Ahmed, Z.; Shiung, M.M.; Weigand, S.D.; Knopman, D.S.; Boeve, B.F.; Parisi, J.E.; Petersen, R.C.; Dickson, D.W.; et al. Beta-amyloid burden is not associated with rates of brain atrophy. Ann. Neurol. 2008, 63, 204–212. [Google Scholar] [CrossRef] [PubMed]
- Engler, H.; Forsberg, A.; Almkvist, O.; Blomquist, G.; Larsson, E.; Savitcheva, I.; Wall, A.; Ringheim, A.; Langstrom, B.; Nordberg, A. Two-year follow-up of amyloid deposition in patients with Alzheimer’s disease. Brain 2006, 129, 2856–2866. [Google Scholar] [CrossRef] [PubMed]
- Giorgio, A.; De Stefano, N. Clinical use of brain volumetry. J. Magn. Reson. Imaging 2013, 37, 1–14. [Google Scholar] [CrossRef] [PubMed]
- Bozzali, M.; Filippi, M.; Magnani, G.; Cercignani, M.; Franceschi, M.; Schiatti, E.; Castiglioni, S.; Mossini, R.; Falautano, M.; Scotti, G.; et al. The contribution of voxel-based morphometry in staging patients with mild cognitive impairment. Neurology 2006, 67, 453–460. [Google Scholar] [CrossRef] [PubMed]
- Dickerson, B.C.; Feczko, E.; Augustinack, J.C.; Pacheco, J.; Morris, J.C.; Fischl, B.; Buckner, R.L. Differential effects of aging and Alzheimer’s disease on medial temporal lobe cortical thickness and surface area. Neurobiol. Aging 2009, 30, 432–440. [Google Scholar] [CrossRef] [PubMed]
- Barnes, J.; Lewis, E.B.; Scahill, R.I.; Bartlett, J.W.; Frost, C.; Schott, J.M.; Rossor, M.N.; Fox, N.C. Automated measurement of hippocampal atrophy using fluid-registered serial MRI in AD and controls. J. Comput. Assist. Tomogr. 2007, 31, 581–587. [Google Scholar] [CrossRef] [PubMed]
- Bishop, C.A.; Jenkinson, M.; Andersson, J.; Declerck, J.; Merhof, D. Novel Fast Marching for Automated Segmentation of the Hippocampus (FMASH): Method and validation on clinical data. Neuroimage 2011, 55, 1009–1019. [Google Scholar] [CrossRef] [PubMed]
- Jack, C.R., Jr.; Barkhof, F.; Bernstein, M.A.; Cantillon, M.; Cole, P.E.; Decarli, C.; Dubois, B.; Duchesne, S.; Fox, N.C.; Frisoni, G.B.; et al. Steps to standardization and validation of hippocampal volumetry as a biomarker in clinical trials and diagnostic criterion for Alzheimer’s disease. Alzheimer’s Dement. 2011, 7, 474–485.e4. [Google Scholar] [CrossRef] [PubMed] [Green Version]
- Jack, C.R., Jr.; Bernstein, M.A.; Borowski, B.J.; Gunter, J.L.; Fox, N.C.; Thompson, P.M.; Schuff, N.; Krueger, G.; Killiany, R.J.; Decarli, C.S.; et al. Update on the magnetic resonance imaging core of the Alzheimer’s disease neuroimaging initiative. Alzheimer’s Dement. 2010, 6, 212–220. [Google Scholar] [CrossRef] [PubMed]
- Kehoe, E.G.; McNulty, J.P.; Mullins, P.G.; Bokde, A.L. Advances in MRI biomarkers for the diagnosis of Alzheimer’s disease. Biomark. Med. 2014, 8, 1151–1169. [Google Scholar] [CrossRef] [PubMed]
- Steen, R.G.; Mull, C.; McClure, R.; Hamer, R.M.; Lieberman, J.A. Brain volume in first-episode schizophrenia: Systematic review and meta-analysis of magnetic resonance imaging studies. Br. J. Psychiatry 2006, 188, 510–518. [Google Scholar] [CrossRef] [PubMed]
- Arnone, D.; McIntosh, A.M.; Ebmeier, K.P.; Munafo, M.R.; Anderson, I.M. Magnetic resonance imaging studies in unipolar depression: Systematic review and meta-regression analyses. Eur. Neuropsychopharmacol. 2012, 22, 1–16. [Google Scholar] [CrossRef] [PubMed]
- Frisoni, G.B.; Jack, C.R. Harmonization of magnetic resonance-based manual hippocampal segmentation: A mandatory step for wide clinical use. Alzheimer’s Dement. 2011, 7, 171–174. [Google Scholar] [CrossRef] [PubMed]
- Calsolaro, V.; Edison, P. Alterations in Glucose Metabolism in Alzheimer’s Disease. Recent Pat. Endocr. Metab. Immune Drug Discov. 2016, 10, 31–39. [Google Scholar] [CrossRef] [PubMed]
- Shah, K.; Desilva, S.; Abbruscato, T. The role of glucose transporters in brain disease: Diabetes and Alzheimer’s Disease. Int. J. Mol. Sci. 2012, 13, 12629–12655. [Google Scholar] [CrossRef] [PubMed]
- Femminella, G.D.; Edison, P. Evaluation of neuroprotective effect of glucagon-like peptide 1 analogs using neuroimaging. Alzheimer’s Dement. 2014, 10, S55–S61. [Google Scholar] [CrossRef] [PubMed]
- Herholz, K. Use of FDG PET as an imaging biomarker in clinical trials of Alzheimer’s disease. Biomark. Med. 2012, 6, 431–439. [Google Scholar] [CrossRef] [PubMed]
- Jack, C.R., Jr.; Knopman, D.S.; Jagust, W.J.; Shaw, L.M.; Aisen, P.S.; Weiner, M.W.; Petersen, R.C.; Trojanowski, J.Q. Hypothetical model of dynamic biomarkers of the Alzheimer’s pathological cascade. Lancet Neurol. 2010, 9, 119–128. [Google Scholar] [CrossRef]
- Chen, Z.C.; Zhong, C.J. Decoding Alzheimer’s disease from perturbed cerebral glucose metabolism: Implications for diagnostic and therapeutic strategies. Prog. Neurobiol. 2013, 108, 21–43. [Google Scholar] [CrossRef] [PubMed]
- Laforce, R., Jr.; Soucy, J.P.; Sellami, L.; Dallaire-Theroux, C.; Brunet, F.; Bergeron, D.; Miller, B.L.; Ossenkoppele, R. Molecular imaging in dementia: Past, present, and future. Alzheimer’s Dement. 2018, 14, 1522–1552. [Google Scholar] [CrossRef] [PubMed]
- Furst, A.J.; Rabinovici, G.D.; Rostomian, A.H.; Steed, T.; Alkalay, A.; Racine, C.; Miller, B.L.; Jagust, W.J. Cognition, glucose metabolism and amyloid burden in Alzheimer’s disease. Neurobiol. Aging 2012, 33, 215–225. [Google Scholar] [CrossRef] [PubMed]
- Edison, P.; Archer, H.A.; Hinz, R.; Hammers, A.; Pavese, N.; Tai, Y.F.; Hotton, G.; Cutler, D.; Fox, N.; Kennedy, A.; et al. Amyloid, hypometabolism, and cognition in Alzheimer disease: An [11C]PIB and [18F]FDG PET study. Neurology 2007, 68, 501–508. [Google Scholar] [CrossRef] [PubMed]
- Langbaum, J.B.S.; Chen, K.; Lee, W.; Reschke, C.; Bandy, D.; Fleisher, A.S.; Alexander, G.E.; Foster, N.L.; Weiner, M.W.; Koeppe, R.A.; et al. Categorical and correlational analyses of baseline fluorodeoxyglucose positron emission tomography images from the Alzheimer’s Disease Neuroimaging Initiative (ADNI). Neuroimage 2009, 45, 1107–1116. [Google Scholar] [CrossRef] [PubMed]
- Ewers, M.; Insel, P.S.; Stern, Y.; Weiner, M.W.; Alzheimer’s Disease Neuroimaging Initiative (ADNI). Cognitive reserve associated with FDG-PET in preclinical Alzheimer disease. Neurology 2013, 80, 1194–1201. [Google Scholar] [CrossRef] [PubMed] [Green Version]
- Jagust, W.; Reed, B.; Mungas, D.; Ellis, W.; DeCarli, C. What does fluorodeoxyglucose PET imaging add to a clinical diagnosis of dementia? Neurology 2007, 69, 871–877. [Google Scholar] [CrossRef] [PubMed]
- Drzezga, A.; Lautenschlager, N.; Siebner, H.; Riemenschneider, M.; Willoch, F.; Minoshima, S.; Schwaiger, M.; Kurz, A. Cerebral metabolic changes accompanying conversion of mild cognitive impairment into Alzheimer’s disease: A PET follow-up study. Eur. J. Nucl. Med. Mol. Imaging 2003, 30, 1104–1113. [Google Scholar] [PubMed]
- Anchisi, D.; Borroni, B.; Franceschi, M.; Kerrouche, N.; Kalbe, E.; Beuthien-Beumann, B.; Cappa, S.; Lenz, O.; Ludecke, S.; Marcone, A.; et al. Heterogeneity of brain glucose metabolism in mild cognitive impairment and clinical progression to Alzheimer disease. Arch. Neurol. 2005, 62, 1728–1733. [Google Scholar] [CrossRef] [PubMed]
- Silverman, D.H.; Small, G.W.; Chang, C.Y.; Lu, C.S.; Kung De Aburto, M.A.; Chen, W.; Czernin, J.; Rapoport, S.I.; Pietrini, P.; Alexander, G.E.; et al. Positron emission tomography in evaluation of dementia: Regional brain metabolism and long-term outcome. JAMA 2001, 286, 2120–2127. [Google Scholar] [CrossRef] [PubMed]
- Smailagic, N.; Vacante, M.; Hyde, C.; Martin, S.; Ukoumunne, O.; Sachpekidis, C. 18F-FDG PET for the early diagnosis of Alzheimer’s disease dementia and other dementias in people with mild cognitive impairment (MCI). Cochrane Database Syst. Rev. 2015, 1, CD010632. [Google Scholar] [CrossRef] [PubMed]
- Pike, K.E.; Savage, G.; Villemagne, V.L.; Ng, S.; Moss, S.A.; Maruff, P.; Mathis, C.A.; Klunk, W.E.; Masters, C.L.; Rowe, C.C. Beta-amyloid imaging and memory in non-demented individuals: Evidence for preclinical Alzheimer’s disease. Brain 2007, 130, 2837–2844. [Google Scholar] [CrossRef] [PubMed]
- Johnson, K.A.; Minoshima, S.; Bohnen, N.I.; Donohoe, K.J.; Foster, N.L.; Herscovitch, P.; Karlawish, J.H.; Rowe, C.C.; Hedrick, S.; Pappas, V.; et al. Update on appropriate use criteria for amyloid PET imaging: Dementia experts, mild cognitive impairment, and education. Amyloid Imaging Task Force of the Alzheimer’s Association and Society for Nuclear Medicine and Molecular Imaging. Alzheimer’s Dement. 2013, 9, e106–e109. [Google Scholar] [CrossRef] [PubMed]
- Villemagne, V.L.; Dore, V.; Burnham, S.C.; Masters, C.L.; Rowe, C.C. Imaging tau and amyloid-beta proteinopathies in Alzheimer disease and other conditions. Nat. Rev. Neurol. 2018, 14, 225–236. [Google Scholar] [CrossRef] [PubMed]
- Johnson, K.A.; Minoshima, S.; Bohnen, N.I.; Donohoe, K.J.; Foster, N.L.; Herscovitch, P.; Karlawish, J.H.; Rowe, C.C.; Carrillo, M.C.; Hartley, D.M.; et al. Appropriate use criteria for amyloid PET: A report of the Amyloid Imaging Task Force, the Society of Nuclear Medicine and Molecular Imaging, and the Alzheimer’s Association. Alzheimer’s Dement. 2013, 9, E1–E16. [Google Scholar] [CrossRef] [PubMed]
- Apostolova, L.G.; Haider, J.M.; Goukasian, N.; Rabinovici, G.D.; Chetelat, G.; Ringman, J.M.; Kremen, S.; Grill, J.D.; Restrepo, L.; Mendez, M.F.; et al. Critical review of the Appropriate Use Criteria for amyloid imaging: Effect on diagnosis and patient care. Alzheimer’s Dement. 2016, 5, 15–22. [Google Scholar] [CrossRef] [PubMed]
- Mathis, C.A.; Bacskai, B.J.; Kajdasz, S.T.; McLellan, M.E.; Frosch, M.P.; Hyman, B.T.; Holt, D.P.; Wang, Y.; Huang, G.F.; Debnath, M.L.; et al. A lipophilic thioflavin-T derivative for positron emission tomography (PET) imaging of amyloid in brain. Bioorg. Med. Chem. Lett. 2002, 12, 295–298. [Google Scholar] [CrossRef]
- Lister-James, J.; Pontecorvo, M.J.; Clark, C.; Joshi, A.D.; Mintun, M.A.; Zhang, W.; Lim, N.; Zhuang, Z.; Golding, G.; Choi, S.R.; et al. Florbetapir f-18: A histopathologically validated Beta-amyloid positron emission tomography imaging agent. Semin. Nucl. Med. 2011, 41, 300–304. [Google Scholar] [CrossRef] [PubMed]
- Sperling, R.A.; Johnson, K.A.; Doraiswamy, P.M.; Reiman, E.M.; Fleisher, A.S.; Sabbagh, M.N.; Sadowsky, C.H.; Carpenter, A.; Davis, M.D.; Lu, M.; et al. Amyloid deposition detected with florbetapir F 18 ((18)F-AV-45) is related to lower episodic memory performance in clinically normal older individuals. Neurobiol. Aging 2013, 34, 822–831. [Google Scholar] [CrossRef] [PubMed]
- Fleisher, A.S.; Chen, K.; Liu, X.; Roontiva, A.; Thiyyagura, P.; Ayutyanont, N.; Joshi, A.D.; Clark, C.M.; Mintun, M.A.; Pontecorvo, M.J.; et al. Using positron emission tomography and florbetapir F18 to image cortical amyloid in patients with mild cognitive impairment or dementia due to Alzheimer disease. Arch. Neurol. 2011, 68, 1404–1411. [Google Scholar] [CrossRef] [PubMed]
- Clark, C.M.; Schneider, J.A.; Bedell, B.J.; Beach, T.G.; Bilker, W.B.; Mintun, M.A.; Pontecorvo, M.J.; Hefti, F.; Carpenter, A.P.; Flitter, M.L.; et al. Use of florbetapir-PET for imaging beta-amyloid pathology. JAMA 2011, 305, 275–283. [Google Scholar] [CrossRef] [PubMed]
- Clark, C.M.; Pontecorvo, M.J.; Beach, T.G.; Bedell, B.J.; Coleman, R.E.; Doraiswamy, P.M.; Fleisher, A.S.; Reiman, E.M.; Sabbagh, M.N.; Sadowsky, C.H.; et al. Cerebral PET with florbetapir compared with neuropathology at autopsy for detection of neuritic amyloid-beta plaques: A prospective cohort study. Lancet Neurol. 2012, 11, 669–678. [Google Scholar] [CrossRef]
- Zhang, W.; Oya, S.; Kung, M.P.; Hou, C.; Maier, D.L.; Kung, H.F. F-18 stilbenes as PET imaging agents for detecting beta-amyloid plaques in the brain. J. Med. Chem. 2005, 48, 5980–5988. [Google Scholar] [CrossRef] [PubMed]
- Rowe, C.C.; Ackerman, U.; Browne, W.; Mulligan, R.; Pike, K.L.; O’Keefe, G.; Tochon-Danguy, H.; Chan, G.; Berlangieri, S.U.; Jones, G.; et al. Imaging of amyloid beta in Alzheimer’s disease with 18F-BAY94-9172, a novel PET tracer: Proof of mechanism. Lancet Neurol. 2008, 7, 129–135. [Google Scholar] [CrossRef]
- Vandenberghe, R.; Van Laere, K.; Ivanoiu, A.; Salmon, E.; Bastin, C.; Triau, E.; Hasselbalch, S.; Law, I.; Andersen, A.; Korner, A.; et al. 18F-flutemetamol amyloid imaging in Alzheimer disease and mild cognitive impairment: A phase 2 trial. Ann. Neurol. 2010, 68, 319–329. [Google Scholar] [CrossRef] [PubMed]
- Nelissen, N.; Van Laere, K.; Thurfjell, L.; Owenius, R.; Vandenbulcke, M.; Koole, M.; Bormans, G.; Brooks, D.J.; Vandenberghe, R. Phase 1 study of the Pittsburgh compound B derivative 18F-flutemetamol in healthy volunteers and patients with probable Alzheimer disease. J. Nucl. Med. 2009, 50, 1251–1259. [Google Scholar] [CrossRef] [PubMed]
- Thurfjell, L.; Lotjonen, J.; Lundqvist, R.; Koikkalainen, J.; Soininen, H.; Waldemar, G.; Brooks, D.J.; Vandenberghe, R. Combination of biomarkers: PET [18F]flutemetamol imaging and structural MRI in dementia and mild cognitive impairment. Neurodegener. Dis. 2012, 10, 246–249. [Google Scholar] [CrossRef] [PubMed]
- Ye, L.; Morgenstern, J.L.; Gee, A.D.; Hong, G.; Brown, J.; Lockhart, A. Delineation of positron emission tomography imaging agent binding sites on beta-amyloid peptide fibrils. J. Biol. Chem. 2005, 280, 23599–23604. [Google Scholar] [CrossRef] [PubMed]
- Cohen, A.D.; Rabinovici, G.D.; Mathis, C.A.; Jagust, W.J.; Klunk, W.E.; Ikonomovic, M.D. Using Pittsburgh Compound B for in vivo PET imaging of fibrillar amyloid-beta. Adv. Pharmacol. 2012, 64, 27–81. [Google Scholar] [PubMed]
- Braak, H.; Braak, E. Frequency of stages of Alzheimer-related lesions in different age categories. Neurobiol. Aging 1997, 18, 351–357. [Google Scholar] [CrossRef]
- Villain, N.; Chetelat, G.; Grassiot, B.; Bourgeat, P.; Jones, G.; Ellis, K.A.; Ames, D.; Martins, R.N.; Eustache, F.; Salvado, O.; et al. Regional dynamics of amyloid-beta deposition in healthy elderly, mild cognitive impairment and Alzheimer’s disease: A voxelwise PiB-PET longitudinal study. Brain 2012, 135, 2126–2139. [Google Scholar] [CrossRef] [PubMed]
- Vlassenko, A.G.; Mintun, M.A.; Xiong, C.; Sheline, Y.I.; Goate, A.M.; Benzinger, T.L.; Morris, J.C. Amyloid-beta plaque growth in cognitively normal adults: Longitudinal [11C]Pittsburgh compound B data. Ann. Neurol. 2011, 70, 857–861. [Google Scholar] [CrossRef] [PubMed]
- Ng, S.Y.; Villemagne, V.L.; Masters, C.L.; Rowe, C.C. Evaluating atypical dementia syndromes using positron emission tomography with carbon 11 labeled Pittsburgh Compound B. Arch. Neurol. 2007, 64, 1140–1144. [Google Scholar] [CrossRef] [PubMed]
- Rabinovici, G.D.; Jagust, W.J.; Furst, A.J.; Ogar, J.M.; Racine, C.A.; Mormino, E.C.; O’Neil, J.P.; Lal, R.A.; Dronkers, N.F.; Miller, B.L.; et al. Abeta amyloid and glucose metabolism in three variants of primary progressive aphasia. Ann. Neurol. 2008, 64, 388–401. [Google Scholar] [CrossRef] [PubMed]
- Drzezga, A.; Grimmer, T.; Henriksen, G.; Stangier, I.; Perneczky, R.; Diehl-Schmid, J.; Mathis, C.A.; Klunk, W.E.; Price, J.; DeKosky, S.; et al. Imaging of amyloid plaques and cerebral glucose metabolism in semantic dementia and Alzheimer’s disease. Neuroimage 2008, 39, 619–633. [Google Scholar] [CrossRef] [PubMed]
- Engler, H.; Santillo, A.F.; Wang, S.X.; Lindau, M.; Savitcheva, I.; Nordberg, A.; Lannfelt, L.; Langstrom, B.; Kilander, L. In vivo amyloid imaging with PET in frontotemporal dementia. Eur. J. Nucl. Med. Mol. Imaging 2008, 35, 100–106. [Google Scholar] [CrossRef] [PubMed]
- Edison, P.; Rowe, C.C.; Rinne, J.O.; Ng, S.; Ahmed, I.; Kemppainen, N.; Villemagne, V.L.; O’Keefe, G.; Nagren, K.; Chaudhury, K.R.; et al. Amyloid load in Parkinson’s disease dementia and Lewy body dementia measured with [11C]PIB positron emission tomography. J. Neurol. Neurosurg. Psychiatry 2008, 79, 1331–1338. [Google Scholar] [CrossRef] [PubMed]
- Kalaitzakis, M.E.; Walls, A.J.; Pearce, R.K.; Gentleman, S.M. Striatal Abeta peptide deposition mirrors dementia and differentiates DLB and PDD from other parkinsonian syndromes. Neurobiol. Dis. 2011, 41, 377–384. [Google Scholar] [CrossRef] [PubMed]
- Delacourte, A.; Sergeant, N.; Wattez, A.; Maurage, C.A.; Lebert, F.; Pasquier, F.; David, J.P. Tau aggregation in the hippocampal formation: An ageing or a pathological process? Exp. Gerontol. 2002, 37, 1291–1296. [Google Scholar] [CrossRef]
- Chiotis, K.; Saint-Aubert, L.; Rodriguez-Vieitez, E.; Leuzy, A.; Almkvist, O.; Savitcheva, I.; Jonasson, M.; Lubberink, M.; Wall, A.; Antoni, G.; et al. Longitudinal changes of tau PET imaging in relation to hypometabolism in prodromal and Alzheimer’s disease dementia. Mol. Psychiatry 2018, 23, 1666–1673. [Google Scholar] [CrossRef] [PubMed]
- Chiotis, K.; Saint-Aubert, L.; Savitcheva, I.; Jelic, V.; Andersen, P.; Jonasson, M.; Eriksson, J.; Lubberink, M.; Almkvist, O.; Wall, A.; et al. Imaging in-vivo tau pathology in Alzheimer’s disease with THK5317 PET in a multimodal paradigm. Eur. J. Nucl. Med. Mol. Imaging 2016, 43, 1686–1699. [Google Scholar] [CrossRef] [PubMed] [Green Version]
- Saint-Aubert, L.; Almkvist, O.; Chiotis, K.; Almeida, R.; Wall, A.; Nordberg, A. Regional tau deposition measured by [18F]THK5317 positron emission tomography is associated to cognition via glucose metabolism in Alzheimer’s disease. Alzheimer’s Res. Ther. 2016, 8, 38. [Google Scholar] [CrossRef] [PubMed]
- Royall, D.R. Location, location, location! Neurobiol. Aging 2007, 28, 1481–1482, discussion 1483. [Google Scholar] [CrossRef] [PubMed] [Green Version]
- Delacourte, A.; David, J.P.; Sergeant, N.; Buee, L.; Wattez, A.; Vermersch, P.; Ghozali, F.; Fallet-Bianco, C.; Pasquier, F.; Lebert, F.; et al. The biochemical pathway of neurofibrillary degeneration in aging and Alzheimer’s disease. Neurology 1999, 52, 1158–1165. [Google Scholar] [CrossRef] [PubMed]
- Scholl, M.; Lockhart, S.N.; Schonhaut, D.R.; O’Neil, J.P.; Janabi, M.; Ossenkoppele, R.; Baker, S.L.; Vogel, J.W.; Faria, J.; Schwimmer, H.D.; et al. PET Imaging of Tau Deposition in the Aging Human Brain. Neuron 2016, 89, 971–982. [Google Scholar] [CrossRef] [PubMed]
- Pontecorvo, M.J.; Devous, M.D., Sr.; Navitsky, M.; Lu, M.; Salloway, S.; Schaerf, F.W.; Jennings, D.; Arora, A.K.; McGeehan, A.; Lim, N.C.; et al. Relationships between flortaucipir PET tau binding and amyloid burden, clinical diagnosis, age and cognition. Brain 2017, 140, 748–763. [Google Scholar] [CrossRef] [PubMed] [Green Version]
- Johnson, K.A.; Schultz, A.; Betensky, R.A.; Becker, J.A.; Sepulcre, J.; Rentz, D.; Mormino, E.; Chhatwal, J.; Amariglio, R.; Papp, K.; et al. Tau positron emission tomographic imaging in aging and early Alzheimer disease. Ann. Neurol. 2016, 79, 110–119. [Google Scholar] [CrossRef] [PubMed]
- Lockhart, S.N.; Baker, S.L.; Okamura, N.; Furukawa, K.; Ishiki, A.; Furumoto, S.; Tashiro, M.; Yanai, K.; Arai, H.; Kudo, Y.; et al. Dynamic PET Measures of Tau Accumulation in Cognitively Normal Older Adults and Alzheimer’s Disease Patients Measured Using [18F] THK-5351. PLoS ONE 2016, 11, e0158460. [Google Scholar] [CrossRef] [PubMed]
- Harada, R.; Okamura, N.; Furumoto, S.; Furukawa, K.; Ishiki, A.; Tomita, N.; Tago, T.; Hiraoka, K.; Watanuki, S.; Shidahara, M.; et al. 18F-THK5351: A Novel PET Radiotracer for Imaging Neurofibrillary Pathology in Alzheimer Disease. J. Nucl. Med. 2016, 57, 208–214. [Google Scholar] [CrossRef] [PubMed]
- Cho, H.; Choi, J.Y.; Hwang, M.S.; Lee, J.H.; Kim, Y.J.; Lee, H.M.; Lyoo, C.H.; Ryu, Y.H.; Lee, M.S. Tau PET in Alzheimer disease and mild cognitive impairment. Neurology 2016, 87, 375–383. [Google Scholar] [CrossRef] [PubMed]
- Ossenkoppele, R.; Cohn-Sheehy, B.I.; La Joie, R.; Vogel, J.W.; Moller, C.; Lehmann, M.; van Berckel, B.N.; Seeley, W.W.; Pijnenburg, Y.A.; Gorno-Tempini, M.L.; et al. Atrophy patterns in early clinical stages across distinct phenotypes of Alzheimer’s disease. Hum. Brain Mapp. 2015, 36, 4421–4437. [Google Scholar] [CrossRef] [PubMed]
- Tomlinson, B.E.; Blessed, G.; Roth, M. Observations on the brains of demented old people. J. Neurol. Sci. 1970, 11, 205–242. [Google Scholar] [CrossRef]
- Jellinger, K.A.; Alafuzoff, I.; Attems, J.; Beach, T.G.; Cairns, N.J.; Crary, J.F.; Dickson, D.W.; Hof, P.R.; Hyman, B.T.; Jack, C.R., Jr.; et al. PART, a distinct tauopathy, different from classical sporadic Alzheimer disease. Acta Neuropathol. 2015, 129, 757–762. [Google Scholar] [CrossRef] [PubMed] [Green Version]
- Wang, L.; Benzinger, T.L.; Su, Y.; Christensen, J.; Friedrichsen, K.; Aldea, P.; McConathy, J.; Cairns, N.J.; Fagan, A.M.; Morris, J.C.; et al. Evaluation of Tau Imaging in Staging Alzheimer Disease and Revealing Interactions Between beta-Amyloid and Tauopathy. JAMA Neurol. 2016, 73, 1070–1077. [Google Scholar] [CrossRef] [PubMed]
- Price, J.L.; Morris, J.C. Tangles and plaques in nondemented aging and “preclinical” Alzheimer’s disease. Ann. Neurol. 1999, 45, 358–368. [Google Scholar] [CrossRef]
- Ishiki, A.; Harada, R.; Okamura, N.; Tomita, N.; Rowe, C.C.; Villemagne, V.L.; Yanai, K.; Kudo, Y.; Arai, H.; Furumoto, S.; et al. Tau imaging with [18F]THK-5351 in progressive supranuclear palsy. Eur. J. Neurol. 2017, 24, 130–136. [Google Scholar] [CrossRef] [PubMed]
- Josephs, K.A.; Holton, J.L.; Rossor, M.N.; Godbolt, A.K.; Ozawa, T.; Strand, K.; Khan, N.; Al-Sarraj, S.; Revesz, T. Frontotemporal lobar degeneration and ubiquitin immunohistochemistry. Neuropathol. Appl. Neurobiol. 2004, 30, 369–373. [Google Scholar] [CrossRef] [PubMed]
- Ikonomovic, M.D.; Abrahamson, E.E.; Price, J.C.; Mathis, C.A.; Klunk, W.E. [F-18]AV-1451 positron emission tomography retention in choroid plexus: More than “off-target” binding. Ann. Neurol. 2016, 80, 307–308. [Google Scholar] [CrossRef] [PubMed] [Green Version]
- Marquie, M.; Normandin, M.D.; Meltzer, A.C.; Siao Tick Chong, M.; Andrea, N.V.; Anton-Fernandez, A.; Klunk, W.E.; Mathis, C.A.; Ikonomovic, M.D.; Debnath, M.; et al. Pathological correlations of [F-18]-AV-1451 imaging in non-alzheimer tauopathies. Ann. Neurol. 2017, 81, 117–128. [Google Scholar] [CrossRef] [PubMed] [Green Version]
- Chen, R.; Chen, C.P.; Preston, J.E. Effects of transthyretin on thyroxine and beta-amyloid removal from cerebrospinal fluid in mice. Clin. Exp. Pharmacol. Physiol. 2016, 43, 844–850. [Google Scholar] [CrossRef] [PubMed]
- Lowe, V.J.; Curran, G.; Fang, P.; Liesinger, A.M.; Josephs, K.A.; Parisi, J.E.; Kantarci, K.; Boeve, B.F.; Pandey, M.K.; Bruinsma, T.; et al. An autoradiographic evaluation of AV-1451 Tau PET in dementia. Acta Neuropathol. Commun. 2016, 4, 58. [Google Scholar] [CrossRef] [PubMed] [Green Version]
- Beach, T.G.; Monsell, S.E.; Phillips, L.E.; Kukull, W. Accuracy of the clinical diagnosis of Alzheimer disease at National Institute on Aging Alzheimer Disease Centers, 2005–2010. J. Neuropathol. Exp. Neurol. 2012, 71, 266–273. [Google Scholar] [CrossRef] [PubMed]
- Marquie, M.; Normandin, M.D.; Vanderburg, C.R.; Costantino, I.M.; Bien, E.A.; Rycyna, L.G.; Klunk, W.E.; Mathis, C.A.; Ikonomovic, M.D.; Debnath, M.L.; et al. Validating novel tau positron emission tomography tracer [F-18]-AV-1451 (T807) on postmortem brain tissue. Ann. Neurol. 2015, 78, 787–800. [Google Scholar] [CrossRef] [PubMed] [Green Version]
- Ng, K.P.; Pascoal, T.A.; Mathotaarachchi, S.; Therriault, J.; Kang, M.S.; Shin, M.; Guiot, M.C.; Guo, Q.; Harada, R.; Comley, R.A.; et al. Monoamine oxidase B inhibitor, selegiline, reduces 18F-THK5351 uptake in the human brain. Alzheimer’s Res. Ther. 2017, 9, 25. [Google Scholar] [CrossRef] [PubMed]
- Gobbi, L.C.; Knust, H.; Korner, M.; Honer, M.; Czech, C.; Belli, S.; Muri, D.; Edelmann, M.R.; Hartung, T.; Erbsmehl, I.; et al. Identification of Three Novel Radiotracers for Imaging Aggregated Tau in Alzheimer’s Disease with Positron Emission Tomography. J. Med. Chem. 2017, 60, 7350–7370. [Google Scholar] [CrossRef] [PubMed]
- Walji, A.M.; Hostetler, E.D.; Selnick, H.; Zeng, Z.; Miller, P.; Bennacef, I.; Salinas, C.; Connolly, B.; Gantert, L.; Holahan, M.; et al. Discovery of 6-(Fluoro-(18)F)-3-(1H-pyrrolo[2,3-c]pyridin-1-yl)isoquinolin-5-amine ([(18)F]-MK-6240): A Positron Emission Tomography (PET) Imaging Agent for Quantification of Neurofibrillary Tangles (NFTs). J. Med. Chem. 2016, 59, 4778–4789. [Google Scholar] [CrossRef] [PubMed]
- Stephens, A.; Kroth, H.; Berndt, M.; Capotosti, F.; Mueller, A. Characterization of novel PET tracers for the assessment of tau pathology in Alzheimer’s disease and other tauopathies. Neurodegener. Dis. 2017, 17. [Google Scholar]
- Calsolaro, V.; Edison, P. Neuroinflammation in Alzheimer’s disease: Current evidence and future directions. Alzheimer’s Dement. 2016, 12, 719–732. [Google Scholar] [CrossRef] [PubMed]
- Cuyvers, E.; Sleegers, K. Genetic variations underlying Alzheimer’s disease: Evidence from genome-wide association studies and beyond. Lancet Neurol. 2016, 15, 857–868. [Google Scholar] [CrossRef]
- Cerami, C.; Iaccarino, L.; Perani, D. Molecular Imaging of Neuroinflammation in Neurodegenerative Dementias: The Role of In Vivo PET Imaging. Int. J. Mol. Sci. 2017, 18, 993. [Google Scholar] [CrossRef] [PubMed]
- Edison, P.; Brooks, D.J. Role of Neuroinflammation in the Trajectory of Alzheimer’s Disease and in vivo Quantification Using PET. J. Alzheimer’s Dis. 2018, 64, S339–S351. [Google Scholar] [CrossRef] [PubMed]
- Heppner, F.L.; Ransohoff, R.M.; Becher, B. Immune attack: The role of inflammation in Alzheimer disease. Nat. Rev. Neurosci. 2015, 16, 358–372. [Google Scholar] [CrossRef] [PubMed]
- Heneka, M.T.; Carson, M.J.; El Khoury, J.; Landreth, G.E.; Brosseron, F.; Feinstein, D.L.; Jacobs, A.H.; Wyss-Coray, T.; Vitorica, J.; Ransohoff, R.M.; et al. Neuroinflammation in Alzheimer’s disease. Lancet Neurol. 2015, 14, 388–405. [Google Scholar] [CrossRef]
- Knezevic, D.; Mizrahi, R. Molecular imaging of neuroinflammation in Alzheimer’s disease and mild cognitive impairment. Prog. Neuropsychopharmacol. Biol. Psychiatry 2018, 80, 123–131. [Google Scholar] [CrossRef] [PubMed]
- Schwab, C.; McGeer, P.L. Inflammatory aspects of Alzheimer disease and other neurodegenerative disorders. J. Alzheimer’s Dis. 2008, 13, 359–369. [Google Scholar] [CrossRef]
- Rogers, J.; Luber-Narod, J.; Styren, S.D.; Civin, W.H. Expression of immune system-associated antigens by cells of the human central nervous system: Relationship to the pathology of Alzheimer’s disease. Neurobiol. Aging 1988, 9, 339–349. [Google Scholar] [CrossRef]
- Heneka, M.T.; Kummer, M.P.; Latz, E. Innate immune activation in neurodegenerative disease. Nat. Rev. Immunol. 2014, 14, 463–477. [Google Scholar] [CrossRef] [PubMed]
- Ransohoff, R.M. A polarizing question: Do M1 and M2 microglia exist? Nat. Neurosci. 2016, 19, 987–991. [Google Scholar] [CrossRef] [PubMed]
- Lagarde, J.; Sarazin, M.; Bottlaender, M. In vivo PET imaging of neuroinflammation in Alzheimer’s disease. J. Neural Transm. 2018, 125, 847–867. [Google Scholar] [CrossRef] [PubMed]
- Vivash, L.; O’Brien, T.J. Imaging Microglial Activation with TSPO PET: Lighting Up Neurologic Diseases? J. Nucl. Med. 2016, 57, 165–168. [Google Scholar] [CrossRef] [PubMed]
- Politis, M.; Giannetti, P.; Su, P.; Turkheimer, F.; Keihaninejad, S.; Wu, K.; Waldman, A.; Malik, O.; Matthews, P.M.; Reynolds, R.; et al. Increased PK11195 PET binding in the cortex of patients with MS correlates with disability. Neurology 2012, 79, 523–530. [Google Scholar] [CrossRef] [PubMed] [Green Version]
- Gerhard, A.; Pavese, N.; Hotton, G.; Turkheimer, F.; Es, M.; Hammers, A.; Eggert, K.; Oertel, W.; Banati, R.B.; Brooks, D.J. In vivo imaging of microglial activation with [11C](R)-PK11195 PET in idiopathic Parkinson’s disease. Neurobiol. Dis. 2006, 21, 404–412. [Google Scholar] [CrossRef] [PubMed]
- Owen, D.R.; Yeo, A.J.; Gunn, R.N.; Song, K.; Wadsworth, G.; Lewis, A.; Rhodes, C.; Pulford, D.J.; Bennacef, I.; Parker, C.A.; et al. An 18-kDa translocator protein (TSPO) polymorphism explains differences in binding affinity of the PET radioligand PBR28. J. Cereb. Blood Flow Metab. 2012, 32, 1–5. [Google Scholar] [CrossRef] [PubMed]
- Cagnin, A.; Brooks, D.J.; Kennedy, A.M.; Gunn, R.N.; Myers, R.; Turkheimer, F.E.; Jones, T.; Banati, R.B. In-vivo measurement of activated microglia in dementia. Lancet 2001, 358, 461–467. [Google Scholar] [CrossRef]
- Wiley, C.A.; Lopresti, B.J.; Venneti, S.; Price, J.; Klunk, W.E.; DeKosky, S.T.; Mathis, C.A. Carbon 11-labeled Pittsburgh Compound B and carbon 11-labeled (R)-PK11195 positron emission tomographic imaging in Alzheimer disease. Arch. Neurol. 2009, 66, 60–67. [Google Scholar] [CrossRef] [PubMed]
- Yasuno, F.; Ota, M.; Kosaka, J.; Ito, H.; Higuchi, M.; Doronbekov, T.K.; Nozaki, S.; Fujimura, Y.; Koeda, M.; Asada, T.; et al. Increased binding of peripheral benzodiazepine receptor in Alzheimer’s disease measured by positron emission tomography with [11C]DAA1106. Biol. Psychiatry 2008, 64, 835–841. [Google Scholar] [CrossRef] [PubMed]
- Kreisl, W.C.; Lyoo, C.H.; McGwier, M.; Snow, J.; Jenko, K.J.; Kimura, N.; Corona, W.; Morse, C.L.; Zoghbi, S.S.; Pike, V.W.; et al. In vivo radioligand binding to translocator protein correlates with severity of Alzheimer’s disease. Brain 2013, 136, 2228–2238. [Google Scholar] [CrossRef] [PubMed] [Green Version]
- Suridjan, I.; Pollock, B.G.; Verhoeff, N.P.; Voineskos, A.N.; Chow, T.; Rusjan, P.M.; Lobaugh, N.J.; Houle, S.; Mulsant, B.H.; Mizrahi, R. In-vivo imaging of grey and white matter neuroinflammation in Alzheimer’s disease: A positron emission tomography study with a novel radioligand, [18F]-FEPPA. Mol. Psychiatry 2015, 20, 1579–1587. [Google Scholar] [CrossRef] [PubMed]
- Edison, P.; Archer, H.A.; Gerhard, A.; Hinz, R.; Pavese, N.; Turkheimer, F.E.; Hammers, A.; Tai, Y.F.; Fox, N.; Kennedy, A.; et al. Microglia, amyloid, and cognition in Alzheimer’s disease: An [11C](R)PK11195-PET and [11C]PIB-PET study. Neurobiol. Dis. 2008, 32, 412–419. [Google Scholar] [CrossRef] [PubMed]
- Hamelin, L.; Lagarde, J.; Dorothee, G.; Leroy, C.; Labit, M.; Comley, R.A.; de Souza, L.C.; Corne, H.; Dauphinot, L.; Bertoux, M.; et al. Early and protective microglial activation in Alzheimer’s disease: A prospective study using 18F-DPA-714 PET imaging. Brain 2016, 139, 1252–1264. [Google Scholar] [CrossRef] [PubMed]
- Fan, Z.; Aman, Y.; Ahmed, I.; Chetelat, G.; Landeau, B.; Ray Chaudhuri, K.; Brooks, D.J.; Edison, P. Influence of microglial activation on neuronal function in Alzheimer’s and Parkinson’s disease dementia. Alzheimer’s Dement. 2015, 11, 608–621.e7. [Google Scholar] [CrossRef] [PubMed]
- Femminella, G.D.; Ninan, S.; Atkinson, R.; Fan, Z.; Brooks, D.J.; Edison, P. Does Microglial Activation Influence Hippocampal Volume and Neuronal Function in Alzheimer’s Disease and Parkinson’s Disease Dementia? J. Alzheimer’s Dis. 2016, 51, 1275–1289. [Google Scholar] [CrossRef] [PubMed]
- Yokokura, M.; Mori, N.; Yagi, S.; Yoshikawa, E.; Kikuchi, M.; Yoshihara, Y.; Wakuda, T.; Sugihara, G.; Takebayashi, K.; Suda, S.; et al. In vivo changes in microglial activation and amyloid deposits in brain regions with hypometabolism in Alzheimer’s disease. Eur. J. Nucl. Med. Mol. Imaging 2011, 38, 343–351. [Google Scholar] [CrossRef] [PubMed]
- Yasuno, F.; Kosaka, J.; Ota, M.; Higuchi, M.; Ito, H.; Fujimura, Y.; Nozaki, S.; Takahashi, S.; Mizukami, K.; Asada, T.; et al. Increased binding of peripheral benzodiazepine receptor in mild cognitive impairment-dementia converters measured by positron emission tomography with [11C]DAA1106. Psychiatry Res. 2012, 203, 67–74. [Google Scholar] [CrossRef] [PubMed]
- Dani, M.; Wood, M.; Mizoguchi, R.; Fan, Z.; Walker, Z.; Morgan, R.; Hinz, R.; Biju, M.; Kuruvilla, T.; Brooks, D.J.; et al. Microglial activation correlates in vivo with both tau and amyloid in Alzheimer’s disease. Brain 2018, 141, 2740–2754. [Google Scholar] [CrossRef] [PubMed]
- Fan, Z.; Brooks, D.J.; Okello, A.; Edison, P. An early and late peak in microglial activation in Alzheimer’s disease trajectory. Brain 2017, 140, 792–803. [Google Scholar] [CrossRef] [PubMed]
- Kreisl, W.C.; Lyoo, C.H.; Liow, J.S.; Wei, M.; Snow, J.; Page, E.; Jenko, K.J.; Morse, C.L.; Zoghbi, S.S.; Pike, V.W.; et al. 11C-PBR28 binding to translocator protein increases with progression of Alzheimer’s disease. Neurobiol. Aging 2016, 44, 53–61. [Google Scholar] [CrossRef] [PubMed]
- Santillo, A.F.; Gambini, J.P.; Lannfelt, L.; Langstrom, B.; Ulla-Marja, L.; Kilander, L.; Engler, H. In vivo imaging of astrocytosis in Alzheimer’s disease: An 11C-l-deuteriodeprenyl and PIB PET study. Eur. J. Nucl. Med. Mol. Imaging 2011, 38, 2202–2208. [Google Scholar] [CrossRef] [PubMed]
- Rodriguez-Vieitez, E.; Saint-Aubert, L.; Carter, S.F.; Almkvist, O.; Farid, K.; Scholl, M.; Chiotis, K.; Thordardottir, S.; Graff, C.; Wall, A.; et al. Diverging longitudinal changes in astrocytosis and amyloid PET in autosomal dominant Alzheimer’s disease. Brain 2016, 139, 922–936. [Google Scholar] [CrossRef] [PubMed] [Green Version]
- Kim, S.; Thiessen, P.A.; Bolton, E.E.; Chen, J.; Fu, G.; Gindulyte, A.; Han, L.; He, J.; He, S.; Shoemaker, B.A.; et al. PubChem Substance and Compound databases. Nucleic Acids Res. 2016, 44, D1202–D1213. [Google Scholar] [CrossRef] [PubMed]
- Raja, R.; Rosenberg, G.A.; Caprihan, A. MRI measurements of Blood-Brain Barrier function in dementia: A review of recent studies. Neuropharmacology 2018, 134, 259–271. [Google Scholar] [CrossRef] [PubMed]
- Zenaro, E.; Piacentino, G.; Constantin, G. The blood-brain barrier in Alzheimer’s disease. Neurobiol. Dis. 2017, 107, 41–56. [Google Scholar] [CrossRef] [PubMed]
- Bowman, G.L.; Kaye, J.A.; Quinn, J.F. Dyslipidemia and blood-brain barrier integrity in Alzheimer’s disease. Curr. Gerontol. Geriatr. Res. 2012, 2012, 184042. [Google Scholar] [CrossRef] [PubMed]
- Montagne, A.; Barnes, S.R.; Sweeney, M.D.; Halliday, M.R.; Sagare, A.P.; Zhao, Z.; Toga, A.W.; Jacobs, R.E.; Liu, C.Y.; Amezcua, L.; et al. Blood-brain barrier breakdown in the aging human hippocampus. Neuron 2015, 85, 296–302. [Google Scholar] [CrossRef] [PubMed]
- Wang, H.; Golob, E.J.; Su, M.Y. Vascular volume and blood-brain barrier permeability measured by dynamic contrast enhanced MRI in hippocampus and cerebellum of patients with MCI and normal controls. J. Magn. Reson. Imaging 2006, 24, 695–700. [Google Scholar] [CrossRef] [PubMed] [Green Version]
- Caserta, M.T.; Caccioppo, D.; Lapin, G.D.; Ragin, A.; Groothuis, D.R. Blood-brain barrier integrity in Alzheimer’s disease patients and elderly control subjects. J. Neuropsychiatry Clin. Neurosci. 1998, 10, 78–84. [Google Scholar] [CrossRef] [PubMed]
- Schlageter, N.L.; Carson, R.E.; Rapoport, S.I. Examination of blood-brain barrier permeability in dementia of the Alzheimer type with [68Ga]EDTA and positron emission tomography. J. Cereb. Blood Flow Metab. 1987, 7, 1–8. [Google Scholar] [CrossRef] [PubMed]
- Van de Haar, H.J.; Burgmans, S.; Jansen, J.F.; van Osch, M.J.; van Buchem, M.A.; Muller, M.; Hofman, P.A.; Verhey, F.R.; Backes, W.H. Blood-Brain Barrier Leakage in Patients with Early Alzheimer Disease. Radiology 2016, 281, 527–535. [Google Scholar] [CrossRef] [PubMed]
- Starr, J.M.; Farrall, A.J.; Armitage, P.; McGurn, B.; Wardlaw, J. Blood-brain barrier permeability in Alzheimer’s disease: A case-control MRI study. Psychiatry Res. 2009, 171, 232–241. [Google Scholar] [CrossRef] [PubMed]
- Janelidze, S.; Hertze, J.; Nagga, K.; Nilsson, K.; Nilsson, C.; Swedish Bio, F.S.G.; Wennstrom, M.; van Westen, D.; Blennow, K.; Zetterberg, H.; et al. Increased blood-brain barrier permeability is associated with dementia and diabetes but not amyloid pathology or APOE genotype. Neurobiol. Aging 2017, 51, 104–112. [Google Scholar] [CrossRef] [PubMed]
- Jack, C.R., Jr.; Bennett, D.A.; Blennow, K.; Carrillo, M.C.; Dunn, B.; Haeberlein, S.B.; Holtzman, D.M.; Jagust, W.; Jessen, F.; Karlawish, J.; et al. NIA-AA Research Framework: Toward a biological definition of Alzheimer’s disease. Alzheimer’s Dement. 2018, 14, 535–562. [Google Scholar] [CrossRef] [PubMed]
- Habib, M.; Mak, E.; Gabel, S.; Su, L.; Williams, G.; Waldman, A.; Wells, K.; Ritchie, K.; Ritchie, C.; O’Brien, J.T. Functional neuroimaging findings in healthy middle-aged adults at risk of Alzheimer’s disease. Ageing Res. Rev. 2017, 36, 88–104. [Google Scholar] [CrossRef] [PubMed]
- Baker, S.L.; Maass, A.; Jagust, W.J. Considerations and code for partial volume correcting [18F]-AV-1451 tau PET data. Data Brief 2017, 15, 648–657. [Google Scholar] [CrossRef] [PubMed]
- Gonzalez-Escamilla, G.; Lange, C.; Teipel, S.; Buchert, R.; Grothe, M.J.; Alzheimer’s Disease Neuroimaging Initiative. PETPVE12: An SPM toolbox for Partial Volume Effects correction in brain PET—Application to amyloid imaging with AV45-PET. Neuroimage 2017, 147, 669–677. [Google Scholar] [CrossRef] [PubMed]
- Minhas, D.S.; Price, J.C.; Laymon, C.M.; Becker, C.R.; Klunk, W.E.; Tudorascu, D.L.; Abrahamson, E.E.; Hamilton, R.L.; Kofler, J.K.; Mathis, C.A.; et al. Impact of partial volume correction on the regional correspondence between in vivo [C-11]PiB PET and postmortem measures of A beta load. Neuroimage-Clin. 2018, 19, 182–189. [Google Scholar] [CrossRef] [PubMed]
- Rullmann, M.; Dukart, J.; Hoffmann, K.T.; Luthardt, J.; Tiepolt, S.; Patt, M.; Gertz, H.J.; Schroeter, M.L.; Seiby, J.; Schulz-Schaeffer, W.J.; et al. Partial-Volume Effect Correction Improves Quantitative Analysis of F-18-Florbetaben beta-Amyloid PET Scans. J. Nucl. Med. 2016, 57, 198–203. [Google Scholar] [CrossRef] [PubMed]
- Shidahara, M.; Thomas, B.A.; Okamura, N.; Ibaraki, M.; Matsubara, K.; Oyama, S.; Ishikawa, Y.; Watanuki, S.; Iwata, R.; Furumoto, S.; et al. A comparison of five partial volume correction methods for Tau and Amyloid PET imaging with [F-18]THK5351 and [C-11]PIB. Ann. Nucl. Med. 2017, 31, 563–569. [Google Scholar] [CrossRef] [PubMed]
- Jena, A.; Renjen, P.N.; Taneja, S.; Gambhir, A.; Negi, P. Integrated (18)F-fluorodeoxyglucose positron emission tomography magnetic resonance imaging ((18)F-FDG PET/MRI), a multimodality approach for comprehensive evaluation of dementia patients: A pictorial essay. Indian J. Radiol. Imaging 2015, 25, 342–352. [Google Scholar] [PubMed]
- Wangerin, K.A.; Muzi, M.; Peterson, L.M.; Linden, H.M.; Novakova, A.; Mankoff, D.A.; Kinahan, P.E. A virtual clinical trial comparing static versus dynamic PET imaging in measuring response to breast cancer therapy. Phys. Med. Biol. 2017, 62, 3639–3655. [Google Scholar] [CrossRef] [PubMed] [Green Version]
- Shaw, L.M.; Korecka, M.; Clark, C.M.; Lee, V.M.; Trojanowski, J.Q. Biomarkers of neurodegeneration for diagnosis and monitoring therapeutics. Nat. Rev. Drug Discov. 2007, 6, 295–303. [Google Scholar] [CrossRef] [PubMed]
- Dubois, B.; Hampel, H.; Feldman, H.H.; Scheltens, P.; Aisen, P.; Andrieu, S.; Bakardjian, H.; Benali, H.; Bertram, L.; Blennow, K.; et al. Preclinical Alzheimer’s disease: Definition, natural history, and diagnostic criteria. Alzheimer’s Dement. 2016, 12, 292–323. [Google Scholar] [CrossRef] [PubMed]
- Jack, C.R., Jr.; Bennett, D.A.; Blennow, K.; Carrillo, M.C.; Feldman, H.H.; Frisoni, G.B.; Hampel, H.; Jagust, W.J.; Johnson, K.A.; Knopman, D.S.; et al. A/T/N: An unbiased descriptive classification scheme for Alzheimer disease biomarkers. Neurology 2016, 87, 539–547. [Google Scholar] [CrossRef] [PubMed] [Green Version]
- Ostrowitzki, S.; Deptula, D.; Thurfjell, L.; Barkhof, F.; Bohrmann, B.; Brooks, D.J.; Klunk, W.E.; Ashford, E.; Yoo, K.; Xu, Z.X.; et al. Mechanism of amyloid removal in patients with Alzheimer disease treated with gantenerumab. Arch. Neurol. 2012, 69, 198–207. [Google Scholar] [CrossRef] [PubMed]
- Altman, D.G.; Lausen, B.; Sauerbrei, W.; Schumacher, M. Dangers of using “optimal” cutpoints in the evaluation of prognostic factors. J. Natl. Cancer Inst. 1994, 86, 829–835. [Google Scholar] [CrossRef] [PubMed]
- Johnson, K.A.; Fox, N.C.; Sperling, R.A.; Klunk, W.E. Brain Imaging in Alzheimer Disease. CSH Perspect. Med. 2012, 2, a006213. [Google Scholar] [CrossRef] [PubMed]
- Scheltens, P. Imaging in Alzheimer’s disease. Dialogues Clin. Neurosci. 2009, 11, 191–199. [Google Scholar] [PubMed]
- Wolk, D.A.; Price, J.C.; Saxton, J.A.; Snitz, B.E.; James, J.A.; Lopez, O.L.; Aizenstein, H.J.; Cohen, A.D.; Weissfeld, L.A.; Mathis, C.A.; et al. Amyloid imaging in mild cognitive impairment subtypes. Ann. Neurol. 2009, 65, 557–568. [Google Scholar] [CrossRef] [PubMed] [Green Version]
- Bourgeat, P.; Chetelat, G.; Villemagne, V.L.; Fripp, J.; Raniga, P.; Pike, K.; Acosta, O.; Szoeke, C.; Ourselin, S.; Ames, D.; et al. Beta-amyloid burden in the temporal neocortex is related to hippocampal atrophy in elderly subjects without dementia. Neurology 2010, 74, 121–127. [Google Scholar] [CrossRef] [PubMed]
- Martins, I.J. The future of biomarkers tests and genomic medicine in global organ disease. Int. J. Microbiol. Infect. Dis. 2017, 1, 1–6. [Google Scholar]
- Martins, I.J. The Role of Clinical Proteomics, Lipidomics, and Genomics in the Diagnosis of Alzheimer’s Disease. Proteomes 2016, 4, 14. [Google Scholar] [CrossRef] [PubMed]
- Hanon, O.; Vidal, J.S.; Lehmann, S.; Bombois, S.; Allinquant, B.; Treluyer, J.M.; Gele, P.; Delmaire, C.; Blanc, F.; Mangin, J.F.; et al. Plasma amyloid levels within the Alzheimer’s process and correlations with central biomarkers. Alzheimer’s Dement. 2018, 14, 858–868. [Google Scholar] [CrossRef] [PubMed]
- Korolev, I.O.; Symonds, L.L.; Bozoki, A.C.; Alzheimer’s Disease Neuroimaging Initiative. Predicting Progression from Mild Cognitive Impairment to Alzheimer’s Dementia Using Clinical, MRI, and Plasma Biomarkers via Probabilistic Pattern Classification. PLoS ONE 2016, 11, e0138866. [Google Scholar] [CrossRef] [PubMed]


| Target | Tracer | Clinical Correlates in AD | Ref. |
|---|---|---|---|
| Amyloid-β | 18F-Florebetapir | Has demonstrated high sensitivity and specificity (92% and 100%, respectively) in detecting Aβ pathology | [13,14] |
| 18F-Florbetaben | High affinity for fibrillary Aβ, selectively labelled Aβ plaques, and cerebral amyloid angiopathy in tissue sections from patients with AD | [15] | |
| 18F-Flutemetamol | In phase I and II studies, was able to differentiate between patients with AD and healthy controls | [17,18] | |
| Tau protein | 18F-flortaucipir, 18F-THK5351, 18F-THK5317, 11C-PBB3 | Bind to neurofibrillary tangles with high selectivity and high signal-to-background ratio. Used for early detection of nerve fiber lesions in patients with AD | [39] |
| Microglial activation | 11C-PK11195 | Used to investigate neuroinflammation in vivo. There is an increase of binding in the temporal lobe of AD patients. | [73,74] |
| 11C-DAA1106, 11C-PBR28, 18F-FEPPA | Inverse correlation between microglia activation and glucose metabolism in AD patients as well as with hippocampal volume | [80,81] | |
| 18F-DPA-714 | Showed significantly higher global cortical binding in slower AD decliners compared to fast decliners | [79] | |
| Astrocytes | [11C]-deuterium-l-deprenyl-[11C]-DED, [11C]-deprenyl-D2 | In AD and amyloid-positive MCI, increased binding was observed in the frontal, parietal, and temporal cortices and regional correlation between 11C-DED uptake and amyloid burden | [59,86] |
| Glucose Metabolism | 18F-FDG | Reduced uptake in posterior cingulate, hippocampi, and medial temporal structures is typical in AD and MCI, with a subsequent spreading to the whole cortex as the disease progresses. The reduction in glucose metabolism in regions like precuneus and posterior cingulate has been demonstrated to be associated with the severity of the cognitive impairment | [121,126] |
| Target | Sequences | Clinical Correlates in AD | Ref. |
|---|---|---|---|
| Blood–brain barrier (BBB) | Dynamic susceptibility contrast-enhanced MRI (DSC-MRI) | Degeneration of the BBB has been demonstrated in the hippocampus with the ageing process; however, that has been seen to appear earlier in subjects with MCI when compared with cognitively intact subjects | [91] |
| Dynamic contrast-enhanced MRI (DCE-MRI) | Significantly higher BBB leakage rate in AD compared to controls in the grey matter; the leakage volume was significantly higher in the grey matter, in the normal-appearing white matter, and in the cortex | [95] | |
| Brain atrophy | Three-dimensional (3D) T1-weighted magnetisation-prepared rapid acquisition gradient-echo (T1-MPRAGE) sequence | Structural brain changes are accurately consistent with Braak stages of neurofibrillary tangle deposition and neuropsychological deficits. Rates of change in several structural measures, including whole-brain, entorhinal cortex, hippocampus, and temporal lobe volumes, correlate closely with changes in cognitive performance, validating atrophy in these regions as markers of AD. | [98,99,100,101,102,103,104] |
© 2018 by the authors. Licensee MDPI, Basel, Switzerland. This article is an open access article distributed under the terms and conditions of the Creative Commons Attribution (CC BY) license (http://creativecommons.org/licenses/by/4.0/).
Share and Cite
Femminella, G.D.; Thayanandan, T.; Calsolaro, V.; Komici, K.; Rengo, G.; Corbi, G.; Ferrara, N. Imaging and Molecular Mechanisms of Alzheimer’s Disease: A Review. Int. J. Mol. Sci. 2018, 19, 3702. https://doi.org/10.3390/ijms19123702
Femminella GD, Thayanandan T, Calsolaro V, Komici K, Rengo G, Corbi G, Ferrara N. Imaging and Molecular Mechanisms of Alzheimer’s Disease: A Review. International Journal of Molecular Sciences. 2018; 19(12):3702. https://doi.org/10.3390/ijms19123702
Chicago/Turabian StyleFemminella, Grazia Daniela, Tony Thayanandan, Valeria Calsolaro, Klara Komici, Giuseppe Rengo, Graziamaria Corbi, and Nicola Ferrara. 2018. "Imaging and Molecular Mechanisms of Alzheimer’s Disease: A Review" International Journal of Molecular Sciences 19, no. 12: 3702. https://doi.org/10.3390/ijms19123702