Article Text

Abstract
Background Flow diverter (FD) treatment aims to slow down blood flow inside the aneurysm and increase the average time that blood resides in the aneurysm.
Objective To investigate the relationship between vessel and aneurysm morphology and their influence on the way in which braided FDs change intra-aneurysmal hemodynamics.
Materials and methods Twenty-three patient-specific intracranial aneurysm models at the supraclinoid segment of the internal carotid artery were studied. Vessel and aneurysm morphology was quantified and blood flow was modeled with computational fluid dynamics simulations. The relation between morphologic variables and the hemodynamic variables, WSS (wall shear stress) and totime (ratio between the aneurysm volume and inflow at the aneurysm neck), was assessed statistically.
Results Intra-aneurysmal flow was less dependent on the vessel than on aneurysm morphology. In summary, after treatment with a FD, a greater aneurysm flow reduction and redirection to the vessel main stream should be expected for (a) aneurysms located further away from the curvature peak, (b) aneurysms on the inner side of the bend, (c) aneurysms with no proximal stenosis, and (d) larger aneurysms.
Conclusions Although the change in intra-aneurysmal hemodynamics after FD treatment strongly depends on the morphology of the aneurysm, the hemodynamic effect of a FD is also linked to the parent vessel morphology and the position and orientation of the aneurysm with respect to it.
- Aneurysm
- Angiography
- Flow Diverter
Statistics from Altmetric.com
Introduction
The study of intracranial aneurysm hemodynamics has grown considerably in recent years. Hemodynamics and morphology have proved to be powerful indicators of aneurysm rupture.1 ,2 The pioneering work of Ujiie et al showed a link between aneurysm morphology and local hemodynamics.3 Owing to its close link to hemodynamics, aneurysm morphology has often been considered when planning treatment.2 ,4–7 Studies have shown that local morphology and configuration of the aneurysm relative to the parent vessel also play a key role in intra-aneurysmal hemodynamics and should be considered.8 ,9 For instance, Passerini et al concluded that internal carotid arteries (ICAs) with “double bends” are less prone to develop intracranial aneurysms.10
Commercially available, braided flow diverters (FDs) provide a new alternative endovascular approach to treating aneurysms that are otherwise too risky or difficult to manage with conventional techniques.11 Although animal experiments and clinical studies have already demonstrated the impressive effectiveness of FDs, their effects on local hemodynamics are not yet fully understood.12 ,13 Nevertheless, delayed and complete angiographic occlusion is reported in most cases.14–16 Recent studies estimated treatment success based on angiographic images, and used computational fluid dynamics (CFD) to investigate the relation between aneurysm size and shape and flow reduction after FD insertion.17 ,18 CFD provides a non-invasive way of studying and predicting the effect of these devices on local hemodynamics.19 ,20
The combined study of aneurysm and vessel morphology in relation to FD treatment is relevant, but not yet developed. The purpose of this study is to provide a better insight into the relation between vessel and aneurysm morphologic variables, and intra-aneurysmal hemodynamic changes produced with braided, closed cell design FD treatment.
Materials and methods
Twenty-three aneurysm models were used in this study. This population was defined as explained below and was drawn from the @neurIST database. It was collected from different centers and processed by different observers following the same data protocol.21 Anatomic models were obtained from diagnostic three-dimensional rotational angiography images, acquired through an Integris Allura System (Philips Healthcare, Best, The Netherlands) or an AXIOM Artis (Siemens Medical Solutions, Erlangen, Germany). Voxel sizes in the reconstructed 3D images ranged from 0.208×0.208×0.208 mm3 to 0.378×0.378×0.378 mm3. These data correspond to those of a previous study we carried out, but where the questions asked and hypotheses were different.22
For an initial set of 40 aneurysms located at the supraclinoid segment of the ICA, three clinicians independently selected the most appropriate endovascular treatment. The criteria followed were (1) the absence of branching arteries (typically an ophthalmic artery or anterior choroidal artery) near to the aneurysm that could be occluded by the device and (2) an aneurysm that was suboptimal for treatment with coils because of its morphology and/or neck width. A subset of 23 aneurysms was chosen for treatment with FD by at least two clinicians. The remaining aneurysms (17) were considered more suitable for conventional treatment by two or more clinicians, and thus excluded from the study. Eleven aneurysms (48%) were located at the ophthalmic artery, nine (39%) at the posterior communicating artery and three (13%) at the anterior choroidal artery. Aneurysm sizes ranged between 1.3 and 22 mm. Seventy per cent of patients were female. Patient age was 50 (±8) years at the time of aneurysm discovery. Figure 1 presents the 21 ICAs studied.

Visualization of the 23 aneurysms used in this study. Two cases present two aneurysms.
Images were segmented using a geodesic active regions method, and a 3D triangulated surface model was generated.23 Triangle removal, hole filling and smoothing to preserve volume were employed to remove imperfections in the vascular models. Geometric models of the FDs, consisting of 48 wires on a single layer with a strut thickness of 60 µm were created and deployed in the vascular models using a virtual stenting method.24 The braiding angle was 60° in all cases. This was used as a reference and not intended to match any particular device available in the market. Although the braiding angle is preferably preserved after deformation, it is not forced by the deployment algorithm and might vary depending on the position on the stent mesh and the vessel/aneurysm geometry treated.
Aneurysm morphologic characterization
AngioLab software (Universitat Pompeu Fabra, Barcelona, Spain), which has been proved to have minimal interobserver variability, was used for manual isolation of the aneurysms.25 ,26 Morphologic variables were automatically computed from the isolated aneurysm dome (figure 2A). Only the morphologic variables most often reported and associated with aneurysm rupture and treatment planning, were selected for analysis (table 1).3 ,4
Aneurysm and vascular morphology variables observed and analyzed

(A) Graphical representation of the aneurysm sac morphologic variables (detailed in table 2). (B) Local vectors describing the aneurysm orientation with respect to the parent vessel. nOP is the normal vector of the local osculating plane, uB is the bifurcation vector reference system up-normal contained in the bifurcating plane and pointing towards the bifurcation apex, tV is the centerline tangent direction of the parent vessel at zero abscissa, and tA is defined as the centerline tangent direction, one inscribed sphere radius away from the zero abscissa along the aneurysm centerline into the aneurysm. Also, αn=α (nOP, uB) and αt=α (tV, tA) are indicated. (C) Graphical representation of the vessel morphologic variables studied. Cpeak indicates the location of the curvature peak before the aneurysm, o is the bifurcation reference system origin, dpeak is the distance between these two along the centerline. Maximum inscribed sphere radius, which is an approximation of the vessel radius, is shown as semi-transparent spheres along the centerline. (D) Schematic view of the aneurysm with the associated nOP and the change of uB (three positions) as the location of the aneurysm on the parent vessel changes. (E) Schematic view of the aneurysm showing tV and the change of tA (three positions) as the orientation of the aneurysm with respect to parent vessel changes. The aneurysm bifurcation apex is also indicated.
Vessel morphologic characterization
The vasculature surrounding the aneurysm was characterized using the Vascular Modeling Toolkit (figure 2B,C). The morphologic characterization was based on the work of Piccinelli et al.27 ,28 The vessel morphology was characterized by three variables—namely, dpeak (figure 2C), αn (figure 2D) and αt (figure 2E), which are described in table 1. Further details on the computation of these variables can be found online as supplementary content (see online file supplementary content_1).
CFD modeling/simulation
Volumetric meshes, with unstructured tetrahedral and eight-node prism elements, were generated using the commercial software ICEM CFD, V12.1 (ANSYS, Canonsburg, Pennsylvania). To ensure CFD simulations independent from mesh element size, a mesh independency analysis was carried out. The convergence criterion of mesh independence was that variables of interest—namely, wall shear stress (WSS), inflow at the aneurysm neck and intra-aneurysmal velocity had to be within 2.5% error from the finest tested mesh. Convergence was reached with an element size around the stent strut of 0.016 mm (ie, about 12 elements along the perimeter), three prism layers with a total height of 0.3 mm defined everywhere but in the region of the FDs, and a global tetrahedral element size of 0.3 mm. The total number of mesh elements ranged between 0.4 and 3.4 million elements for the untreated cases and between 2.6 and 15.2 million elements for the treated ones.
Following previous studies and because we were interested only in the effect of the FD inside the aneurysm, the portions of the stent lying on the vessel wall were removed to reduce mesh size and computational time, and only the portion of the stent covering the aneurysm neck was kept.19
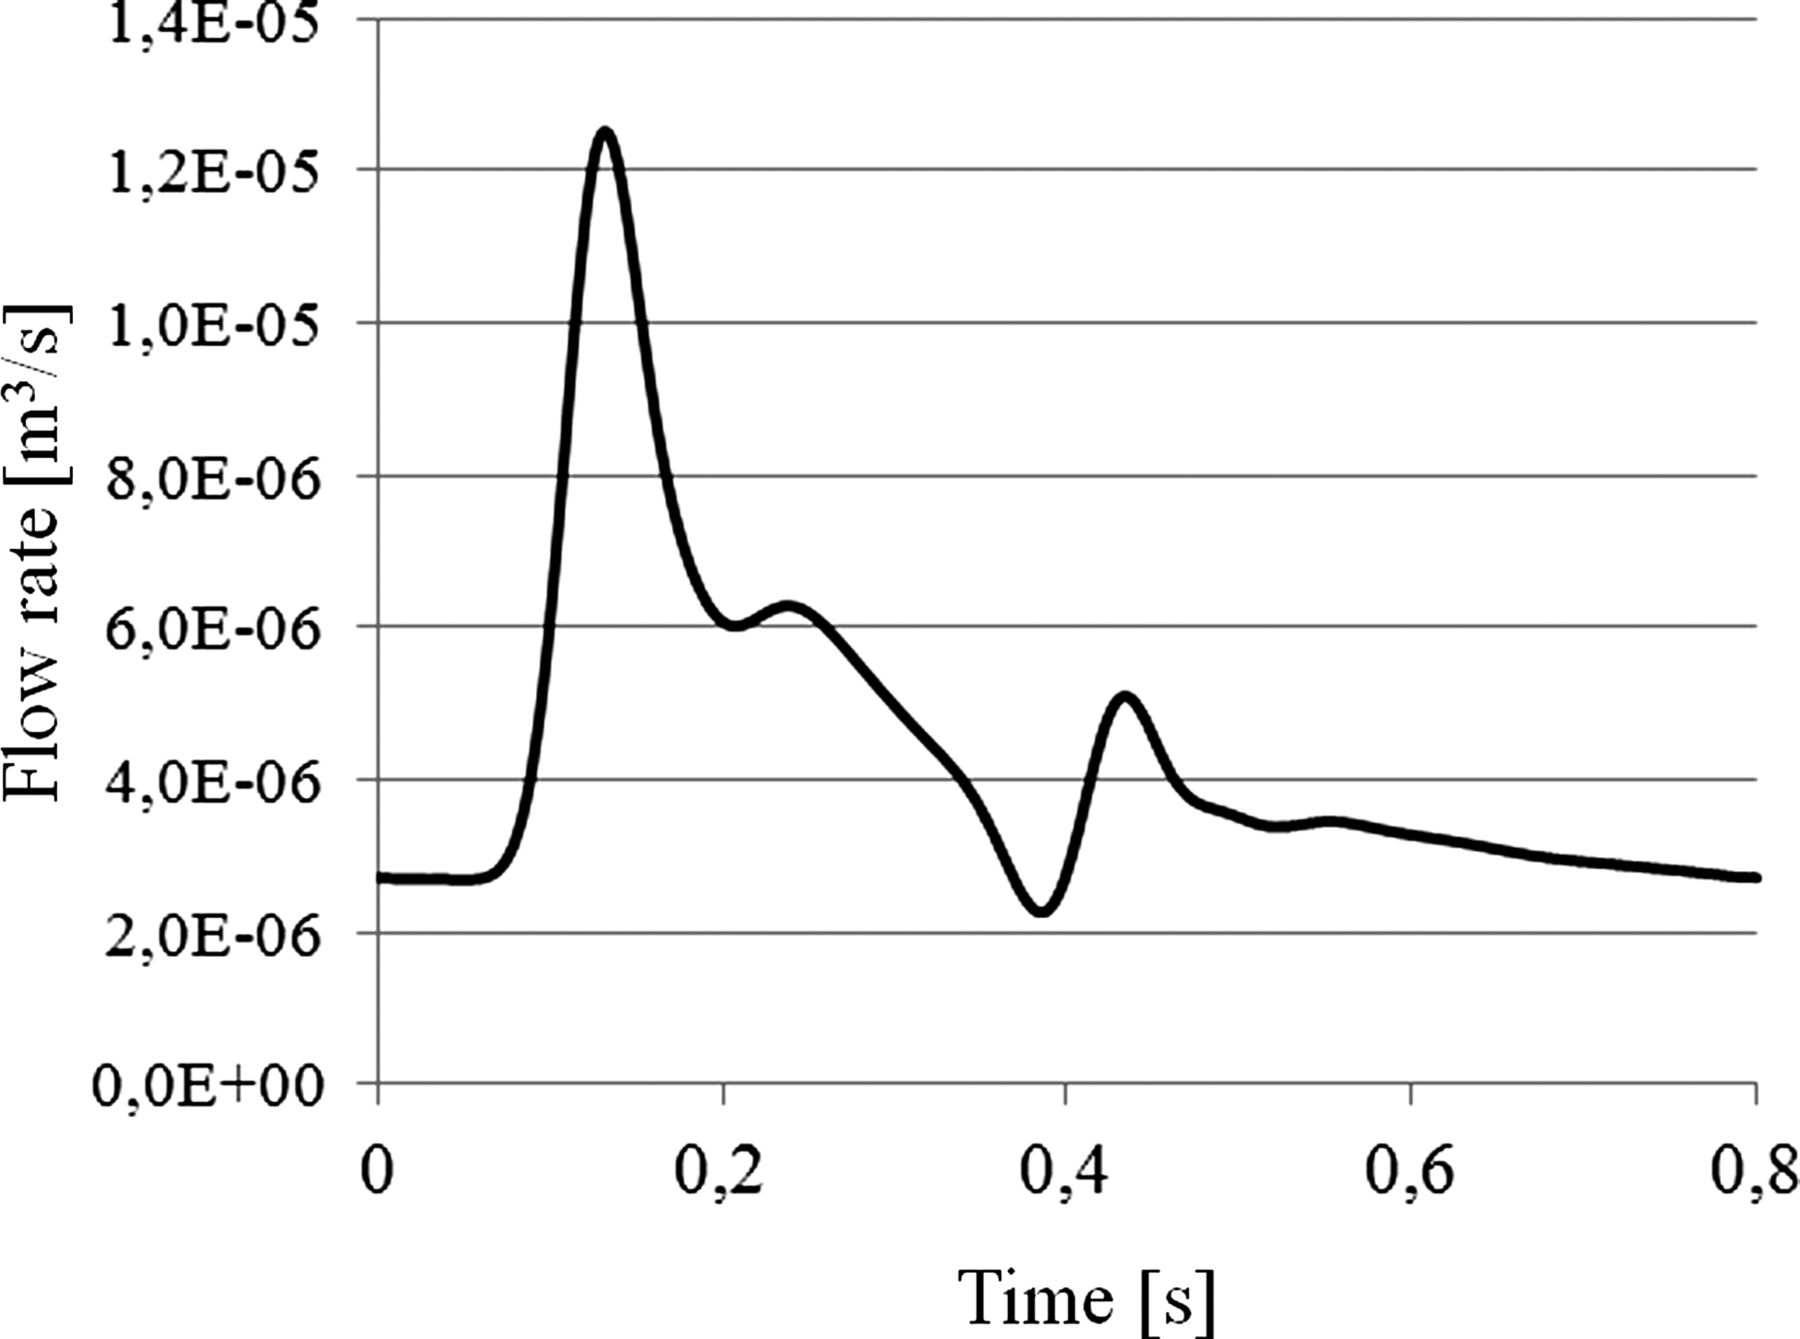
Unsteady CFD simulations were created with CFX, V.12.1 (ANSYS). Blood was modeled as an incompressible Newtonian fluid (density=1066 kg/m3, viscosity=0.0035 Pa×s). The vessel wall was assumed to be rigid with a no-slip boundary condition. A flow rate waveform was imposed at the inlet, and pressure waveforms at the outlets, all derived from a 1D mathematical model of the systemic arterial tree.29 A straight extension was added to the vascular model inlet and a flat velocity profile was imposed at the inlet of the extension. The combination of the extension and the considered vascular region causes the effects of the imposed velocity profile to vanish at the location of the aneurysm.30 The shape and average flow rate of the waveforms (figure 3) were the same for all cases so that geometrical effects stood out. Cardiac cycles of 0.8 s each were discretized in time steps of 0.005 s. To reduce initial transients, three complete cardiac cycles were computed and data of the third were analyzed.

Flow rate waveform used at the inlets of all the models. Inlet boundary conditions were imposed at the supraclinoid segment of the internal carotid artery.
Data analysis
The hemodynamic variables—namely, WSS and totime, were studied and correlated with aneurysm and vessel morphologic variables. WSS was averaged in space and time on the aneurysm wall.30 ,31 totime is defined as the ratio between the aneurysm volume (Va) and inflow at the aneurysm neck (Qa).32 ,33 These variables were recorded before (xuntreated) and after (xtreated) virtual treatment. All hemodynamic changes (xchange) between untreated and treated models reported in this work were calculated as 1
1
where a negative change in the hemodynamic variables indicates an effective increase after the insertion.
Data analysis was performed using the R statistical software package.34 Because data were non-parametric, Spearman’s correlation test was used and the coefficient ρ is reported. For all tests, statistical significance was considered for p<0.05 (indicated with *). Correlations were recorded between morphologic variables and both untreated hemodynamics and hemodynamic change due to FD insertion (Eq. 1).
The mean porosity of the FDs (φFD) was quantified by measuring the voids of the FD mesh from an image of the aneurysm neck for each case.
Results
Figure 1 shows the 21 cases hosting 23 aneurysms used in this study. Mean, SD, minimum and maximum of all morphologic variables are reported in table 2. As supplemental content of this article, is provided a text file with All data used for the data analysis can be found online in file supplementaryContent_2-data.
Aneurysm and vessel morphologic variables summary. All variables are expressed as mean±SD, minimum and maximum
Morphology and hemodynamics in ICA aneurysms
Table 3 summarizes the correlation results between morphologic and hemodynamic variables.
Morphologic versus pretreatment hemodynamic variables in ICA aneurysms correlations
Statistically significant correlations were found between totime and aneurysm morphological variables (Da, Aa, Va, An, and ARa, with ρ=0.52 to ρ=0.86). WSS was found to decrease (ρ=−0.42 to ρ=−0.50) with increasing Da, Aa, Va, and An.
totime correlated significantly with αn (ρ=−0.73) and αt (ρ=−0.72). This means that when the bifurcation apex is towards the outer side of the bend (larger αn), totime is smaller. As the aneurysm leans upstream (larger αt), totime is also found to be smaller.
Three cases presented four aneurysms with WSS >10 Pa (see figure 4, one aneurysm in case A, two aneurysms in case B and one aneurysm in case C), which is an order of magnitude above physiological values.35 A severe stenosis (∼70%) before the aneurysms was found in two of them (cases B and C). In these cases, upstream stenosis induced an increase in flow velocity (see streamlines in figure 4), which increased WSS and decreased totime. The case without stenosis (case A figure 4) corresponds to a small aneurysm where the main flow jet on the parent vessel penetrates the aneurysm. As counter examples, cases D, E, and F shown in figure 4 correspond to median WSS for this population (∼3.10 Pa). None of these presented a severe stenosis.
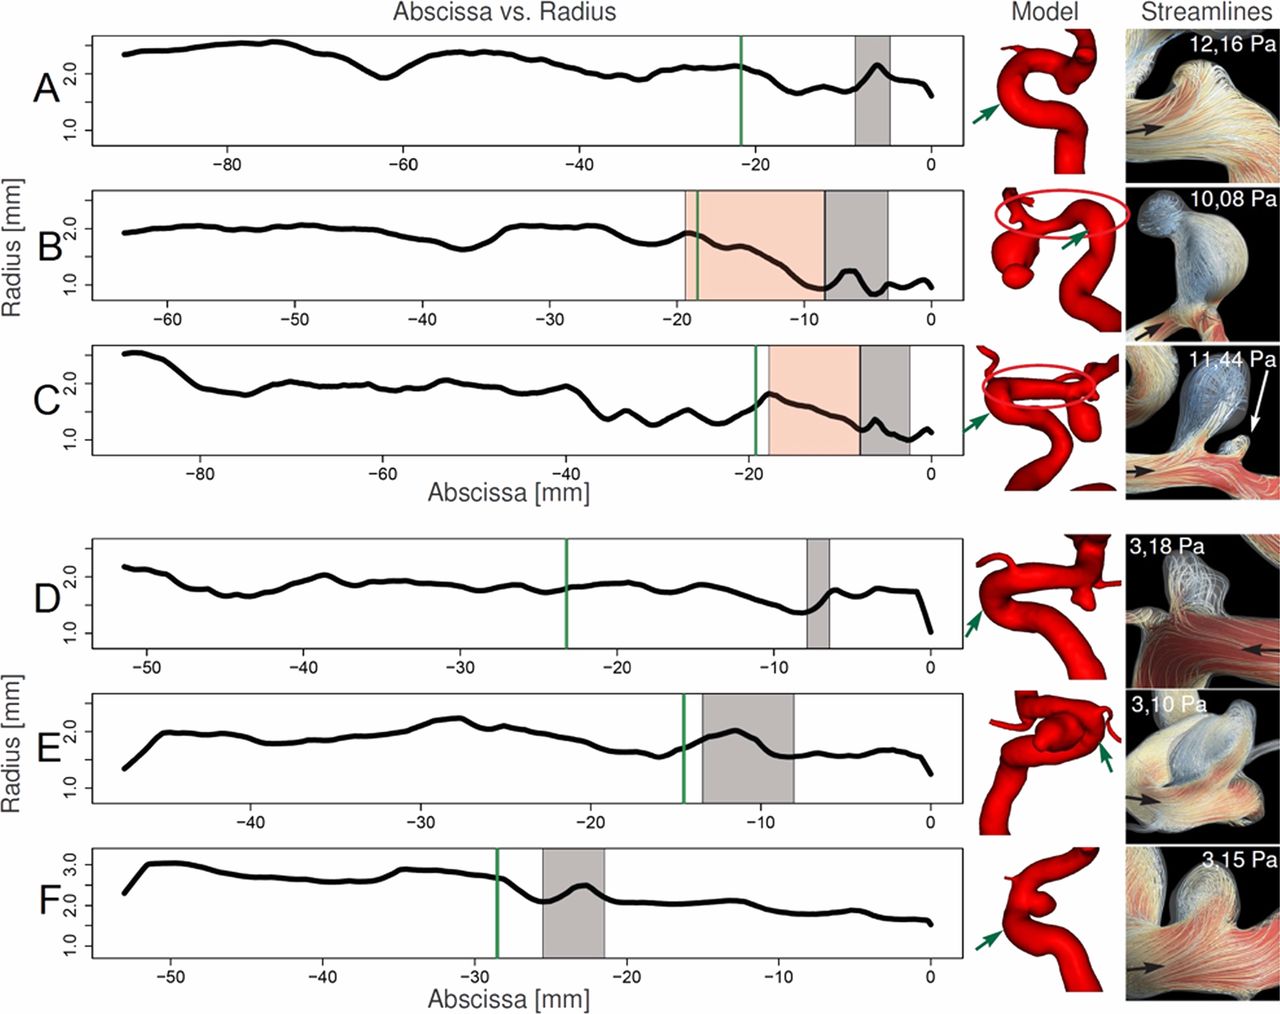
Position on the centerline abscissa versus maximum inscribed sphere radius. The green arrow indicates the peak curvature location. Aneurysm location is indicated in gray. A, B, and C are cases with high wall shear stress (WSS). D, E, and F are the three cases around the median WSS. The red region indicates the location of an acute stenosis with a fourfold reduction of cross-sectional area. On the right, are presented the geometrical models of each case with an oval highlighting the stenosis region for cases B and C and a green arrow indicating the location of the curvature peak. The black arrow indicates the direction of flow and the WSS before flow diverter insertion is also indicated for each case.
Figure 5 presents streamlines and velocity contours at peak systole for cases A to F both before and after the FD insertion. It can be seen that although the jet going into the aneurysm is dumped after the insertion of the FD, the flow jet direction and the vortex pattern inside the aneurysm remain almost identical.

Streamlines and velocity contours at peak systole for cases A to F presented in figure 4 both, before and after insertion of the flow diverter. The main jet stream entering the aneurysm is dumped but its direction and the vortex structure inside the aneurysm are not altered after the treatment. WSS, wall shear stress.
Figure 6 presents a scatterplot relating depth (Da) and αt, showing that larger aneurysms tend to lean downstream (smaller αt). Additionally, larger aneurysms present larger totime (table 3). Moreover, it was found that aneurysms with smaller αt will have smaller totime (confirmed by ρ=−0.72 for αt in table 3).

Scatterplot comparing depth (Da) and αt. The corresponding ρ for Spearman's test is shown. Also, a locally weighted polynomial regression line (blue) is shown where significant correlation was found.
Morphology in relation to hemodynamic changes after FD insertion
Table 4 presents correlations between morphologic variables, stent porosity, and reduction of hemodynamic variables (Eq. 1) after FD insertion.
Morphologic versus post-treatment hemodynamic variables reduction in ICA aneurysms correlations
FD insertion increased totime for all cases and its increment was larger for higher values of the aneurysm morphologic variables. WSS reduction inside the aneurysm was found to significantly correlate to all aneurysm morphologic variables (ρ=−0.49 to ρ=−0.55) except for ARa.
When the aneurysm bifurcation apex lies towards the outer side of the vessel (larger αn), the FD is less effective in reducing WSS and increasing totime. When aneurysms lean upstream (larger αt), the increment in totime is larger.
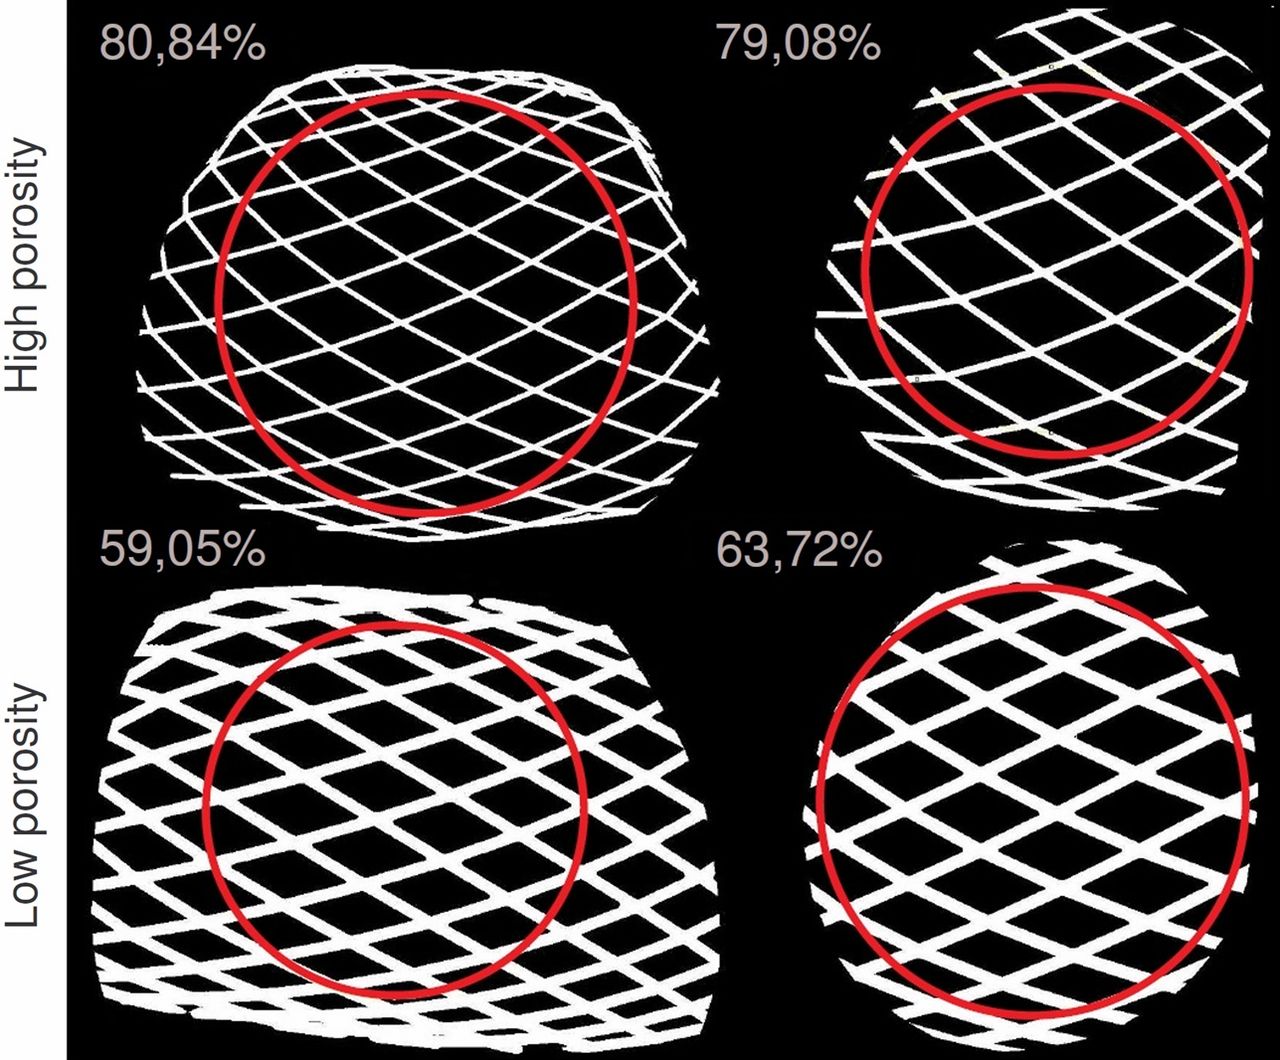
The mean±SD porosity φFD among all cases was 72.83±5.47, ranging from 59.51% and 80.85%. Figure 7 presents two cases with high porosity (top row), corresponding to larger vessel diameters. The two cases with low porosity (bottom row) correspond to the vessels with small diameter, which presented stenosis as shown in figure 4 and a denser FD mesh across the aneurysm neck. For smaller vessel diameters, the FD mesh is denser locally, resulting in a lower porosity. Images have different scales, but the thickness of stent struts is the same in all cases.
Computation of stent porosity. Red circles delineate the measured region and the numbers indicate the flow diverter porosity.
Significant correlation (ρ=−0.53) was found between φFD and WSS. Increasing FD porosity produced less reduction of WSS. Higher WSS reduction was seen for cases with elevated WSS (>10 Pa) before FD insertion, which corresponded to stenosed cases also presenting low FD porosity.
Discussion
The 23 cases in this study presented a wide range of sizes (Da from 0.98 mm to 20.60 mm) and shapes (both saccular and fusiform aneurysms). CFD analysis was performed on these cases before and after the virtual implantation of a FD, representing, braided, closed cell devices of an average porosity of 72.83±5.47, ranging from 59.51% to 80.85%. Flow is highly dependent on geometry, and the aneurysm morphology (neck area, aneurysm volume, etc) has a stronger influence on intra-aneurysmal flow than vessel morphology. Sato et al observed that a change in aneurysm position and orientation relative to the parent vessel induces substantial changes in aneurysmal flow patterns.36
A computational study, as presented here, is primarily oriented to analyze the effect under controlled conditions (ie, inflow, FD design). It benefits from these controlled conditions, enabling exploration of the proposed relationship between geometry and FD effect on hemodynamics.
The results obtained in this part of the study reproduce previous research, on aneurysm morphology and hemodynamics, which proves the correctness of the methodology.3–5 ,10 ,28 ,36 ,37 This same methodology was used to make a link between aneurysm and vessel morphology with hemodynamic changes induced by FD treatment, which is the main contribution and novelty of this work.
Hemodynamics in ICA aneurysms in relation to morphology
The WSS was found to decrease with increasing aneurysm morphology variables (Da, Aa, Va, and An), with statistically significant correlation between them (see table 3). An association between aneurysm size and shape and WSS was made by Ujiie et al and Raghavan et al, and for the first time, morphologic variables were considered in the assessment of intra-aneurysmal rupture risk.3 ,4 Our findings confirm that larger aneurysms have a lower WSS and larger totime than small aneurysms.
Two cases had a stenosis just before the aneurysm. These cases showed a fourfold reduction in cross-sectional area in the affected segment (∼10 mm long), and a fourfold increase in the mean velocity. As a result, the velocity inside the aneurysm increased, inducing an elevated WSS (>10 Pa).
As indicated in previous studies, configuration of the aneurysm with respect to the parent vessel is important in intra-aneurysmal flow.5 ,36 ,37 In particular, when the aneurysm is located on the outer side of the bend, the inflow is higher. Our results confirm this finding for ICA aneurysms with similar shape and configuration to those in the mentioned studies. The smaller turnover time in aneurysms with higher αn is produced by the larger inflow when the aneurysm is located on the outer side of the vessel.
Our results suggest that the angle between aneurysm and parent vessel is also relevant. The angle αn is similar to the inflow angle defined by Baharoglu et al.5 In that study, the inflow angle is associated with higher energy transmission to the dome and with a higher chance of rupture. Our analysis of αt in relation to Da showed that as aneurysms are larger they tilt upstream (larger αt, or similarly, larger aneurysm). Larger aneurysms also presented larger totime and therefore, aneurysms tilting upstream showed a higher totime, an effect of the combination of size and orientation.
Reduction of hemodynamic variables after FD insertion in relation to morphology
The hemodynamic effect of FDs was characterized by analysis before and after treatment. Previous studies have shown that the presence of a FD reduces WSS inside an aneurysm, which is confirmed by our results.38–40 Additionally, we observed that aneurysms with relatively high WSS before treatment had a larger reduction in WSS.
FDs introduced into small vessels presented a low porosity (figure 7). This occurs because the number of wires of the FD (48 wires, 24 turning left and 24 turning right) and the width of the wires is constant and therefore, when the vessel has a smaller diameter, the porosity of the stent mesh is lower.
The dpeak had an impact on WSS reduction. We observed that aneurysms that were closer to the Cpeak (lower dpeak) had less WSS reduction (ρ=−0.49). Closer to the peak, inertial effect due to vessel curvature is stronger, and secondary flow due to the Dean effect is more evident.8 Also as outlined by Thevenin et al, the effect of flow diverters is stronger on straight tubes than on curved ones, which is equivalent to the aneurysm being located far away or near the curvature peak, respectively.41
Aneurysms located on the outer side of the vessel bend had a smaller increase of totime. These cases are also prone to have shorter totime before the FD insertion (ρ=−0.73). Sato et al similarly found that the inflow into an aneurysm located on the outer side of a vessel is larger than the inflow into an aneurysm with equivalent shape and size on the inner side of the vessel.8 ,9 Additionally, after the insertion of the FD the absolute increase in totime is lower for aneurysms on the outer side of the bend. Owing to inertia, more flow of the parent vessel reaches the aneurysm when it is located on the outer side of the bend and therefore, the totime increase after FD insertion is smaller for such aneurysms.41
The FD does not alter the direction of the aneurysm inflow jet. It was observed that although the flow velocity is diminished inside the aneurysm and the inflow jet is dumped after the FD insertion, the main flow direction is not altered and the flow patterns inside the aneurysm are not modified substantially in most cases. Because the change induced by the FD mainly affects the intensity of aneurysm inflow, depending on the parent vessel and aneurysm geometry, and the patient flow conditions, the sole use of a single FD might not be enough to substantially decrease intra-aneurysmal flow below the critical threshold that would ensure aneurysm occlusion.
In this work, we studied the absolute rather than the relative differences in flow from baseline after FD placement. In a previous study, it was found that the relative change in hemodynamic variables was larger for smaller aneurysms.22 However, the hemodynamic conditions required for the occlusion of an aneurysm by hemostatic thrombosis most often cited in literature are absolute and not relative to the pretreatment condition.42 For these reasons absolute values of flow variables at baseline and post-treatment reduction were considered. It is important to notice that although the effect was larger for small than for large/giant aneurysms, some of the small aneurysms presented higher WSS and shorter totime after treatment than most of the large/giant aneurysms did before the treatment.
General considerations and applications
From the results and discussion presented in this paper, a series of considerations should be taken into account by the clinician. In summary, after treatment with a FD, a larger reduction in aneurysm flow and redirection to the vessel main stream should be expected for (a) aneurysms located further away from the Cpeak, (b) aneurysms on the inner side of the bend, (c) aneurysms with no proximal stenosis, and (d) larger aneurysms. These aspects should be taken into consideration for their impact on the choice of treatment and on the post-treatment evolution and follow-up.
Limitations of the study
Different assumptions and hypotheses were considered for the development of this study. First, only a portion of the FD inserted into the parent vessel was modeled. Previous studies have shown that the parent vessel undergoes an increase in resistance due to the presence of a FD, so including only a portion of the FD might have led to small inaccuracies in the calculated pressure drop. Second, the vascular wall was modeled as rigid, implying an overestimation of pressure.14 Third, the resistance by peripheral vascular beds was not taken into account, and only pressures from a 1D arterial tree model were considered at the outlets. We assume that the inaccuracies in pressure conditions are small and will not have affected the conclusions of our study.
All cases in this study corresponded to the supraclinoid segment of the ICA to reduce differences in flow conditions and highlight the effect of geometry. The reader should be aware of this choice as the conclusions of this study may not hold for other locations.
Further aspects of patient-specific conditions of the coagulation system, including use of antiaggregants, were not considered in the simulations. This additional complexity will influence the event of aneurysm thrombosis in a given patient; however, it is unlikely that it will significantly affect flow produced by the FD.
Conclusions
In this study, the relation between parent vessel and aneurysm morphology, and intra-aneurysmal hemodynamics before and after FD treatment were investigated. The study included aneurysms located at the supraclinoid segment of the ICA with identical flow boundary conditions to identify differences due to morphology.
Aneurysm position and orientation with respect to its parent vessel were shown to be important, but aneurysm morphology showed higher correlation with WSS and totime. The presence of a stenosis before the aneurysm induced an increased intra-aneurysmal WSS and a decreased totime.
After FD insertion, intra-aneurysmal flow reduction was also found to depend on aneurysm position and orientation with respect to the parent vessel, but again, this effect was subordinate to aneurysm morphology. Finally, the vessel diameter had an impact on stent porosity, which is a determinant of flow reduction after treatment.
References
Supplementary materials
Supplementary Data
This web only file has been produced by the BMJ Publishing Group from an electronic file supplied by the author(s) and has not been edited for content.
Files in this Data Supplement:
- Data supplement 1 - Online supplement
- Data supplement 2 - Online data
Footnotes
-
Contributors IL designed the study, analyzed the data, drafted the manuscript. AJG processed the data, analyzed the data, revised the manuscript. HGM MLA, DAR analyzed the data, revised the manuscript. All authors gave final approval of the manuscript.
-
Funding From the Networking Biomedical Research Center on Bioengineering (IL, AJG, HGM, MLA), Biomaterials and Nanomedicine (CIBER-BBN) and Universitat Pompeu Fabra, Barcelona, Spain; National Scientific and Techical Research Council (CONICET) - Argentina (IL) and Hirslanden Clinic (DAR), Zürich, Switzerland. This research has been partially funded by the Industrial and Technological Development Center (CDTI) under the CENIT-CDTEAM and CENIT-cvREMOD programs, the European Commission project @neurIST (IST-2005-027703).
-
Competing interests None.
-
Provenance and peer review Not commissioned; externally peer reviewed.
-
Data sharing statement An electronic copy summarizing the numerical data studied in this work is provided as supplementary material. These data remain owned by the authors and the associated rights reserved.