Article Text

Abstract
Background It is thought that aneurysms evolve as the result of progressive degradation of the wall in response to abnormal hemodynamics characterized by either high or low wall shear stress (WSS).
Objective To investigate the effects of these two different hemodynamic pathways in a series of cerebral aneurysms with known rupture sites.
Methods Nine aneurysms in which the rupture site could be identified in three-dimensional images were analyzed. The WSS distribution was obtained from computational fluid dynamics (CFD) simulations. Internal wall stresses were computed using structural wall models under hemodynamic loads determined by the CFD models. Wall properties (thickness and stiffness) were modulated with the WSS distribution (increased or decreased in regions of high or low WSS) to test possible wall degradation pathways. Rupture probability indices (RPI) were calculated to compare different wall models.
Results Most rupture sites aligned with the intrasaccular flow stream and downstream of the primary impaction zone. The model that best explained the rupture site (produced higher RPI) in eight of the nine aneurysms (89%) had thinner and stiffer walls in regions of abnormally high WSS. The remaining case (11%) was best explained by a model with thinner and stiffer walls in regions of abnormally low WSS.
Conclusions Aneurysm rupture seems to be caused by localized degradation and weakening of the wall in response to abnormal hemodynamics. Image-based computational models assuming wall thinning and stiffening in regions of abnormally high WSS were able to explain most of the observed rupture sites.
Statistics from Altmetric.com
Introduction
Although the exact processes responsible for the formation, growth and rupture of intracranial aneurysms are not well understood, it is thought that aneurysms evolve mainly as the result of progressive degradation of the vascular wall in response to abnormal hemodynamics.1 Risk factors such as smoking, gender, age, family history, and hypertension may act as aggravating or predisposing conditions that accentuate or facilitate this progressive cycle of wall degradation and hemodynamic deterioration.1 Eventually, the aneurysm either stabilizes through wall remodeling or ruptures when the wall stress exceeds the wall strength.2 Trigger events associated with aneurysm rupture are thought to produce sudden increases in the wall stress and cause the rupture.1 However, the pathways that lead to wall degradation and weakening are not well understood. Researchers have proposed different mechanobiological processes in response to both abnormally low and abnormally high wall shear stress (WSS).3 Low WSS is thought to be injurious to the wall through stagnation of flow and local inflammatory effects that could lead to wall thickening and atherosclerosis or wall thinning through destruction from inflammatory mediators. High WSS is thought to work through effects on the endothelium and increasing a nitrous oxide-mediated pathway to upregulate degradative processes in the normal wall remodeling mechanisms. Either pathway could result in structural changes in the wall in a localized region and affect the structural integrity of the aneurysm wall.
By studying a series of cerebral aneurysms in which the site of rupture is known, we have investigated the effects of the two different hemodynamic pathways. We used computational models to calculate the local wall stress resulting from different hypothetical associations of the local hemodynamic environment and wall properties and attempted to determine which of the hypotheses best explains the point of rupture in each aneurysm.
Methods
Anatomical models
Nine ruptured cerebral aneurysms with associated focal intraparenchymal hemorrhage or blood extravasation were identified from our databases of aneurysms imaged with three-dimensional rotational angiography (3DRA). The rupture sites were determined by inspection of extravascular blood in volume rendered 3D angiograms (n=4) and/or additional CT images (n=5) (figure 1). The most likely rupture site was identified as the contact region between the aneurysm surface and the extravascular blood. A patient-specific vascular model of each aneurysm was created from the 3DRA images.4 The aneurysm neck was interactively traced on the reconstructed model and used to subdivide it into ‘aneurysm’ and ‘parent artery’ regions.5 The region of the most likely site of rupture was interactively delineated on the aneurysm surface and used to further subdivide the model into ‘rupture site’ and ‘aneurysm sac’ regions.

Determination of rupture regions. Example 1: (A) Three-dimensional (3D) angiography showing blood extravasation; (B) reconstructed model with identified rupture site. Example 2: (C) CT angiogram slice showing aneurysm and intraparenchymal hematoma; (D) volume rendering of CT angiogram showing aneurysm and extravascular blood; (E) volume rendered 3D angiography; (F) reconstructed model with identified rupture site.
Hemodynamics models
Tetrahedral grids with 0.1 mm resolution were generated filling the volume of each vascular model.4 These computational fluid dynamics (CFD) grids contained between 2 and 6 million elements and were used for flow simulations. Blood flow was mathematically modeled with the 3D unsteady Navier–Stokes equations.6 Blood was considered an incompressible Newtonian fluid with a density of 1.0 g/cm3 and a viscosity of 0.04 Poise. Pulsatile flows were prescribed at the model inlet using the Womersley velocity profile.7 The flow waveform at the inlet was derived from phase contrast MR measurements in normal subjects8 and scaled with the vessel area to achieve a mean WSS of 15 dyne/cm2 at the inlet for all subjects.9 Traction-free boundary conditions were imposed at the outlets, except for small vessels where flow rates were estimated from the principle of minimum work (Murray's law).10 CFD simulations were carried out for two cardiac cycles. The results of the second cycle were saved at 100 snapshots for subsequent analysis. Mean pressure and WSS were calculated by averaging over the cardiac cycle. All flow calculations were performed in parallel with an in-house finite element flow solver. Each CFD run took approximately 4 h on eight cores of a shared memory system with 32 Intel Xeon 2.2 GHz processors.
Wall biomechanics models
A computational structural dynamics (CSD) model of each aneurysm was constructed to estimate the stress distribution within the wall. Five layers of prism elements were created by extruding CFD surface points along the normal direction. The wall thickness was set to 200 μm in the parent artery and to 70 μm in the aneurysm.11 The resulting CSD grids contained between 0.5 and 1 million elements.
The vessel wall was mathematically modeled as a 3D continuous medium. Wall properties were approximated with an isotropic non-linear hyperelastic constitutive model.12 The wall density was set to 1.0 g/cm3, the wall stiffness to 1.0×10⁷ dyne/cm2 and the Poisson ratio to 0.499.11 The ends of the solid model (inlet/outlet boundaries of the CFD mesh) were kept fixed. The inner surface of the model was loaded with the mean pressure and WSS computed in the CFD simulations. Steady-state CSD simulations were carried out to compute the internal wall stresses. The maximum eigenvalue of the resulting stress tensor was calculated and averaged along the vessel thickness and used as a measure of the local wall stress. All CSD simulations were carried out in parallel using an in-house finite element structural solver.13 Each CSD run took less than 1 h on 128 processors of a distributed memory system equipped with 3056 nodes composed of two eight-core Intel SandyBridge-EP 2.6 GHz processors.
The aneurysm wall thickness and stiffness were modulated with the mean WSS distribution obtained with the CFD models. Specifically, the wall thickness and stiffness were either decreased or increased in regions of abnormally low WSS (mean <5 dyne/cm2) or high WSS (mean >20 dyne/cm2) or left uniform throughout the aneurysm. Wall thickness and stiffness were adjusted up or down by 30% and 50%, respectively. The wall models considered are listed in table 1. For subsequent comparisons, the wall stress was normalized with the average wall stress obtained with the uniform wall model (model A).
Vascular wall models
Analysis
Since aneurysms are thought to rupture when the internal wall stress (not to be confused with the flow-induced WSS) exceeds the wall strength, a rupture probability index (RPI) similar to the one proposed for abdominal aortic aneurysms14 was defined as:

The wall strength is defined as the stress at which the wall breaks (failure stress). Since the wall strength of each aneurysm was unknown, it was assumed that when the wall degrades, in addition to becoming thinner and/or softer/stiffer it also became weaker —that is, had a lower failure stress. The wall strength was therefore assumed to be proportional to the wall thickness. The RPI was calculated as:

where σ is the internal wall stress, σ0 the mean wall stress for model A (for normalization), h is the wall thickness and h0 is the wall thickness of model A (uniform). Because the patient-specific distribution of material properties of the wall are unknown, this index is not an absolute indication of rupture when it exceeds unity (RPI >1), but a larger value would indicate an increased probability of rupture.
Results
Hemodynamics
Visualizations of the flow dynamics at peak systole are presented in figure 2 for each aneurysm. Inspection of these visualizations shows that the rupture sites tend to be aligned with the inflow stream and are located near regions of primary or secondary flow impingement. They do not seem to coincide with regions of sluggish flow, or with the regions of either the highest or lowest WSS.
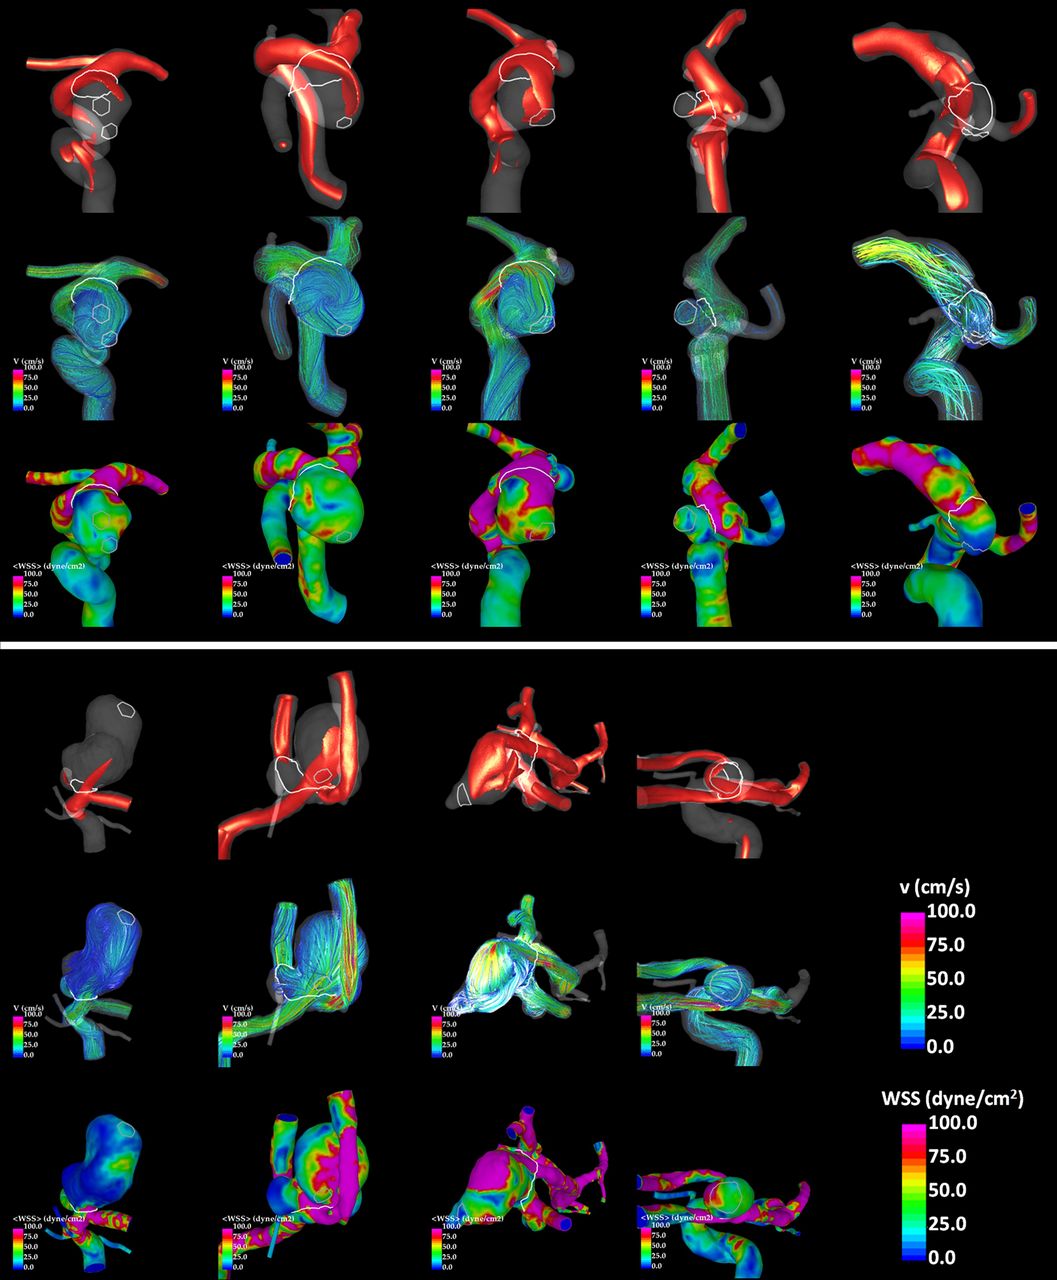
Flow visualizations for each aneurysm (columns): isovelocity surfaces of 10 cm/s (top), streamlines colored with the flow velocity (center), and mean wall shear stress magnitude (bottom). Rupture sites are delineated.
Wall biomechanics
The mean (µ) and maximum (m) normalized RPI of the rupture site are presented in table 2. These results indicate that the model that could best explain the observed rupture site was model I (thinner/stiffer walls in high WSS regions) in eight of the nine cases (89%) and model O (thinner/stiffer walls in low WSS regions) in one (11%). It was observed that changing the wall thickness had, in general, a much larger effect than changing the wall stiffness. Thus, model I was only a slight improvement over model B (thinner walls in high WSS regions) and model O over model C (thin walls in low WSS regions).
Relative mean (µ) and maximum (m) rupture probability index (RPI) of the known ruptured region for each wall model considered
Visualizations of the RPI for models A (uniform walls), I and O are presented in figure 3. The highest RPI at the rupture sites are observed with model I in eight of the nine cases, and with model O in the remaining case. Additionally, looking at the location of the maximum RPI with respect to the rupture site confirms that the model that best explained the rupture sites was model I. Interestingly, the regions of high RPI for the best model (I) were in general displaced downstream towards the dome with respect to the regions of high WSS.

Visualizations of the rupture probability index (RPI) distribution. Top row of each panel: RPI obtained with model A (uniform wall thickness) for each aneurysm. Center row of each panel: RPI obtained with model I (thinner/stiffer walls in regions of high WSS) for each aneurysm. Bottom row of each panel: RPI obtained with model O (thinner/stiffer walls in regions of low WSS) for each aneurysm. The RPI distributions corresponding to the wall models that best explain the observed rupture sites are highlighted with a yellow frame.
Discussion
Evidence of local wall differences are supported by pathological observations,15 surgical observations,16 and imaging studies.17 Our study makes a first attempt at evaluating the effects of a localized structural change in the wall on the stresses that may result in wall failure. Hemodynamic simulations were used to separate the aneurysm wall into different hemodynamic environments. We then varied the wall structure (increased or decreased the stiffness and/or thickness) in each of the regions in a systematic way to test the effects of these changes on the mechanical stress and correlated that mapping to the region of identified rupture.
Wall thinning is thought to be related to media layer degradation from smooth muscle cell apoptosis triggered by matrix metalloproteinase production (MMP) or macrophage infiltration and inflammation, depending on the triggering hemodynamic environment. The wall becomes softer in relation to breakage or degradation of the collagen, perhaps due to dysfunction of collagen-producing cells, smooth muscle cells in the media and fibroblasts in the adventitia. Alternatively, stiffening could result if the destruction of the media layer led to recruitment of the collagen structure from the adventitia. In either scenario the wall becomes weakened due to the thinner and more fragile collagen fibers being produced by the malfunctioning collagen depositing cells (smooth muscle cells or fibroblasts). The precise degree and relative amounts of stiffening, thinning and wall weakening are unknown.
Using hemodynamics mapping alone in our study was not sufficient to explain the rupture sites. Sites of rupture do not seem to coincide with regions of sluggish flow or with the regions of either the highest or lowest WSS. Although rupture sites tended to be aligned with the main flow stream within the aneurysm sac, they were found in regions of high, low or moderate WSS. Berg et al18 found similar results in their evaluation of four aneurysms correlating rupture points with CFD analysis. However, Omodaka et al19 and Fukazawa et al,20 using surgical observations to identify rupture points in middle cerebral artery aneurysms, found that rupture sites were associated with regions of low velocity and low WSS. They also noted flow separation near the rupture points and blebs in the majority of their aneurysms. The reasons for the apparent disagreement are unclear. However, the differences in the method used for identifying the rupture points (hematoma correlation vs inspection at surgery) and the location of the aneurysms may account for some variations in the results. In our series the aneurysm domes all had regions of elevated WSS in addition to large areas of low WSS, in contrast to the study by Fukazawa et al. Another striking difference is that only one aneurysm in our series contained a bleb, and this bleb was not in the identified rupture region. In contrast, in the studies by Omodaka et al19 and Fukazawa et al,20 most of the aneurysms contained blebs and these blebs were most often identified as the site of rupture. The marker of bleb formation may indicate a different mechanism leading to rupture or perhaps the blebs were formed at the time of rupture and the ‘pre-bleb’ condition should be considered. In a further study of their series, Omodaka et al21 performed CFD analysis after removing the blebs and found the wall regions of bleb formation were at relatively higher WSS, in agreement with similar previous studies.
The inability of hemodynamics alone to predict increases in wall stress is not surprising after reviewing the results of our simulations. Alterations in the wall properties led to stresses that extended into the adjacent wall at a distance from the hemodynamic effects. The regions of elevated stresses and elevated RPI tended to be located more downstream from the flow effect, resulting in a shift towards the dome. A flow impaction near the aneurysm neck could result in increased stress in the aneurysmal wall within the body and dome where the flow is typically lower.
Both the high and low WSS mechanisms share the assumption that hemodynamic conditions lead to a localized weakening of the aneurysm wall. The results of our study appear to support this assumption. In none of the cases we studied did simulation A, performed with uniform wall properties, better explain the site of rupture than a model with a focal change in the wall structure. Making localized changes by thinning the wall in the region of high WSS (model B) led to an improvement, while this change in zones of low WSS (model C) led to no improvement or to worse results. Softening the wall in either low or high WSS zones or stiffening the wall in the high WSS zone without a change in wall thickness led to somewhat worsening results. Combining wall thinning and stiffening led to the best explanation for the location of rupture, with wall thinning and stiffening in regions of abnormally high WSS (model I) as the conditions that best explained the rupture site in 89% of the aneurysms of our sample. In one case (11%) the rupture site was best explained by the model that assumed wall thinning and stiffening in regions of abnormally low WSS (model O).
This study has a number of limitations: (1) the sample was small and did not include a broad range of aneurysm locations and geometries; (2) the determination of the rupture sites was somewhat subjective; (3) the wall biomechanics model and material properties were idealized; (4) both the solid and fluid mechanics models make a number of assumptions and approximations and are not completely patient-specific. The relative changes in material properties (30% for wall thickness and 50% for stiffness) were chosen arbitrarily for testing our hypotheses but producing reasonable values consistent with wall thickness and stiffness previously reported.11 Since we observed that wall thickness had a larger effect on wall stress than stiffness, we selected a slightly larger relative change in stiffness (50% instead of 30%). Future sensitivity studies should be conducted to further investigate the relative importance of these effects. Despite these limitations, the computational experiments described in this study support the idea that the mechanisms of aneurysm progression towards rupture are based on a localized degeneration and weakening of the vascular wall induced by abnormal hemodynamic loading. In this series high WSS appears to be the more important of the two proposed mechanisms, but the findings suggest that low WSS changes could have an important independent effect. Our analysis considered only aneurysms with visible focalized rupture sites so the conclusions may not apply to other aneurysms with possible diffuse ruptures or to unruptured aneurysms that could follow a different pattern of wall degradation. These hypotheses and the detailed mechanobiologic processes need to be further tested and investigated with larger samples, more sophisticated wall models, and more patient-specific data.
Conclusions
The results of our study seem to support the hypothesis that aneurysm rupture is caused by localized degradation and weakening of the vascular wall in response to abnormal hemodynamics. Wall thinning seems to have a larger effect on the wall stress than wall stiffening or softening. Image-based computational models assuming wall thinning and stiffening in regions of abnormally high WSS were able to explain most of the rupture sites observed in a series of intracranial aneurysms.
References
Footnotes
Contributors JRC: study design, CFD modeling, data analysis, manuscript drafting; MV: wall mechanics modeling and analysis; DMS: image-based model reconstruction; GH: wall mechanics modeling; ST: data collection, rupture site identification; ES: data collection, rupture site identification; CB: data collection; PL: study design, data interpretation; CMP: study design, data interpretation, manuscript preparation.
Funding This work was supported by the National Institutes of Health grant number R01NS59063 and by Severo Ochoa Program of the Spanish Government grant number SEV-2011-00067.
Competing interests None.
Ethics approval George Mason University IRB.
Provenance and peer review Not commissioned; externally peer reviewed.
Data sharing statement Fluid and wall mechanics models are freely available upon request.